. 2021 Mar 1;34(7):531-550.
doi: 10.1089/ars.2019.7929. Epub 2020 Jul 7.

The Determining Role of Mitochondrial Reactive Oxygen Species Generation and Monoamine Oxidase Activity in Doxorubicin-Induced Cardiotoxicity

Affiliations

The Determining Role of Mitochondrial Reactive Oxygen Species Generation and Monoamine Oxidase Activity in Doxorubicin-Induced Cardiotoxicity

Salvatore Antonucci et al. Antioxid Redox Signal. .

Abstract

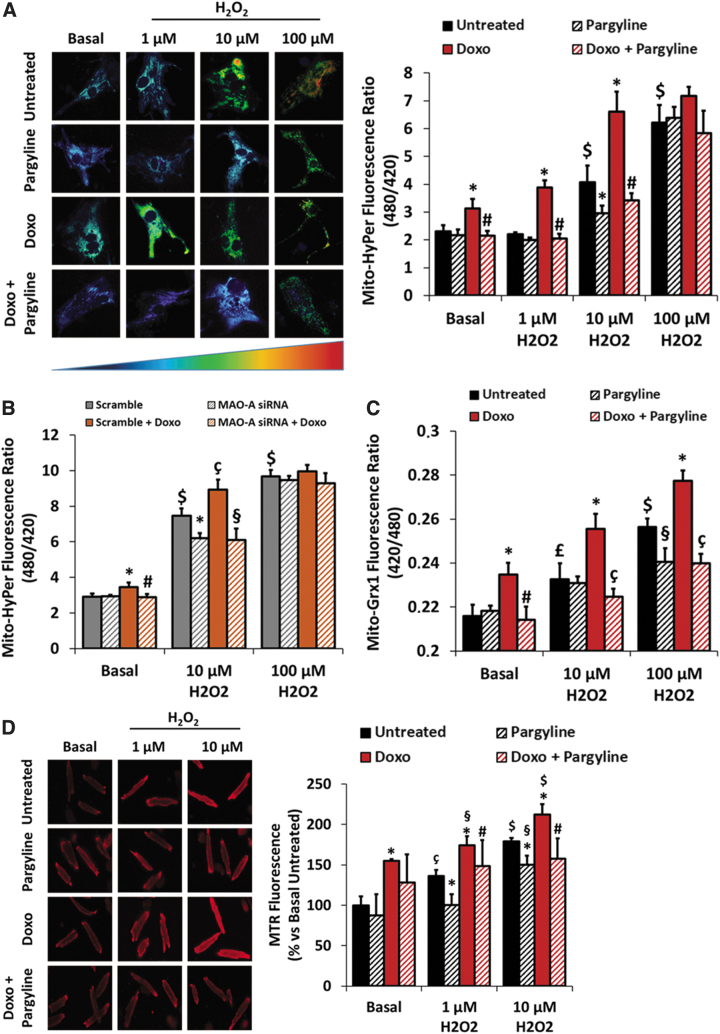
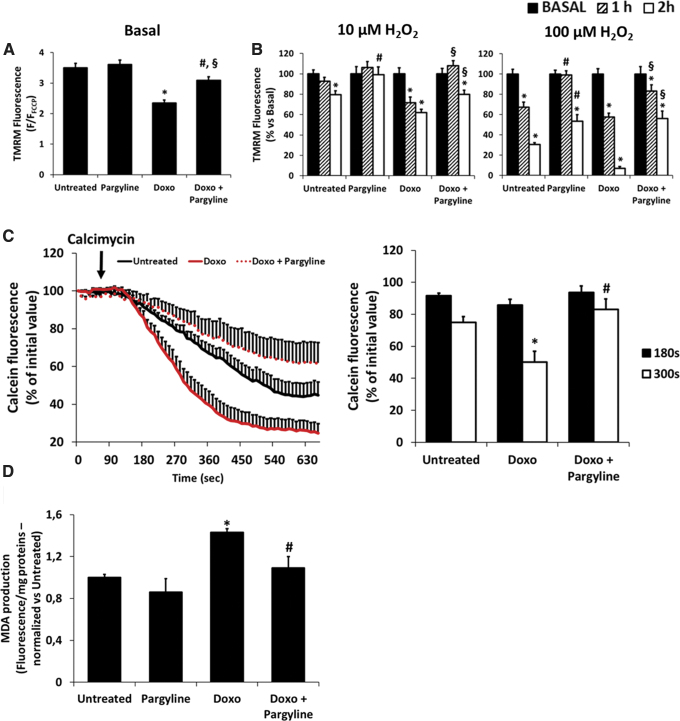
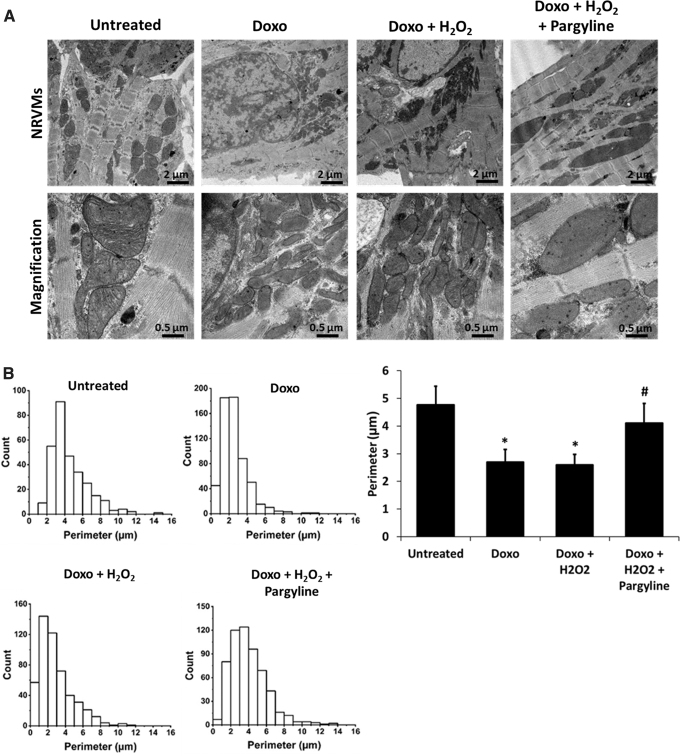
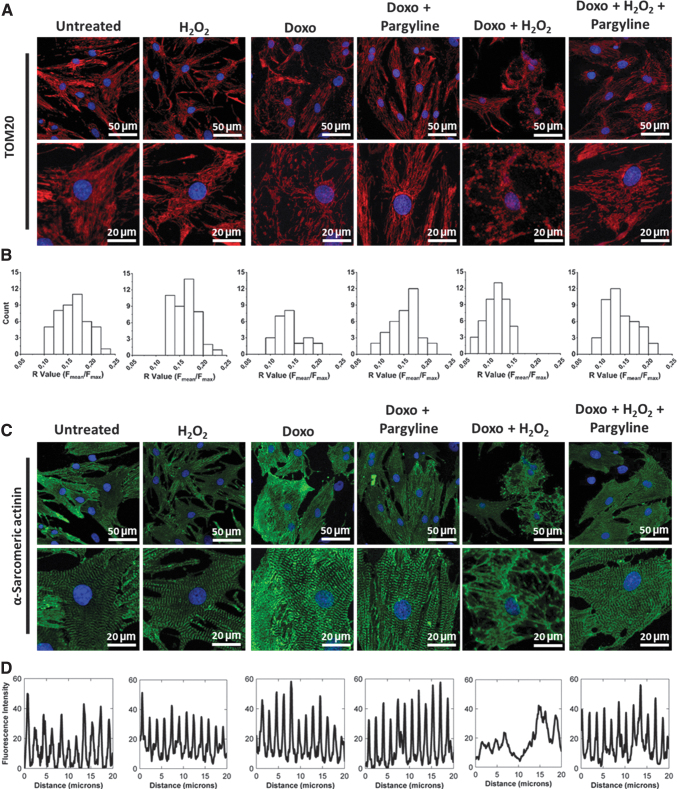
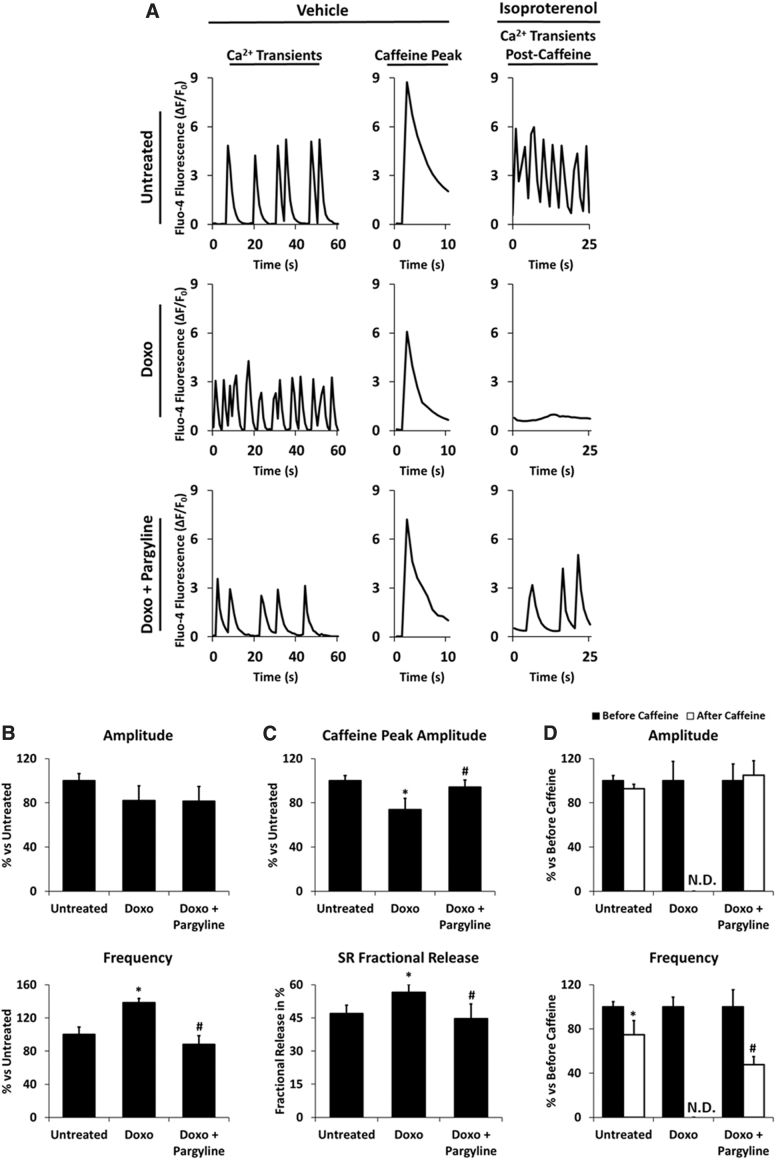
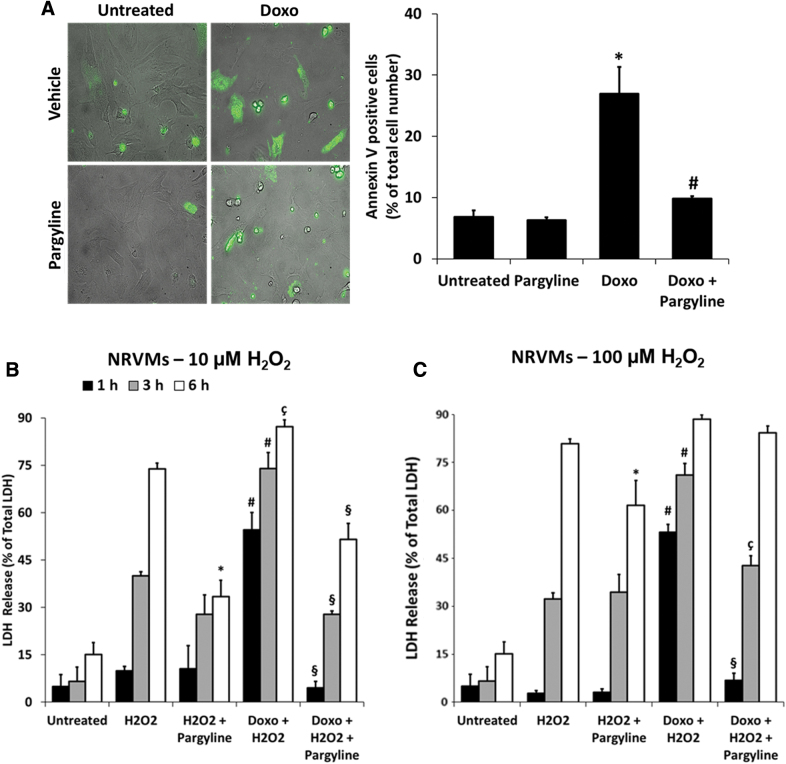
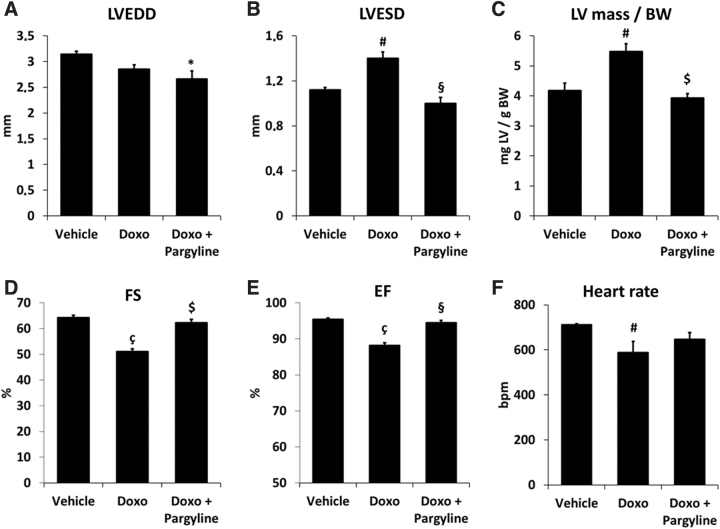
Aims: Doxorubicin cardiomyopathy is a lethal pathology characterized by oxidative stress, mitochondrial dysfunction, and contractile impairment, leading to cell death. Although extensive research has been done to understand the pathophysiology of doxorubicin cardiomyopathy, no effective treatments are available. We investigated whether monoamine oxidases (MAOs) could be involved in doxorubicin-derived oxidative stress, and in the consequent mitochondrial, cardiomyocyte, and cardiac dysfunction. Results: We used neonatal rat ventricular myocytes (NRVMs) and adult mouse ventricular myocytes (AMVMs). Doxorubicin alone (i.e., 0.5 μM doxorubicin) or in combination with H2O2 induced an increase in mitochondrial formation of reactive oxygen species (ROS), which was prevented by the pharmacological inhibition of MAOs in both NRVMs and AMVMs. The pharmacological approach was supported by the genetic ablation of MAO-A in NRVMs. In addition, doxorubicin-derived ROS caused lipid peroxidation and alterations in mitochondrial function (i.e., mitochondrial membrane potential, permeability transition, redox potential), mitochondrial morphology (i.e., mitochondrial distribution and perimeter), sarcomere organization, intracellular [Ca2+] homeostasis, and eventually cell death. All these dysfunctions were abolished by MAO inhibition. Of note, in vivo MAO inhibition prevented chamber dilation and cardiac dysfunction in doxorubicin-treated mice. Innovation and Conclusion: This study demonstrates that the severe oxidative stress induced by doxorubicin requires the involvement of MAOs, which modulate mitochondrial ROS generation. MAO inhibition provides evidence that mitochondrial ROS formation is causally linked to all disorders caused by doxorubicin in vitro and in vivo. Based upon these results, MAO inhibition represents a novel therapeutic approach for doxorubicin cardiomyopathy.

Keywords: cardiomyopathy; doxorubicin; mitochondria; monoamine oxidase; reactive oxygen species (ROS).


Conflict of interest statement

No competing financial interests exist.

Figures

FIG. 1.
FIG. 1.
Effects of doxorubicin and MAO inhibition on mitochondrial oxidative status. NRVMs have been treated with 0.5 μM doxorubicin for 24 h, in the presence or absence of 100 μM pargyline. AMVMs have been treated with 0.5 μM doxorubicin for 24 h, in the presence or absence of 200 μM pargyline. Cells have been further stimulated with increasing concentrations of H2O2 (i.e., 1–10–100 μM) for 10 min. (A) Mitochondrial H2O2 formation measured by Mito-HyPer in isolated NRVMs. *p < 0.001 versus Untreated, #p < 0.001 versus Doxo, $p < 0.001 versus Basal Untreated by one-way ANOVA with post hoc Tukey's multiple comparison test. (B) Mitochondrial H2O2 formation measured by Mito-HyPer in isolated NRVMs. Cells have been previously transfected with scramble or MAO-A siRNA. *p < 0.05 versus Scramble, #p < 0.01 versus Scramble+Doxo, çp < 0.01 versus Scramble, §p < 0.001 versus Scramble+Doxo, $p < 0.001 versus Scramble Basal by one-way ANOVA with post hoc Tukey's multiple comparison test. (C) Mitochondrial GSSG/GSH ratio measured by Mito-Grx1-roGFP in isolated NRVMs. *p < 0.01 versus Untreated, #p < 0.01 versus Doxo, çp < 0.001 versus Doxo, §p < 0.05 versus Untreated, £p < 0.05 versus Basal Untreated, $p < 0.001 versus Basal Untreated by one-way ANOVA with post hoc Tukey's multiple comparison test. (D) Mitochondrial ROS formation measured by MTR in AMVMs. *p < 0.05 versus Untreated, #p < 0.05 versus Doxo, §p < 0.05 versus Basal Doxo, çp < 0.01 versus Basal Untreated, $p < 0.001 versus Basal Untreated by one-way ANOVA with post hoc Tukey's multiple comparison test. Approximately 30 cells were analyzed per condition in each experiment, and all the experiments were performed at least three times using three different animal or cell preparations. Data are expressed as mean ± SEM. AMVM, adult mouse ventricular myocyte; GSSG/GSH, glutathione disulfide/glutathione; MAO, monoamine oxidase; MTR, MitoTracker Red; NRVM, neonatal rat ventricular myocyte; ROS, reactive oxygen species; SEM, standard error of the mean.
FIG. 2.
FIG. 2.
Effects of doxorubicin and MAO inhibition on mitochondrial function and lipid peroxidation. NRVMs have been treated with 0.5 μM doxorubicin for 24 h, in the presence or absence of 100 μM pargyline. (A) ΔΨm monitored by TMRM fluorescence in isolated NRVMs. TMRM fluorescence was normalized using 5 μM FCCP. *p < 0.001 versus Untreated, §p < 0.05 versus Untreated, #p < 0.001 versus Doxo by one-way ANOVA with post hoc Tukey's multiple comparison test. (B) ΔΨm monitored by TMRM fluorescence in isolated NRVMs. TMRM fluorescence was evaluated before and after 1 and 2 h of treatment with increasing concentrations of H2O2 (i.e., 10–100 μM). TMRM fluorescence was normalized using 5 μM FCCP. *p < 0.001 versus Basal, #p < 0.001 versus Untreated, §p < 0.001 versus Doxo by one-way ANOVA with post hoc Tukey's multiple comparison test. (C) PTP opening monitored by decrease of calcein fluorescence in isolated NRVMs. PTP opening was triggered by 5 μM calcimycin. Data were quantified after 180 and 300 s from the beginning of the experiment. *p < 0.001 versus Untreated, #p < 0.01 versus Doxo by one-way ANOVA with post hoc Tukey's multiple comparison test. (D) MDA formation in isolated NRVMs. Raw fluorescence values were normalized to milligram proteins, and then normalized versus Untreated. *p < 0.01 versus Untreated, #p < 0.05 versus Doxo by one-way ANOVA with post hoc Tukey's multiple comparison test. Approximately 30 cells were analyzed per condition in each experiment, and all the experiments were performed three times using three different animal preparations. MDA assay was performed three times using three different animal preparations. Data are expressed as mean ± SEM. ΔΨm, mitochondrial membrane potential; FCCP, carbonyl cyanide-p-trifluoromethoxyphenylhydrazone; MDA, malondialdehyde; PTP, permeability transition pore; TMRM, tetramethylrhodamine.
FIG. 3.
FIG. 3.
Effects of doxorubicin and MAO inhibition on mitochondrial morphology. (A) TEM of isolated NRVMs treated with 0.5 μM doxorubicin for 24 h, in the presence or absence of 100 μM pargyline. Cells have been further stimulated with 10 μM H2O2 for 1 h. (B) Probability histograms of mitochondrial perimeter, representing values count on the y axis and mitochondrial perimeter values on the x axis. The bar graph displays the average of the mitochondrial perimeter. *p < 0.001 versus Untreated, #p < 0.01 versus Doxo+H2O2 by one-way ANOVA with post hoc Tukey's multiple comparison test. Where data were not normally distributed, the Kruskal–Wallis test has been applied. All the experiments were performed three times using three different animal preparations. Untreated: N = 15 cells, 297 mitochondria. Doxo: N = 14 cells, 588 mitochondria. Doxo+H2O2: N = 11 cells, 463 mitochondria. Doxo+H2O2+pargyline: N = 15 cells, 536 mitochondria. Data are expressed as mean ± SEM. TEM, transmission electron microscopy.
FIG. 4.
FIG. 4.
Effects of doxorubicin and MAO inhibition on mitochondria and sarcomere alignment. NRVMs have been treated with 0.5 μM doxorubicin for 24 h, in the presence or absence of 100 μM pargyline. Cells have been further stimulated with 10 μM H2O2 for 1 h. (A) Mitochondrial morphology assessed by confocal microscopy in isolated NRVMs. Confocal images were processed for immunofluorescent labeling of TOM20 (red), while nuclei were stained with DAPI (blue). Both representative images (upper row) and regions of interests (lower row) are provided. (B) Probability histograms of mitochondrial distribution, representing values count on the y axis and R values on the x axis. (C) Sarcomere arrangement assessed by confocal microscopy in isolated NRVMs. Confocal images were processed for immunofluorescent labeling of α-sarcomeric actinin (green), while nuclei were stained with DAPI (blue). Both representative images (upper row) and regions of interests (lower row) are provided. (D) The fluorescence intensity of the α-sarcomeric actinin was plotted and reported on the graph to show the effect of the treatments on the distribution of the sarcomeres within the cell. Approximately 30 cells were analyzed per condition in each experiment, and all the experiments were performed at least three times using three different animal preparations.
FIG. 5.
FIG. 5.
Effects of doxorubicin and MAO inhibition on cytosolic [Ca2+] homeostasis. NRVMs have been treated with 0.5 μM doxorubicin for 24 h, in the presence or absence of 100 μM pargyline. Cytosolic [Ca2+] transients have been monitored by Fluo-4 AM. (A) Representative intracellular [Ca2+] transients, intracellular [Ca2+] peaks after stimulation with 10 mM caffeine, and intracellular [Ca2+] transients after cotreatment with 10 mM caffeine and 10 μM isoproterenol. (B) Transient amplitude and transient frequency average in spontaneous beating NRVMs. *p < 0.05 versus Untreated, #p < 0.01 versus Doxo by one-way ANOVA with post hoc Tukey's multiple comparison test. (C) Caffeine peak average and SR fractional release of Ca2+ in spontaneous beating NRVMs. *p < 0.05 versus Untreated, #p < 0.05 versus Doxo by one-way ANOVA with post hoc Tukey's multiple comparison test. (D) Transient amplitude and transient frequency average in the presence of isoproterenol, before and after caffeine stimulus. *p < 0.05 versus before caffeine, #p < 0.001 versus before caffeine by one-way ANOVA with post hoc Tukey's multiple comparison test. Approximately 30 cells were analyzed per condition in each experiment, and all the experiments were performed three times using three different animal preparations. Data are expressed as mean ± SEM. AM, acetoxymethyl; SR, sarcoplasmic reticulum.
FIG. 6.
FIG. 6.
Effects of doxorubicin and MAO inhibition on cardiomyocyte viability. NRVMs have been treated with 0.5 μM doxorubicin for 24 h, in the presence or absence of 100 μM pargyline. (A) Apoptosis evaluated by Annexin-V-Fluos staining in isolated NRVMs. Histogram displays the percentage of Annexin V-positive cells normalized to the total number of cells identified by bright-field images. *p < 0.01 versus Untreated, #p < 0.01 versus Doxo by the Kruskal–Wallis test. (B) Cell death measured by LDH release from isolated NRVMs. Cells have been further stimulated with 10 μM H2O2, and supernatants were collected at different time points. *p < 0.001 versus H2O2; #p < 0.001 versus H2O2; çp < 0.01 versus H2O2; §p < 0.001 versus Doxo+H2O2 by one-way ANOVA with post hoc Tukey's multiple comparison test. (C) Cell death measured by LDH release from isolated NRVMs. Cells have been further stimulated with 100 μM H2O2, and supernatants were collected at different time points. *p < 0.05 versus H2O2; #p < 0.001 versus H2O2; §p < 0.001 versus Doxo+H2O2; çp < 0.01 versus Doxo+H2O2 by one-way ANOVA with post hoc Tukey's multiple comparison test. For the evaluation of apoptosis, ∼100 cells were analyzed per condition in each experiment, and all the experiments were performed three times using three different animal preparations. For LDH release approximately three to four wells were analyzed per condition in each experiment. All the experiments were performed at least three times using three different animal preparations. Data are expressed as mean ± SEM. LDH, lactic dehydrogenase.
FIG. 7.
FIG. 7.
Changes in cardiac morphology and function in doxorubicin-treated mice. (A–C) Changes in cardiac morphology and (D–F) function in vehicle- (n = 5), doxorubicin- (n = 7), and doxorubicin and pargyline-treated mice (n = 5). *p < 0.05, #p < 0.01, çp < 0.001 versus Vehicle; §p < 0.01, $p < 0.001 versus Doxo by one-way ANOVA with post hoc Tukey's multiple comparison test. Where data were not normally distributed, the Kruskal–Wallis test has been applied. Data are expressed as mean ± SEM. EF, ejection fraction; FS, fractional shortening; LV mass/BW, left ventricle mass/body weight; LVEDD, left ventricular end-diastolic dimension; LVESD, left ventricular end-systolic dimension.

References

    1. Ali MK, Ewer MS, Gibbs HR, Swafford J, and Graff KL. Late doxorubicin-associated cardiotoxicity in children. The possible role of intercurrent viral infection. Cancer 74: 182–188, 1994 - PubMed
    1. Antonucci S, Mulvey JF, Burger N, Di Sante M, Hall AR, Hinchy EC, Caldwell ST, Gruszczyk AV, Deshwal S, Hartley RC, Kaludercic N, Murphy MP, Di Lisa F, and Krieg T. Selective mitochondrial superoxide generation in vivo is cardioprotective through hormesis. Free Radic Biol Med 134: 678–687, 2019 - PMC - PubMed
    1. Bassani JW, Bassani RA, and Bers DM. Twitch-dependent SR Ca accumulation and release in rabbit ventricular myocytes. Am J Physiol 265: C533–C540, 1993 - PubMed
    1. Belousov VV, Fradkov AF, Lukyanov KA, Staroverov DB, Shakhbazov KS, Terskikh AV, and Lukyanov S. Genetically encoded fluorescent indicator for intracellular hydrogen peroxide. Nat Methods 3: 281–286, 2006 - PubMed
    1. Benard G, Bellance N, James D, Parrone P, Fernandez H, Letellier T, and Rossignol R. Mitochondrial bioenergetics and structural network organization. J Cell Sci 120: 838–848, 2007 - PubMed

Publication types

LinkOut - more resources