. 2020 Nov;68(11):2377-2394.
doi: 10.1002/glia.23847. Epub 2020 Jun 11.

Biophysical basis for Kv1.3 regulation of membrane potential changes induced by P2X4-mediated calcium entry in microglia

Affiliations

Biophysical basis for Kv1.3 regulation of membrane potential changes induced by P2X4-mediated calcium entry in microglia

Hai M Nguyen et al. Glia. 2020 Nov.

Abstract

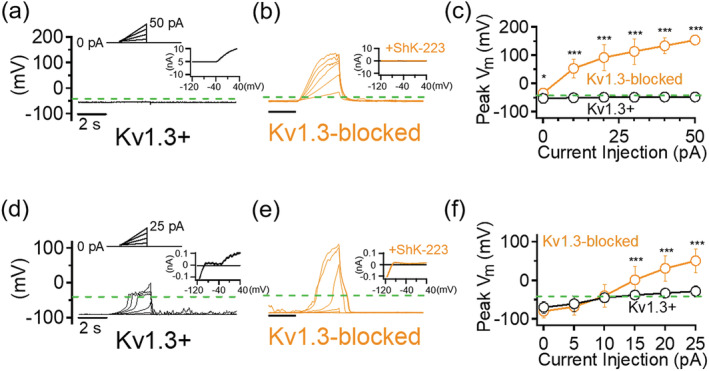
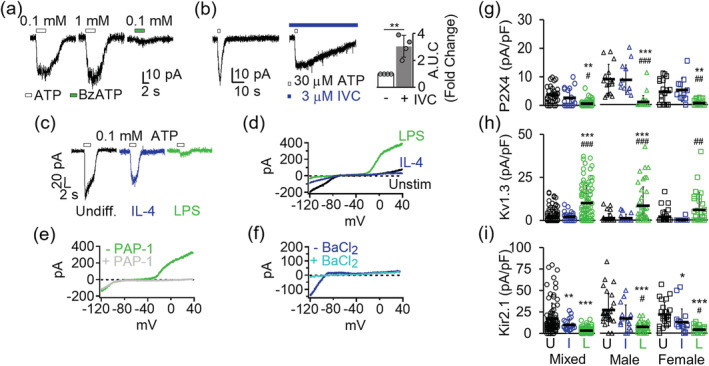
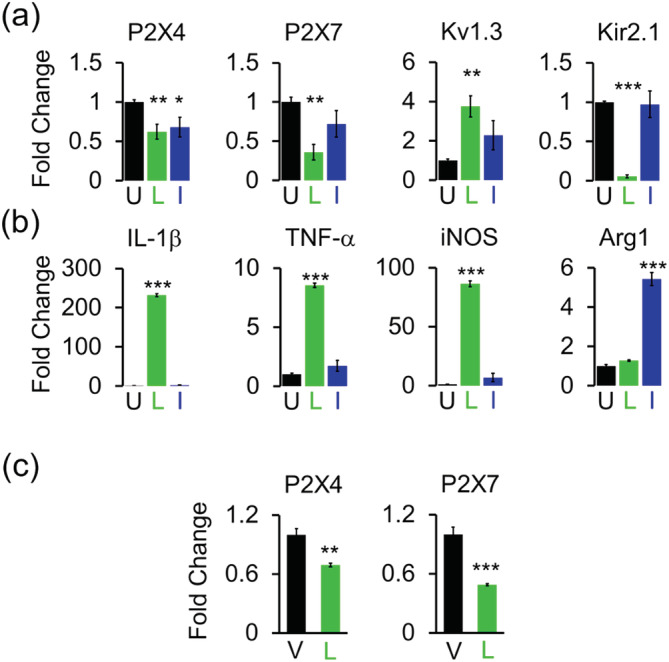
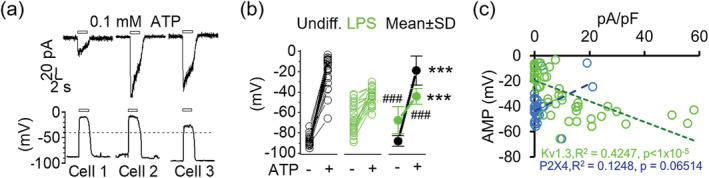
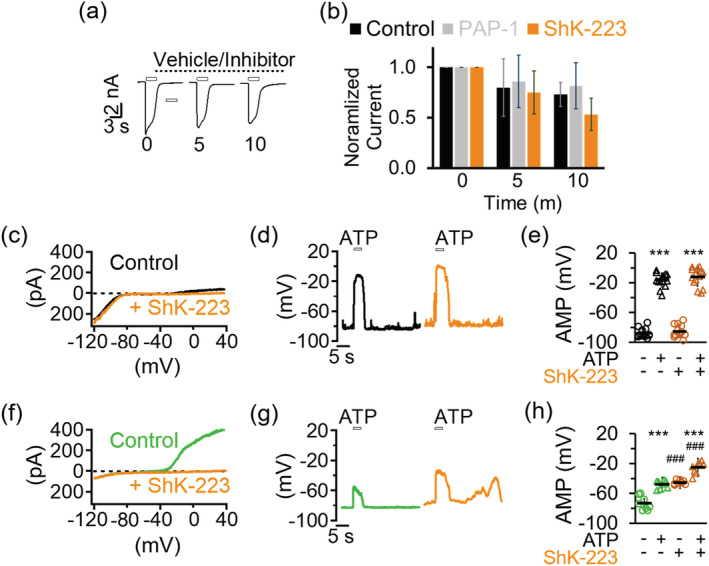
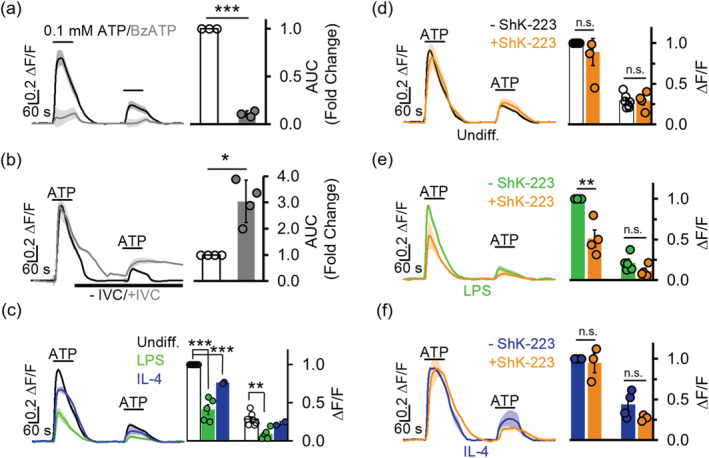
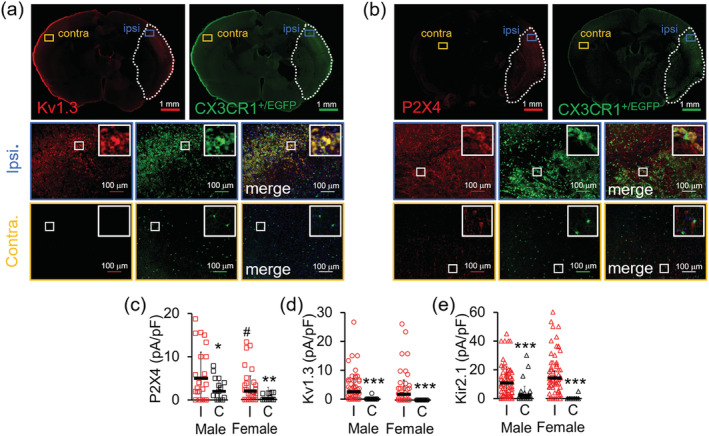
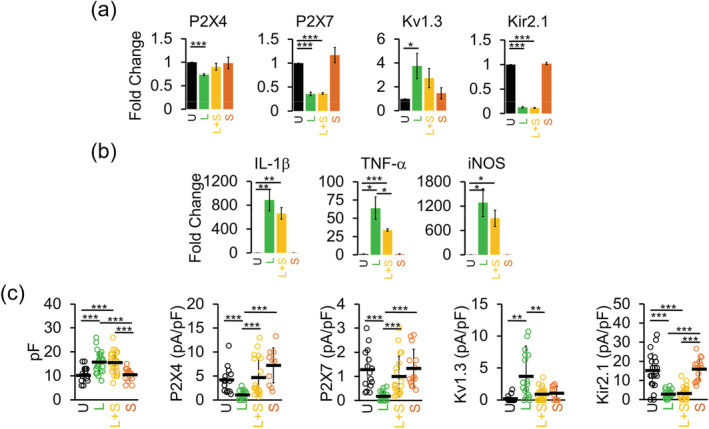
Microglia-mediated inflammation exerts adverse effects in ischemic stroke and in neurodegenerative disorders such as Alzheimer's disease (AD). Expression of the voltage-gated potassium channel Kv1.3 is required for microglia activation. Both genetic deletion and pharmacological inhibition of Kv1.3 are effective in reducing microglia activation and the associated inflammatory responses, as well as in improving neurological outcomes in animal models of AD and ischemic stroke. Here we sought to elucidate the molecular mechanisms underlying the therapeutic effects of Kv1.3 inhibition, which remain incompletely understood. Using a combination of whole-cell voltage-clamp electrophysiology and quantitative PCR (qPCR), we first characterized a stimulus-dependent differential expression pattern for Kv1.3 and P2X4, a major ATP-gated cationic channel, both in vitro and in vivo. We then demonstrated by whole-cell current-clamp experiments that Kv1.3 channels contribute not only to setting the resting membrane potential but also play an important role in counteracting excessive membrane potential changes evoked by depolarizing current injections. Similarly, the presence of Kv1.3 channels renders microglia more resistant to depolarization produced by ATP-mediated P2X4 receptor activation. Inhibiting Kv1.3 channels with ShK-223 completely nullified the ability of Kv1.3 to normalize membrane potential changes, resulting in excessive depolarization and reduced calcium transients through P2X4 receptors. Our report thus links Kv1.3 function to P2X4 receptor-mediated signaling as one of the underlying mechanisms by which Kv1.3 blockade reduces microglia-mediated inflammation. While we could confirm previously reported differences between males and females in microglial P2X4 expression, microglial Kv1.3 expression exhibited no gender differences in vitro or in vivo. MAIN POINTS: The voltage-gated K+ channel Kv1.3 regulates microglial membrane potential. Inhibition of Kv1.3 depolarizes microglia and reduces calcium entry mediated by P2X4 receptors by dissipating the electrochemical driving force for calcium.

Keywords: Kir2.1; Kv1.3; P2X4; P2X7; PAP-1; ShK-223; intracellular Ca2+; membrane potential; microglia; potassium channels; purinergic receptor.


Figures

FIGURE 1
FIGURE 1
Kv1.3 prevents extreme membrane depolarization triggered by current injections. Sample current‐clamp traces of a Kv1.3+ Chinese Hamster Ovary (CHO) cell before (a) and after (b) 100 nM ShK‐223 (n = 8). (Top) Current injection protocol consisted of 3‐s ramps from 0 to 50 pA in 10 pA steps. Insets: Voltage‐clamp traces of same cell elicited by a voltage ramp from −120 to +40 mV. (c) Quantification of maximal membrane depolarization measured. Sample current‐clamp traces of Kv1.3+ microglia before (d) and after (e) 100 nM ShK‐223 (n = 11). (Top) Current injection protocol consisted of 3‐s ramps from 0 to 25 pA in 5 pA steps. Insets: Voltage‐clamp traces of same cell. (f) Quantification of maximal membrane depolarization measured. Dashed green lines indicate the −40‐mV membrane potential level near the Kv1.3 activation threshold potential. Error bars indicate mean ± SD. Statistical significance determined by paired t test. *p < 0.05, **p < 0.005, and ***p < 0.0005 [Color figure can be viewed at wileyonlinelibrary.com]
FIGURE 2
FIGURE 2
Channel expression changes in differentially activated microglia. (a) Purinergic currents from three representative undifferentiated microglia evoked by a 3‐s pulse of either ATP or BzATP while voltage clamped at −70 mV. (b) Potentiation of ATP‐induced currents by the P2X4‐selective positive modulator ivermectin (left). Quantification of area under the curve (AUC) showed a 3.04 ± 0.80‐fold increase in potentiation (n = 4) currents induced by 0.03 mM ATP by in the presence of ivermectin (right). Statistical significance (**p < 0.01) determined by paired t test. (c) Differential P2X4 current expression in undifferentiated, interleukin‐4 (IL‐4), and lipopolysaccharides (LPS)‐differentiated microglia. (d) Overlay of representative K+ currents in undifferentiated, IL‐4‐ and LPS‐differentiated microglia. (e) Inhibition of delayed rectifying outward K+ current in LPS‐differentiated microglia by 100 nM PAP‐1, a Kv1.3‐selective small molecule blocker. (f) Inhibition of Kir2.1 inward rectifying current by 100 μM BaCl2. Scatterplots of (g) P2X4, (h) Kv1.3, and (i) Kir2.1 current density from undifferentiated (U), IL‐4 (I), and LPS‐differentiated (L) cells. Data collected from at least three independently prepared, mixed‐gender, male‐only, and female‐only microglia cultures. Error bars indicate mean ± SD. Statistical significance determined by one‐way analysis of variance (ANOVA) followed by Tukey–Cramer's post hoc test (alpha = .p < 0.05, **p < 0.01, and ***p < 0.001 versus undifferentiated microglia. # p < 0.05, ## p < 0.01, ### p < 0.001 versus IL‐4 differentiated microglia. See Table 1 for details [Color figure can be viewed at wileyonlinelibrary.com]
FIGURE 3
FIGURE 3
Gene expression changes in differentially activated microglia. Quantitative PCR (qPCR) quantification of mRNA expression of (a) channels and (b) microglia‐associated cytokines and markers in undifferentiated (U), lipopolysaccharides (LPS) (L), and interleukin‐4 (IL‐4) (I) differentiated microglia. Data from three independent mixed‐gender microglia cultures. (c) Quantification of mRNA in acutely isolated CD11b+ microglia from mice receiving intracerebroventricular (ICV)‐PBS vehicle (V; n = 4) and ICV‐LPS (L; n = 4). Bar graphs represent means ± SEM. Statistical analysis was performed using unpaired t test. *p < 0.05, **p < 0.01, and ***p < 0.001 versus undifferentiated or vehicle‐injected microglia [Color figure can be viewed at wileyonlinelibrary.com]
FIGURE 4 1
FIGURE 4 1
Influence of Kv1.3 expression on membrane potential changes. (a) Corresponding voltage‐clamp (top) and current‐clamp (bottom) traces induced by 0.1 mM ATP from three individual microglia. (b) Scatterplots for resting membrane potential (RMP) and ATP‐induced membrane potential (AMP). RMP's measured in undifferentiated cells and lipopolysaccharides (LPS)‐differentiated cells averaged −88.08 ± 5.14 mV (n = 27) and −67.64 ± 12.62 mV (n = 28), respectively. AMP's in undifferentiated cells and LPS‐differentiated cells averaged −19.32 ± 14.49 mV and −44.09 ± 7.67 mV, respectively. Data represented by means ± SD. Statistical significance between before and after ATP addition determined by paired t test and between undifferentiated and lipopolysaccharides (LPS)‐differentiated microglia determined by one‐way analysis of variance (ANOVA) followed by post hoc Tukey–Cramer's test. ***p < 0.001 denotes significance versus before ATP, ### p < 0.001 denotes significance versus undifferentiated cells. See Table 2 for detailed measurements. (c) Pearson correlation between AMP and current density for P2X4 (blue) and Kv1.3 (green). Correlation coefficient, r, calculated from a total of 52 control undifferentiated and 20 LPS‐treated cells. Statistical significance is set at p < 0.05 [Color figure can be viewed at wileyonlinelibrary.com]
FIGURE 5
FIGURE 5
Kv1.3 blockade depolarizes microglia and disrupts resistance to ATP‐induced membrane depolarization. (a) Kv1.3 inhibitors do not cross‐react with P2X4. Sample recording of P2X4 currents elicited by 0.1 mM ATP in a Chinese Hamster Ovary (CHO) cell at the 0, 5, and 10‐min time points displaying characteristic time‐dependent current rundown. (b) Bar graphs showing normalized current for control cells (n = 5), PAP‐1 (1 μM) treated cells (n = 4), and ShK‐223 (100 nM) treated cells (n = 5). Inhibitors were added immediately after the first ATP pulse and remained in the recording chamber throughout the duration between and during subsequent ATP pulses. Error bars denote means ± SD. (c) Voltage‐clamp currents before and after inhibition of Kv1.3 with 100 nM ShK‐223 in an undifferentiated microglial cell. (g) Current‐clamp displaying ATP‐induced depolarization (AID) of resting membrane potential (RMP) before and after ShK‐223 in the same undifferentiated cell. (e) Scatterplots summarizing RMP and AMP levels before and after ShK‐223 for undifferentiated cells (n = 14). (f) Voltage‐clamp currents before and after inhibition of Kv1.3 with 100 nM ShK‐223 in an lipopolysaccharides (LPS)‐stimulated microglial cell. (g) Current‐clamp displaying AID of RMP before and after ShK‐223 in the same LPS‐stimulated cell. (h) Scatterplots summarizing RMP and AMP levels for LPS‐treated cells (n = 8). Statistical significance determined by paired t test. ***p < 0.001 annotates significance versus before ATP. ### p < 0.001 annotates significance versus before inhibition by ShK‐223. See Table 3 for details [Color figure can be viewed at wileyonlinelibrary.com]
FIGURE 6
FIGURE 6
Kv1.3 channel inhibition reduces intracellular Ca2+ signaling. (a) Fluo‐4 AM calcium indicator fluorescence signal elicited by 0.1 mM ATP is 2.65 ± 0.99‐fold (n = 3) higher in total area under the curve (AUC) compared to that elicited by 0.1 mM BzATP (n = 3). Statistical significance determined by unpaired t test comparing ATP and BzATP cells. (b) Ivermectin (IVC, 3 μM) increases fluorescence signaling elicited by 0.1 mM ATP by 2.65 ± 0.99‐fold (n = 4). Statistical significance between before and after ivermectin determined by paired t test. (c) Twenty‐four hours treatment with lipopolysaccharides (LPS) (300 ng/ml) or interleukin‐4 (IL‐4) (20 ng/ml) suppresses fluorescence increase. Statistical significance determined by one‐way analysis of variance (ANOVA) followed by Tukey–Cramer's post hoc test (alpha = 0.05). (d–f) Preincubation with the Kv1.3 blocker ShK‐223 (100 nM) reduces ATP‐mediated fluorescence increases in LPS‐treated microglia but not in undifferentiated or IL‐4 stimulated microglia. All ATP applied at 0.1 mM and after baseline fluorescence was recorded for 2 min. Changes in [Ca2+]i are represented as ΔF/F (change in fluorescence measured as AUC after baseline subtraction). Scale bars indicate 20% of the maximal normalized change in ΔF/F, which is 1ΔF/F. Statistical significance determined by paired t test. All data presented as mean ± SEM. Measurements from three to seven separate experiments (coverslips from different cultures on different days) and 50–100 cells each were measured per experiment for panels (c)–(f). *p < 0.05, **p < 0.01, ***p < 0.001 [Color figure can be viewed at wileyonlinelibrary.com]
FIGURE 7
FIGURE 7
Expression changes of Kv1.3 channels and P2X4 receptors in in microglia isolated from Cx3CR1+/EGFP transgenic mice 8 days after middle cerebral artery occlusion (MCAO) as a model of ischemic stroke. Sample immunofluorescence staining of 14‐μM thick coronal brain sections from the 6‐mm depth showing (a) increased Kv1.3 (red) and (b) P2X4 (red) immunoreactivity in ipsilateral Cx3CR1+/EGFP (green) cells but not contralateral cells. Each channel was analyzed on n = 3–4 coronal sections from N = 3 male and 3 female mice. (c) P2X4 (d) Kv1.3 and (e) Kir2.1 current densities measured from CD11b+ Cx3CR1+/EGFP microglia acutely isolated from the ipsilateral hemisphere (8 days after MCAO) compared to microglia isolated from the contralateral side. Statistical significance determined by one‐way analysis of variance (ANOVA) followed by Tukey–Cramer's post hoc (alpha = 0.05). *p < 0.05, **p < 0.01, and ***p < 0.001 versus ipsilateral microglia. # p < 0.05 versus male microglia. See Table 4 for details [Color figure can be viewed at wileyonlinelibrary.com]
FIGURE 8
FIGURE 8
Effects of Kv1.3 channel inhibition on mRNA expression of microglial channels and pro‐inflammatory cytokines. Quantitative PCR (qPCR) quantification of mRNA expression of (a) channels and (b) microglia‐associated cytokines in undifferentiated (U), lipopolysaccharides (LPS) only (L; 300 ng/ml), LPS + 100 nM ShK‐223 (L + S) and 100 nM ShK‐223 only (S) treated microglia. Data from three independent mixed‐gender postnatal microglia cultures. Bar graphs represent means ± SEM. Statistical analysis was performed using unpaired t test. *p <0.05, **p <0.01, and ***p <0.001 versus undifferentiated microglia. (c) Scatterplots of cell capacitance, P2X4, P2X7, Kv1.3, and Kir2.1 current density undifferentiated (U; n = 30), LPS only (L; 300 ng/ml; n = 16), LPS + 100 nM ShK‐223 (L + S; n = 30), and 100 nM ShK‐223 only (S; n = 24) treated microglia. Data collected from at least three independently prepared, mixed‐gender cultures and error bars indicate mean ± SD. Statistical significance determined by one‐way analysis of variance (ANOVA) followed by Tukey–Cramer's post hoc test (alpha = 0.05). *p < 0.05, **p <0.01, and ***p < 0.001 [Color figure can be viewed at wileyonlinelibrary.com]

References

    1. Beeton, C. , Wulff, H. , Standifer, N. E. , Azam, P. , Mullen, K. M. , Pennington, M. W. , … Chandy, K. G. (2006). Kv1.3 channels are a therapeutic target for T cell‐mediated autoimmune diseases. Proceedings of the National Academy of Sciences of the United States of America, 103(46), 17414–17419. - PMC - PubMed
    1. Boucsein, C. , Zacharias, R. , Farber, K. , Pavlovic, S. , Hanisch, U. K. , & Kettenmann, H. (2003). Purinergic receptors on microglial cells: Functional expression in acute brain slices and modulation of microglial activation in vitro. The European Journal of Neuroscience, 17(11), 2267–2276. 10.1046/j.1460-9568.2003.02663.x - DOI - PubMed
    1. Cahalan, M. D. , & Chandy, K. G. (2009). The functional network of ion channels in T lymphocytes. Immunological Reviews, 231(1), 59–87. 10.1111/j.1600-065X.2009.00816.x - DOI - PMC - PubMed
    1. Cavaliere, F. , Florenzano, F. , Amadio, S. , Fusco, F. R. , Viscomi, M. T. , D'Ambrosi, N. , … Volonte, C. (2003). Up‐regulation of P2X2, P2X4 receptor and ischemic cell death: Prevention by P2 antagonists. Neuroscience, 120(1), 85–98. 10.1016/s0306-4522(03)00228-8 - DOI - PubMed
    1. Chakravarty, S. , & Herkenham, M. (2005). Toll‐like receptor 4 on nonhematopoietic cells sustains CNS inflammation during endotoxemia, independent of systemic cytokines. The Journal of Neuroscience, 25(7), 1788–1796. 10.1523/JNEUROSCI.4268-04.2005 - DOI - PMC - PubMed

Publication types