

FBXL4 deficiency increases mitochondrial removal by autophagy
- PMID: 32525278
- PMCID: PMC7338799
- DOI: 10.15252/emmm.201911659
FBXL4 deficiency increases mitochondrial removal by autophagy
Abstract
Pathogenic variants in FBXL4 cause a severe encephalopathic syndrome associated with mtDNA depletion and deficient oxidative phosphorylation. To gain further insight into the enigmatic pathophysiology caused by FBXL4 deficiency, we generated homozygous Fbxl4 knockout mice and found that they display a predominant perinatal lethality. Surprisingly, the few surviving animals are apparently normal until the age of 8-12 months when they gradually develop signs of mitochondrial dysfunction and weight loss. One-year-old Fbxl4 knockouts show a global reduction in a variety of mitochondrial proteins and mtDNA depletion, whereas lysosomal proteins are upregulated. Fibroblasts from patients with FBXL4 deficiency and human FBXL4 knockout cells also have reduced steady-state levels of mitochondrial proteins that can be attributed to increased mitochondrial turnover. Inhibition of lysosomal function in these cells reverses the mitochondrial phenotype, whereas proteasomal inhibition has no effect. Taken together, the results we present here show that FBXL4 prevents mitochondrial removal via autophagy and that loss of FBXL4 leads to decreased mitochondrial content and mitochondrial disease.
Keywords: FBXL4; autophagy; mitochondrial disease; mtDNA; oxidative phosphorylation.
© 2020 The Authors. Published under the terms of the CC BY 4.0 license.
Conflict of interest statement
The authors declare that they have no conflict of interest.
Figures
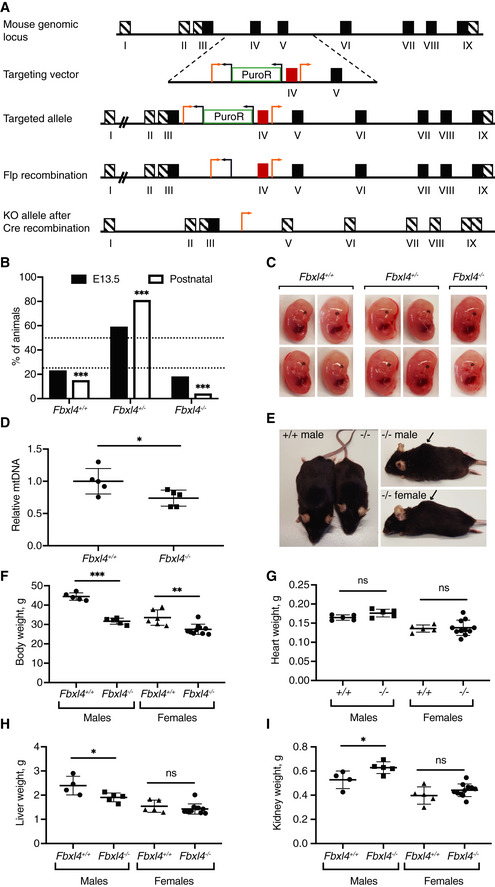
- A
Strategy to generate Fbxl4 knockout mice. Exon IV was targeted by loxP sites (orange arrows) and removed after Cre recombination. Black arrows indicate Frt sites.
- B
Genotype distribution in litters from heterozygous matings (Fbxl4 +/− × Fbxl4 +/−) at embryonic stage 13.5 (E13.5) and of live animals at weaning. Data are presented as a percentage. Embryos n = 79, weaned mice n = 339. Dashed lines indicate the expected Mendelian ratios. Chi‐square test versus expected Mendelian ratios; ***P < 0.001.
- C
Representative images of wild‐type (+/+), heterozygous knockout (+/−), and homozygous Fbxl4 knockout embryos (−/−) at E13.5.
- D
Relative levels of mtDNA of Fbxl4 knockout (−/−) embryos and the corresponding wild‐type (+/+) embryos at E13.5. Data represent mean ± SEM, n = 5. Student's t‐test; *P < 0.05.
- E
Representative images of male Fbxl4 knockout (−/−) and matched wild‐type (+/+) animals at 1 year of age (left). A hunch‐back phenotype was observed both in male and in female knockout animals (right, indicated by arrow).
- F–I
Whole body (F), heart (G), liver (H), and kidney (I) weights of 1‐year‐old animals. Data represent mean ± SEM, n ≥ 5 animals. Student's t‐test; *P < 0.05; **P < 0.01; ***P < 0.001; n.s., not significant (P ≥ 0.05).
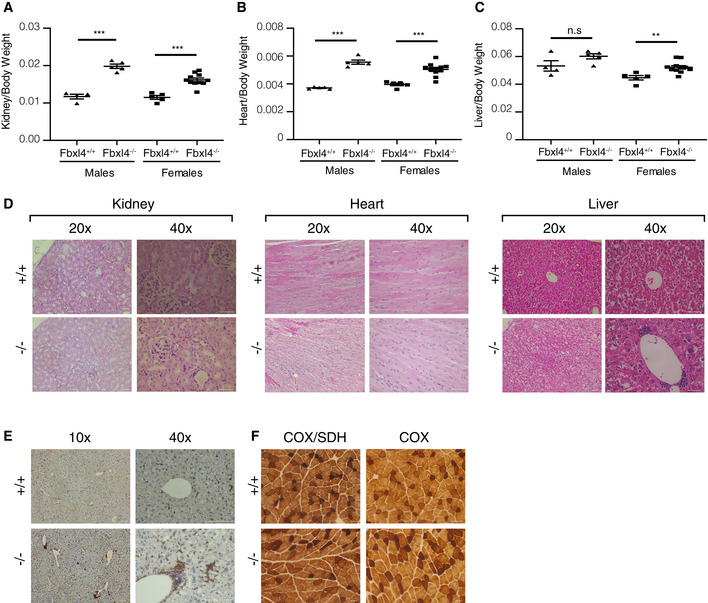
- A–C
Organ‐to‐body weight ratios for kidney (A), heart (B), and liver (C) of 1‐year‐old animals. Data are presented as mean ± SEM. Student's t‐test; n.s, P > 0.05; **P < 0.01; ***P < 0.001.
- D
Representative images of H&E staining of kidney, heart, and liver tissue sections of Fbxl4+/+ and Fbxl4−/− 1‐year‐old animals. Scale bar 50 μm.
- E
Representative images of Iba1 staining in liver tissue sections of Fbxl4+/+ and Fbxl4−/− 1‐year‐old animals. Scale bar 100 μm.
- F
The individual COX and sequential COX/SDH reactions within quadriceps sections of Fbxl4+/+ and Fbxl4−/− 1‐year‐old animals. Scale bar 50 μm.
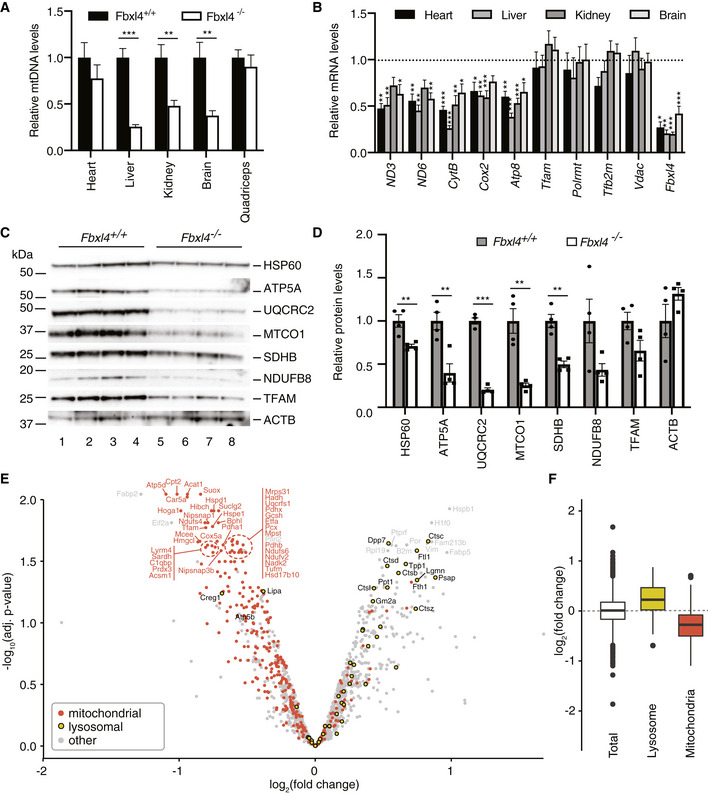
Relative levels of mtDNA in tissues of 1‐year‐old Fbxl4 knockout mice determined by quantitative real‐time PCR (normalized to controls). Data are presented as mean ± SEM, n = 6 for controls and n = 8 for knockout animals. Student's t‐test; **P < 0.01; ***P < 0.001.
Transcript levels in indicated tissues of 1‐year‐old Fbxl4 knockout mice determined by quantitative real‐time PCR. Relative mRNA levels in control animals were set as 1 (dashed line). Data are presented as mean ± SEM, n = 6 for controls and n = 8 for knockout animals. Student's t‐test; *P < 0.05; **P < 0.01; ***P < 0.001.
Western blot analysis of protein steady‐state levels in liver protein extracts from wild‐type (Fbxl4 +/+) and Fbxl4 knockout (Fbxl4 −/−) animals.
Quantification of the Western blot in (C). Signal normalized to the average of controls and presented as mean ± SEM, n = 4 for both controls and knockout animals. Student's t‐test; **P < 0.01; ***P < 0.001.
Quantitative TMT‐based proteomic analysis of wild‐type and Fbxl4 knockout liver tissue protein extracts. Proteins from three control and three Fbxl4 knockout liver protein extracts were TMT‐labeled, quantified, and analyzed separately as described in Materials and Methods; the data from control and knockout animals were averaged after the analysis and presented as −log10 of the adjusted P‐value versus log2 fold change (logFC). Mitochondrial proteins were selected according to mouse MitoCarta 2.0 (Calvo et al, 2016) and highlighted in red; lysosomal proteins were selected according to hLGDB database (Brozzi et al, 2013) and highlighted in yellow.
Enrichment analysis of lysosomal and mitochondrial proteins according to the logFC median of each group of proteins. Data are presented as 25–75 percentile box with the indicated median, and whiskers representing the ± 1.5× inter‐quartile range. Proteins included in each group: total = 1,523, lysosome = 50, mitochondria = 324.
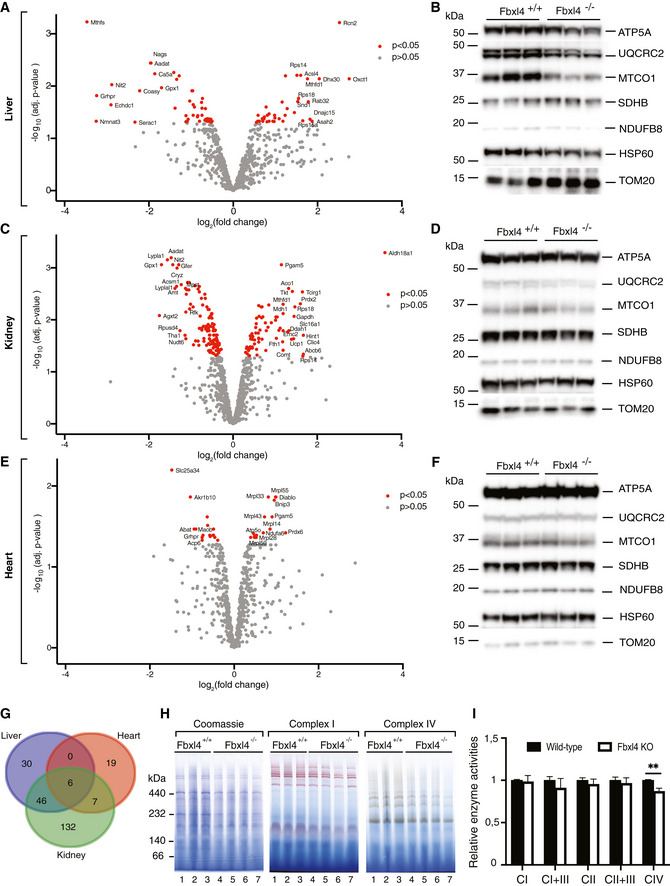
Label‐free proteomic analysis of isolated liver mitochondria in wild‐type versus Fbxl4 knockout animals. Data are represented as log10 of the P‐value on y‐axis against log2 of knockout‐to‐control ratio (log2 fold change, logFC) on the x‐axis.
Western blot analysis of protein steady‐state levels in isolated liver mitochondria from wild‐type (Fbxl4 +/+) and Fbxl4 knockout (Fbxl4 −/−) animals.
Label‐free proteomic analysis of isolated kidney mitochondria in wild‐type versus Fbxl4 knockout animals. Data are represented as log10 of the P‐value on y‐axis against log2 of knockout‐to‐control ratio (log2 fold change, logFC) on the x‐axis.
Western blot analysis of protein steady‐state levels in isolated kidney mitochondria from wild‐type (Fbxl4 +/+) and Fbxl4 knockout (Fbxl4 −/−) animals.
Label‐free proteomic analysis of isolated heart mitochondria in wild‐type versus Fbxl4 knockout animals. Data are represented as log10 of the P‐value on y‐axis against log2 of knockout‐to‐control ratio (log2 fold change, logFC) on the x‐axis.
Western blot analysis of protein steady‐state levels in isolated heart mitochondria from wild‐type (Fbxl4 +/+) and Fbxl4 knockout (Fbxl4 −/−) animals.
Venn diagram comparing the three mitoproteomic datasets generated by using an online tool accessible at
http://bioinformatics.psb.ugent.be/webtools/Venn/ .Blue native PAGE (BN–PAGE) analysis of respiratory chain complexes in wild‐type (Fbxl4 +/+) and knockout (Fbxl4 −/−) animals.
Relative respiratory chain enzymatic activities from liver mitochondria. Data are presented as mean ± SEM, n = 5. Student's t‐test; **P < 0.01.
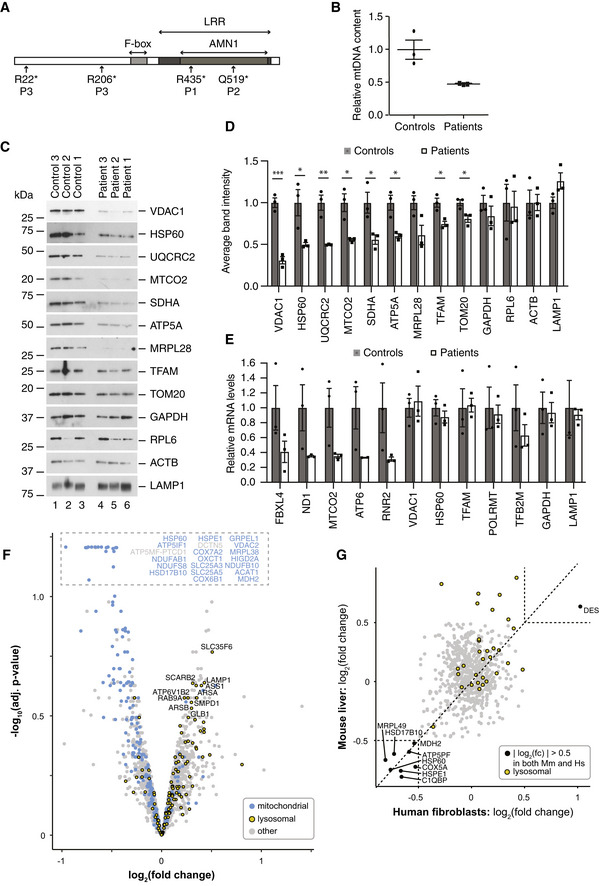
Schematic representation of the human FBXL4 protein with amino acid positions of mutations found in patients (P1, P2, and P3). Relative positions of the F‐box, leucine‐rich repeat (LRR), and antagonist of mitotic exit network protein 1 (AMN1) domains are shown.
Relative mtDNA content in fibroblasts from patients and controls as determined by qRT–PCR using an ND6 probe and normalized to nuclear genomic DNA content using an 18S probe. Individual values are presented for each sample, as well as their mean ± SEM values.
Steady‐state protein levels in three control and three FBXL4 patient‐derived fibroblasts analyzed by Western blotting.
Quantification of the Western blot in (C). Signals from the control and FBXL4‐mutated cells were considered as biological replicates, normalized to the average of controls, and displayed as mean ± SEM (n = 3 for each). Student's t‐test; *P < 0.05; **P < 0.01; ***P < 0.001.
Quantification of nuclear and mitochondrial transcript levels in control and patient fibroblasts. The results from control and patient cells were averaged, normalized to controls, and displayed as mean ± SEM (n = 3 biological replicates for each condition).
Quantitative TMT‐based proteomic analysis of control and patient fibroblasts. Proteins from three control and three patient fibroblast cell lines were TMT‐labeled, quantified, and analyzed separately as described in Materials and Methods; the data from control and patients were averaged after the analysis and presented as −log10 of the adjusted P‐value versus log2 fold change (logFC). Mitochondrial proteins were selected according to human MitoCarta 2.0 (Calvo et al, 2016) and highlighted in blue; lysosomal proteins were selected according to hLGDB database (Brozzi et al, 2013) and highlighted in yellow.
Log2FC correlation analysis of mouse liver proteomic dataset and fibroblast proteomic dataset. Proteins with a log2FC > 0.5 are highlighted in black, and lysosomal proteins are highlighted in yellow.
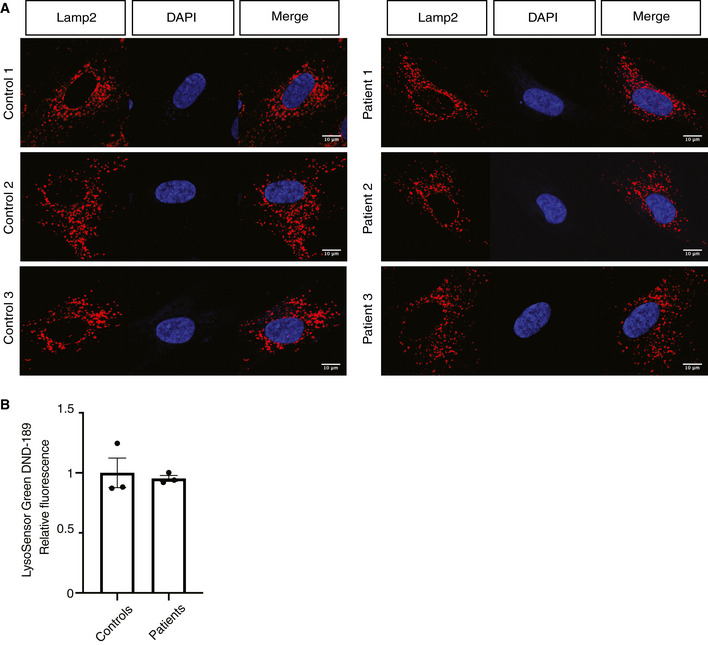
Lamp2 immunofluorescence of control and patient fibroblasts. Scale bar, 10 μm.
LysoSensor Green DND‐189 fluorescence measurement. Data are presented as relative fluorescence value and represent mean ± SEM, n = 3.
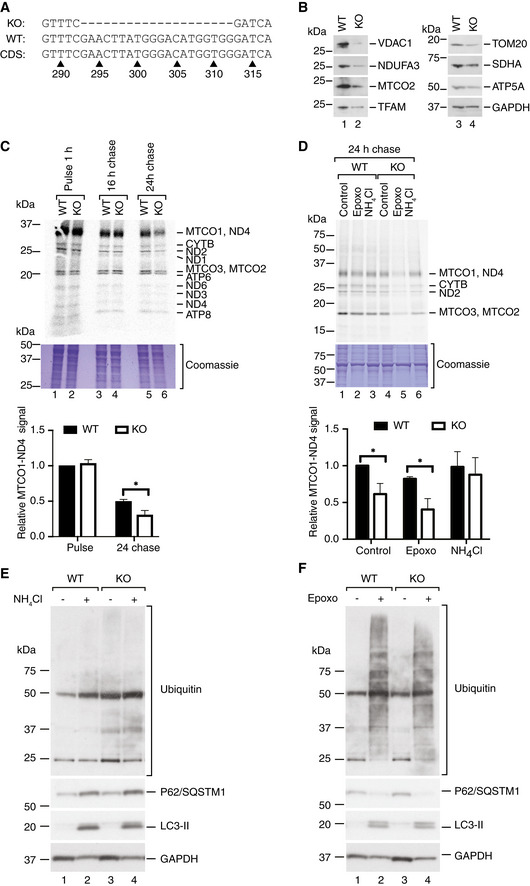
- A
Genomic DNA sequence from FBXL4 knockout (KO) and wild‐type (WT) RKO cells was compared to the NCBI reference FBXL4 coding sequence (CDS) NM_001278716.2 and showed a frameshift‐causing deletion in the knockout cells.
- B
Steady‐state protein levels in wild‐type (WT) and FBXL4 knockout (KO) RKO cells.
- C
(Upper panel) Pulse‐chase labeling of mitochondrial translation products in wild‐type (WT) and FBXL4 knockout (KO) cells. The cells were incubated for 1 h with a 35S methionine–cysteine labeling mix in the presence of anisomycin to inhibit cytosolic translation (pulse). After removal of the medium, the cells were incubated in complete growth medium without inhibitors and labeled amino acids for 16 or 24 h (chase). A representative experiment of four biological replicates is shown. A Coomassie‐stained part of the gel is shown as loading control. (Lower panel) Quantification of the MTCO1‐ND4 signal presented as mean ± SEM; n = 4 biological replicates; Student's t‐test; *P < 0.05.
- D
(Upper panel) Mitochondrial translation products were labeled in wild‐type (WT) and FBXL4 knockout (KO) RKO cells for 60 min as in (C), followed by 24‐h chase in the presence of 5 μM epoxomicin (epoxo) or 20 mM ammonium chloride (NH4Cl). A representative experiment of n ≥ 3 biological replicates is shown. A fragment of the Coomassie‐stained gel is shown as loading control. (Lower panel) Quantification of the ND4‐MTCO1 signal. n ≥ 3 biological replicates; data are presented as mean ± SEM. Student's t‐test; *P < 0.05.
- E, F
Steady‐state levels of indicated proteins in wild‐type and FBXL4 knockout RKO cells treated with NH4Cl (E), or epoxomicin (Epoxo, F).
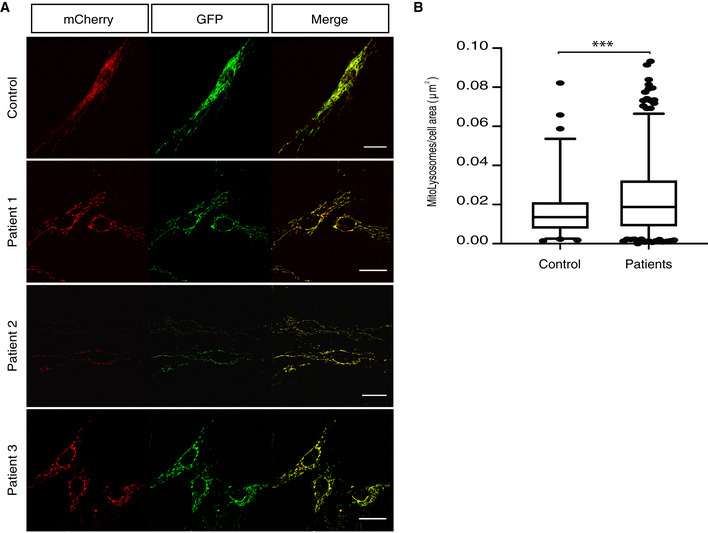
Confocal images from the mito‐QC‐expressing fibroblast lines. Scale bar 25 μm.
Quantification of the mitolysosomes/cell area (μm2) using the mito‐QC counter plugin for ImageJ (Montava‐Garriga et al, 2020). At least three technical replicates for each line and n > 15 cells analyzed for each technical replicate. Data are presented as 25–75 percentile box with the indicated median and whiskers representing 5–95 percentile interval. Non‐parametric Mann–Whitney test; ***P < 0.001.
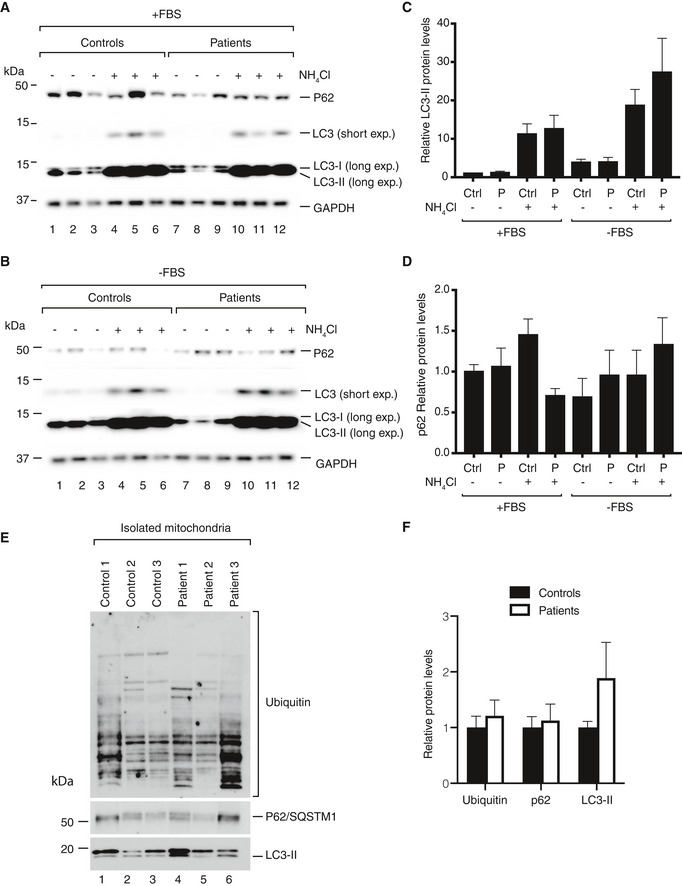
- A, B
Steady‐state protein levels in control and patient fibroblasts. Cells were grown in DMEM with 10% FBS (A) or in DMEM without FBS (B) for 3 h. After that, the cells were treated for 3 h with NH4Cl to block autophagy, collected, and analyzed by Western blotting.
- C, D
Densitometric quantification of LC3‐II (C) and p62 (D) normalized by GAPDH signal. Data are shown as mean ± SEM, n = 4.
- E
Western blot analysis of ubiquitin, p62, and LC3 accumulation in sucrose‐purified mitochondria.
- F
Densitometric quantification ubiquitin, p62, and LC3‐II. Signals from the control and FBXL4‐mutated cells were considered as biological replicates, normalized to the average of controls, and displayed as mean ± SEM (n = 3 for each).
References
Publication types
MeSH terms
Substances
Grants and funding
- UK NIHR Biomedical Research Centre for Ageing and Age-related disease award to the Newcastle upon Tune Foundation Hospitals NHS Trust/International
- MRC/EPSRC Molecular Pathology Node/International
- Knut och Alice Wallenbergs Stiftelse (Knut and Alice Wallenberg Foundation)/International
- 203105/Z/16/Z/Wellcome Centre for Mitochondrial Research/International
- WT_/Wellcome Trust/United Kingdom
- G0800674/Mitochondrial Disease Patient Cohort (UK)/International
- UK NHS Highly Specialised Service for Rare Mitochondrial Disorders of Adults and Children/International
- VR2016-02179/Svenska Forskningsrådet Formas (Swedish Research Council Formas)/International
- UK Research and Innovation | Medical Research Council (MRC)/International
- 741366/ERC_/European Research Council/International
- Lily Foundation/International
- SLL2018.0471/Sveriges Regering (Government of Sweden)/International
- International Centre for Genomic Medicine in Neuromuscular Disease/International
- 2018.602/Cancerfonden (Swedish Cancer Society)/International
- 2016-741366/EC | H2020 | H2020 Priority Excellent Science | H2020 European Research Council (ERC)/International
- 2015-00418/Svenska Forskningsrådet Formas (Swedish Research Council Formas)/International
LinkOut - more resources
Full Text Sources
Medical
Molecular Biology Databases
