

Association of Neighborhood-Level Disadvantage With Alzheimer Disease Neuropathology
- PMID: 32525547
- PMCID: PMC7290421
- DOI: 10.1001/jamanetworkopen.2020.7559
Association of Neighborhood-Level Disadvantage With Alzheimer Disease Neuropathology
Abstract
Importance: Social determinants of health, such as income, education, housing quality, and employment, are associated with disparities in Alzheimer disease and health generally, yet these determinants are rarely incorporated within neuropathology research.
Objective: To establish the feasibility of linking neuropathology data to social determinants of health exposures using neighborhood disadvantage metrics (the validated Area Deprivation Index) and to evaluate the association between neighborhood disadvantage and Alzheimer disease-related neuropathology.
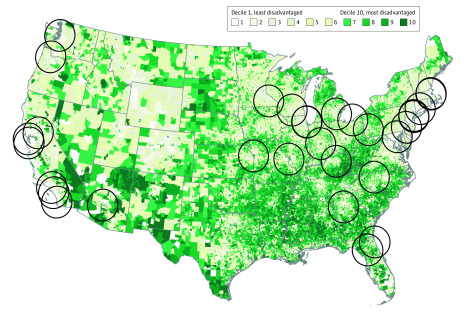
Design, setting, and participants: This cross-sectional study consisted of decedents with a known home address who donated their brains to 1 of 2 Alzheimer disease research center brain banks in California and Wisconsin between January 1, 1990, and December 31, 2016. Neither site had preexisting social metrics available for their decedents. Neuropathologic features were obtained from each site for data collected using the standardized Neuropathology Data Set form and from autopsy reports. Data were analyzed from June 7 to October 10, 2019.
Exposures: Geocoded decedent addresses linked to neighborhood disadvantage as measured by the Area Deprivation Index calculated for the year of death.
Main outcomes and measures: Presence of Alzheimer disease neuropathology. The association between neighborhood disadvantage and Alzheimer disease neuropathology was evaluated via logistic regression, adjusting for age, sex, and year of death.
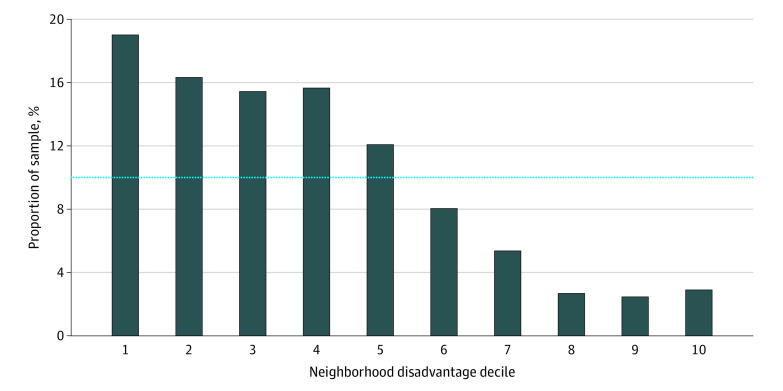
Results: The sample consisted of 447 decedents (249 men [56%]; mean [SD] age, 80.3 [9.5] years; median year of death, 2011) spanning 24 years of donation. Fewer decedents (n = 24 [5.4%]) originated from the top 20% most disadvantaged neighborhood contexts. Increasing neighborhood disadvantage was associated with an 8.1% increase in the odds of Alzheimer disease neuropathology for every decile change on the Area Deprivation Index (adjusted odds ratio, 1.08; 95% CI, 1.07-1.09). As such, living in the most disadvantaged neighborhood decile was associated with a 2.18 increased odds of Alzheimer disease neuropathology (adjusted odds ratio, 2.18; 95% CI, 1.99-2.39).
Conclusions and relevance: The findings of this cross-sectional study suggest that social determinants of health data can be linked to preexisting autopsy samples as a means to study sociobiological mechanisms involved in neuropathology. This novel technique has the potential to be applied to any brain bank within the United States. To our knowledge, this is the first time Alzheimer disease neuropathology has been associated with neighborhood disadvantage.
Conflict of interest statement
Figures
References
-
- Office of Disease Prevention and Health Promotion Healthy People 2020: Social Determinants of Health. Updated May 7, 2020. Accessed September 30, 2019. https://www.healthypeople.gov/2020/topics-objectives/topic/social-determ...
Publication types
MeSH terms
Grants and funding
LinkOut - more resources
Full Text Sources
Medical
Research Materials
