

Temperature, Humidity, and Latitude Analysis to Estimate Potential Spread and Seasonality of Coronavirus Disease 2019 (COVID-19)
- PMID: 32525550
- PMCID: PMC7290414
- DOI: 10.1001/jamanetworkopen.2020.11834
Temperature, Humidity, and Latitude Analysis to Estimate Potential Spread and Seasonality of Coronavirus Disease 2019 (COVID-19)
Abstract
Importance: Coronavirus disease 2019 (COVID-19) infection has resulted in a global crisis. Investigating the potential association of climate and seasonality with the spread of this infection could aid in preventive and surveillance strategies.
Objective: To examine the association of climate with the spread of COVID-19 infection.
Design, setting, and participants: This cohort study examined climate data from 50 cities worldwide with and without substantial community spread of COVID-19. Eight cities with substantial spread of COVID-19 (Wuhan, China; Tokyo, Japan; Daegu, South Korea; Qom, Iran; Milan, Italy; Paris, France; Seattle, US; and Madrid, Spain) were compared with 42 cities that have not been affected or did not have substantial community spread. Data were collected from January to March 10, 2020.
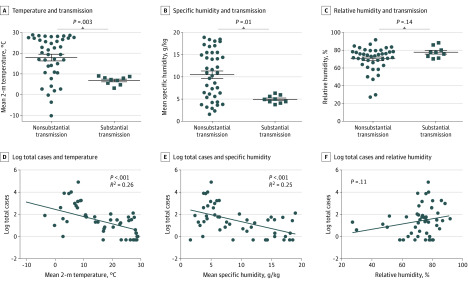
Main outcomes and measures: Substantial community transmission was defined as at least 10 reported deaths in a country as of March 10, 2020. Climate data (latitude, mean 2-m temperature, mean specific humidity, and mean relative humidity) were obtained from ERA-5 reanalysis.
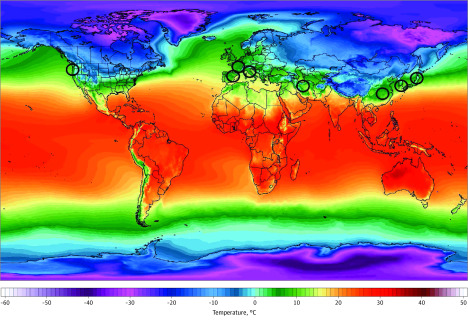
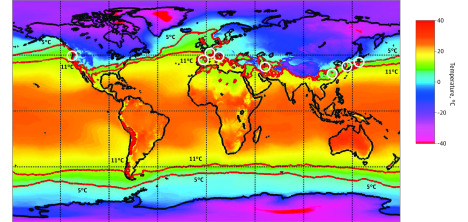
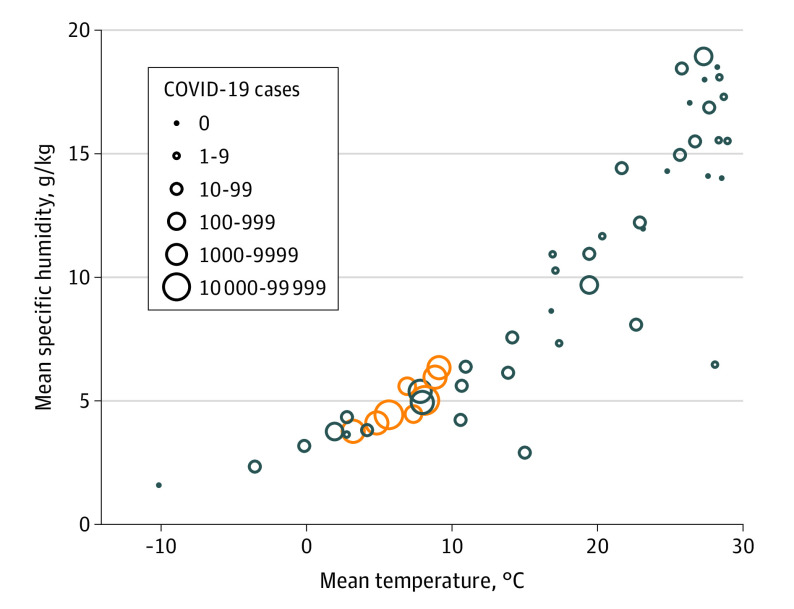
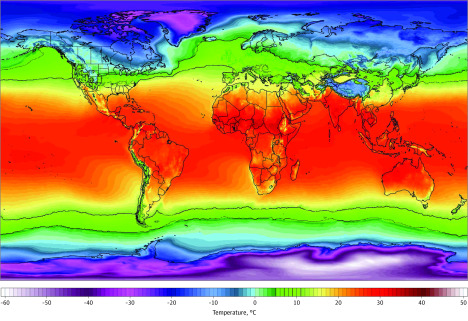
Results: The 8 cities with substantial community spread as of March 10, 2020, were located on a narrow band, roughly on the 30° N to 50° N corridor. They had consistently similar weather patterns, consisting of mean temperatures of between 5 and 11 °C, combined with low specific humidity (3-6 g/kg) and low absolute humidity (4-7 g/m3). There was a lack of substantial community establishment in expected locations based on proximity. For example, while Wuhan, China (30.8° N) had 3136 deaths and 80 757 cases, Moscow, Russia (56.0° N), had 0 deaths and 10 cases and Hanoi, Vietnam (21.2° N), had 0 deaths and 31 cases.
Conclusions and relevance: In this study, the distribution of substantial community outbreaks of COVID-19 along restricted latitude, temperature, and humidity measurements was consistent with the behavior of a seasonal respiratory virus. Using weather modeling, it may be possible to estimate the regions most likely to be at a higher risk of substantial community spread of COVID-19 in the upcoming weeks, allowing for concentration of public health efforts on surveillance and containment.
Conflict of interest statement
Figures
Update of
-
Temperature, humidity, and latitude analysis to predict potential spread and seasonality for COVID-19.SSRN [Preprint]. 2020 Mar 9:3550308. doi: 10.2139/ssrn.3550308. SSRN. 2020. Update in: JAMA Netw Open. 2020 Jun 1;3(6):e2011834. doi: 10.1001/jamanetworkopen.2020.11834. PMID: 32714105 Free PMC article. Updated. Preprint.
References
-
- Collaborators GBDI; GBD 2017 Influenza Collaborators . Mortality, morbidity, and hospitalisations due to influenza lower respiratory tract infections, 2017: an analysis for the Global Burden of Disease Study 2017. Lancet Respir Med. 2019;7(1):69-89. doi: 10.1016/S2213-2600(18)30496-X - DOI - PMC - PubMed
-
- Li Y, Reeves RM, Wang X, et al. ; RSV Global Epidemiology Network; RESCEU investigators . Global patterns in monthly activity of influenza virus, respiratory syncytial virus, parainfluenza virus, and metapneumovirus: a systematic analysis. Lancet Glob Health. 2019;7(8):e1031-e1045. doi: 10.1016/S2214-109X(19)30264-5 - DOI - PubMed
