CCR5 deficiency impairs CD4+ T-cell memory responses and antigenic sensitivity through increased ceramide synthesis
- PMID: 32525588
- PMCID: PMC7396835
- DOI: 10.15252/embj.2020104749
CCR5 deficiency impairs CD4+ T-cell memory responses and antigenic sensitivity through increased ceramide synthesis
Abstract
CCR5 is not only a coreceptor for HIV-1 infection in CD4+ T cells, but also contributes to their functional fitness. Here, we show that by limiting transcription of specific ceramide synthases, CCR5 signaling reduces ceramide levels and thereby increases T-cell antigen receptor (TCR) nanoclustering in antigen-experienced mouse and human CD4+ T cells. This activity is CCR5-specific and independent of CCR5 co-stimulatory activity. CCR5-deficient mice showed reduced production of high-affinity class-switched antibodies, but only after antigen rechallenge, which implies an impaired memory CD4+ T-cell response. This study identifies a CCR5 function in the generation of CD4+ T-cell memory responses and establishes an antigen-independent mechanism that regulates TCR nanoclustering by altering specific lipid species.
Keywords: T-cell receptor; ccr5[delta]32; humoral response; membrane phase; sphingolipid.
© 2020 The Authors. Published under the terms of the CC BY 4.0 license.
Conflict of interest statement
The authors declare that they have no conflict of interest.
Figures

- A
Representative plots of splenocytes from CD45.1 mice adoptively transferred with CD45.2 OT‐II WT or CCR5−/− lymph node cell suspensions, 5 weeks after infection with rVACV‐OVA virus. The gating strategy used to identify the memory CD4+ T‐cell subtypes is shown (n = 5).
- B
Absolute number of OT‐II cells recovered in spleens of mice as in A (n = 5).
- C, D
Percentage of CD4+ TEM (C) and TCM (D) in the OT‐II WT and CCR5−/− populations (n = 5).
- E
IFNγ‐producing OT‐II WT and CCR5−/− memory cells isolated from mice as in (A) and restimulated ex vivo with OVA323–339 (1 μM) (n = 4).
- F
Immunization scheme for NIP‐OVA and NIP‐KLH in WT and CCR5−/− mice.
- G–I
Representative plots (G) and quantification of the frequency (H) and absolute number (I) of Tfh cells (CD4+CD44+PD‐1+CXCR5+) in the spleen after primary immunization (day 7) with NIP‐OVA (n = 7).
- J, K
ELISA analysis of high‐ (J) and low‐affinity (K) isotype‐specific anti‐NIP antibodies in sera from OVA/OVA‐ and OVA/KLH‐immunized mice (day 15 post‐challenge; n = 5 mice/group). Data representative of one experiment of two.

- A, B
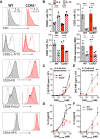
Representative histograms and quantification of mean fluorescence intensity (MFI; A) or the percentage of cells positive for the indicated memory markers (B) in OT‐II WT and CCR5−/− lymphoblasts expanded in IL‐2 or IL‐15, as specified. Data shown as mean ± SEM (n ≥ 3). The gating strategy is shown in Fig EV1.
- C–F
IL‐2‐ (C, D) and IL‐15‐expanded lymphoblasts (E, F) were restimulated with indicated concentrations of OVA323–339; cell proliferation (thymidine incorporation into DNA; C, E) and IL‐2 production (by ELISA; D, F) were measured after 72 h. Data are presented as mean ± SEM (n = 5).
- A–C
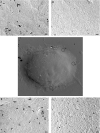
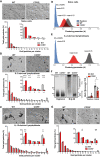
Analysis of TCR nanoclustering by EM in OT‐II WT and CCR5−/− naïve cells (A; n = 6 cells/genotype; WT: 3,427, CCR5−/−: 3,528 particles), and IL‐2‐ (B; WT, n = 8 cells, 15,419 particles; CCR5−/−, n = 6 cells, 5,410 particles) or IL‐15‐expanded lymphoblasts (C; WT, n = 8 cells, 27,518 particles; CCR5−/−, n = 7 cells, 22,696 particles). A representative small field image at the top of each panel shows gold particle distribution in the cell surface replicas of anti‐CD3ε‐labeled cells; at bottom, quantification (mean ± SEM) of gold particles in clusters of indicated size in WT (gray bars) and CCR5−/− cells (red). Insets show the distribution of clusters of one, two, three, four, or more than four particles, and statistical analysis.
- D, E
Posterior distribution in naïve (D) and IL‐2‐expanded lymphoblasts (E) of the clustering parameter b for WT (gray) and CCR5−/− cells (red); randomly generated distributions of receptors are shown in blue. The mean value of the b parameter is indicated for each condition. The probability of a chance distribution similar to that determined in cells is nearly 0% by the ROPE.
- F
Comparison of TCR oligomer size using BN‐PAGE and anti‐CD3ζ immunoblotting in day 10, IL‐2‐expanded WT and CCR5−/− OT‐II lymphoblasts lysed in buffer containing digitonin or Brij‐96. The marker protein is ferritin (f1, 440 and f2, 880 kDa forms). The ratio of TCR nanoclusters to monomeric TCR in each lysis condition was quantified by densitometry (right; n = 5).
- G
Top, representative small field EM images showing gold particle distribution in the cell surface replicas of CD4+ T cells isolated from OVA/OVA‐immunized WT and CCR5−/− mice. Bottom, quantification (mean ± SEM) of gold particles in clusters of the indicated size (WT, gray bars; n = 5 cells, 14,680 particles; CCR5−/−, red; n = 7 cells, 15,374 particles). Insets show the distribution between clusters of one, two, three, four, or more than four particles, and statistical analysis.

OT‐II WT cells were activated with OVA323–339, alone or with TAK‐779. After 3 days, antigen and TAK‐779 were removed and lymphoblasts expanded in IL‐2‐containing medium. TCR nanoclustering was analyzed in anti‐CD3ε‐labeled surface replicas of day 10 lymphoblasts. Top, representative small field EM images showing gold particle distribution in the cell surface replicas of WT CD4+ T cells alone or with TAK‐779. Bottom, quantification of gold particles in clusters of the indicated size. Inset, distribution of gold particles between clusters of one, two, three, four, or more than four particles in vehicle‐ (gray bars; n = 5 cells, 11,266 particles) and TAK‐779‐treated cells (black; n = 6 cells, 5,138 particles).
OT‐II WT cells were activated with OVA323–339, and TAK‐779 was added at days 3, 5, and 7 after antigen removal. Analysis as above, untreated (gray bars; n = 5 cells, 6,400 particles) and TAK‐779‐treated cells (black; n = 6 cells, 7,153 particles). Inset shows the distribution between clusters of one, two, three, four, or more than four particles, and statistical analysis.
OT‐II WT naïve cells were activated with antigen in the presence or not of the CXCR4 inhibitor AMD3100. Left, representative EM images showing gold particle distribution in the cell surface replicas. Right, analysis of gold particles in clusters as above, vehicle‐ (gray bars; n = 6 cells, 12,339 particles) and AMD3100‐treated cells (black; n = 7 cells, 17,059 particles). Inset shows the distribution between clusters of one, two, three, four, or more than four particles, and statistical analysis.
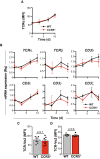
Quantification of mean fluorescence intensity of TCRα (Vα2) surface staining in IL‐2‐expanded, OVA323–339‐activated WT and CCR5−/− OT‐II cells on the days indicated.
Relative mRNA levels for the indicated TCR chains in cells as above.
Mean fluorescence intensity of TCRα (Vα2) surface staining in IL‐15‐expanded, OVA323–339‐activated WT and CCR5−/− OT‐II cells.
Mean fluorescence intensity of TCRα (Vα2) surface staining in CD45.2+/CD4+ memory cells isolated from NIP‐OVA‐immunized WT and CCR5−/− mice.
- A
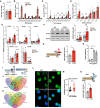
Total Chol levels in WT and CCR5−/− OT‐II lymphoblasts (day 10, IL‐2‐expanded) as determined by a fluorometric assay (n = 6).
- B–D
SM (B), Cer (C) and dhCer (D) levels in WT and CCR5−/− OT‐II 10‐day lymphoblasts, as determined by UPLC‐TOF MS. Values, after normalization with C17 standards and cell number in each sample, are the mean of two independent experiments (n = 6).
- E
RT–qPCR determination of CerS mRNA levels in naïve and IL‐2‐expanded WT and CCR5‐/− OT‐II 10‐day lymphoblasts (n = 3–5).
- F
Representative immunoblot showing CerS2 protein levels in naïve and WT and CCR5−/− OT‐II 10‐day lymphoblasts, and densitometric quantification of blots as above (n = 10).
- G
ChIP analysis of the CerS2 promoter using an anti‐H3K9Ac antibody. Scheme of the CerS2 promoter showing CpG islands and primers used for amplification. Relative ChIP of the CerS2 promoter in WT and CCR5−/− OT‐II 10‐day lymphoblasts (n = 3).
- H
Relative CerS2 mRNA level in CD4 T cells treated with PTx (n = 3).
- I
Scheme of a canonical CerS gene to illustrate the in silico strategy used to search for CerS‐specific transcription factors.
- J, K
Venn diagrams showing the number of transcription factors with putative binding sites in the indicated CerS genes in regions 1 (J) and 2 (K). The red circle highlights the transcription factors shared by CerS2, CerS3, and CerS4 promoters, but not present in the CerS6 promoter.
- L
Representative immunofluorescence images showing pSer142‐GATA‐1 staining (green) of OT‐II WT and CCR5−/− lymphoblasts. The green channel (top) and the merge with nuclear DAPI staining (blue; bottom) are shown. Scale bar, 10 μm.
- M
Quantification of nuclear staining of the cells plotted as integrated density fluorescence intensity in DAPI‐stained area (n ≥ 50 cells/condition).
- N
Top, basic scheme of the CerS2 promoter, indicating the putative GATA‐1 binding site (blue) and location of the primers used for amplification in ChIP assays (black arrows). Bottom, relative anti‐GATA‐1 ChIP levels in OT‐II WT and CCR5−/− lymphoblasts (n = 5).


Scheme of the strategy used to form TCR proteoliposomes, and size of LUV generated at the indicated lipid molar ratio. Polydispersity index values are shown as black squares for each condition (n = 3). SBP, streptavidin‐binding‐peptide‐tagged TCR.
Representative immunoblots comparing TCR nanocluster sizes via BN‐PAGE and anti‐CD3ζ immunoblotting in TCR proteoliposomes lysed in the presence of Brij‐96 or digitonin. The marker protein is ferritin (f1, 440 and f2, 880 kDa forms).
The ratio of the nanocluster and monomeric TCR in each lysis condition was quantified by densitometry from immunoblots as in (B) (n ≥ 4).
Cer levels in OT‐II 10‐day lymphoblasts, untreated or treated with SMase (n = 4).
Representative small field images showing gold particle distribution, and quantification (mean ± SEM) of gold particles in clusters of the indicated size in cell surface replicas from untreated (gray bars; n = 5 cells, 8,126 particles) and SMase‐treated (1 h) OT‐II lymphoblasts (cyan; n = 6 cells, 8,457 particles) after CD3ε labeling, as determined by EM. The inset shows distribution between clusters of one, two, three, four, or more than four particles.
GFP expression in shCtrl‐ (black) and shCerS2 (orange)‐transduced 2B4 cells after puromycin selection, as determined by FACS. Non‐transfected 2B4 cells (gray).
Relative CerS2 mRNA levels in TAK‐779‐treated 2B4 cells as in (F). Values were normalized to those obtained in untransduced TAK‐779‐treated 2B4 cells (n = 3).
Representative immunoblot with anti‐CerS2 antibody to determine CerS2 protein levels in shCtrl and ShCerS2‐transduced 2B4 cells as in (G). Filters were rehybridized with β‐actin as loading control.
TCR nanoclustering of shCtrl‐ and shCerS2‐transduced 2B4 cells in the presence of TAK‐779 as determined by EM. Representative small field images and quantification (mean ± SEM) of gold particles in clusters of indicated sizes in cell surface replicas shCtrl (black bars; n = 6 cells, 12,337 particles) and shCerS2 2B4 lymphoblasts (orange; n = 7 cells, 13,456 particles). Inset, distribution between clusters of indicated size and statistical analysis.
Percentage of CD69+ shCtrl (black) and shCerS2 (orange) 2B4 cells restimulated with plate‐bound anti‐CD3ε antibody in the presence of TAK‐779 (n = 3).

Analysis of TCR nanoclustering in lymphoblasts from healthy WT and ccr5Δ32 homozygous donors by EM. Top, representative small field image showing gold particle distribution in cell surface replicas of anti‐CD3ε‐labeled cells; bottom, quantification (mean ± SEM) of gold particles in clusters of the indicated size in the WT (gray bars; n = 5 cells, 17,689 particles) and Δ32/Δ32 cells (light red; n = 4 cells, 16,938 particles). Insets show the distribution between clusters of one, two, three, four, or more than four particles, and statistical analysis.
Normalized SM, Cer, and dhCer levels in lymphoblasts obtained as in (A). A representative experiment is shown (n = 3 donors/genotype; n = 2 independent experiments).
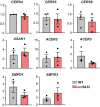
Relative CerS2 mRNA levels in day 8 WT and ccr5Δ32 lymphoblasts. Each data point is the average of a technical triplicate from three donors in two independent experiments (n = 6).
Comment in
-
CCR5 deficiency/CCR5Δ32: resistant to HIV infection at the cost of curtailed CD4+ T cell memory responses.EMBO J. 2020 Aug 3;39(15):e105854. doi: 10.15252/embj.2020105854. Epub 2020 Jul 8. EMBO J. 2020. PMID: 32639040 Free PMC article.
References
-
- Alonso A, Goñi FM (2018) The physical properties of ceramides in membranes. Annu Rev Biophys 47: 633–654 - PubMed
-
- Beck‐Garcia K, Beck‐Garcia E, Bohler S, Zorzin C, Sezgin E, Levental I, Alarcon B, Schamel WW (2015) Nanoclusters of the resting T cell antigen receptor (TCR) localize to non‐raft domains. Biochim Biophys Acta 1853: 802–809 - PubMed
-
- Blanpain C, Libert F, Vassart G, Parmentier M (2002) CCR5 and HIV infection. Receptors Channels 8: 19–31 - PubMed
-
- Camargo JF, Quiñones MP, Mummidi S, Srinivas S, Gaitan AA, Begum K, Jimenez F, VanCompernolle S, Unutmaz D, Ahuja SS et al (2009) CCR5 expression levels influence NFAT translocation, IL‐2 production, and subsequent signaling events during T lymphocyte activation. J Immunol 182: 171–182 - PMC - PubMed
Publication types
MeSH terms
Substances
Grants and funding
- SAF2017-83732-R/Ministerio de Ciencia, Innovación y Universidades (Ministry of Science, Innovation and Universities)
- FIS2016-78883-C2-2-P/Ministerio de Ciencia, Innovación y Universidades (Ministry of Science, Innovation and Universities)
- CTQ2017-85378-R/Ministerio de Ciencia, Innovación y Universidades (Ministry of Science, Innovation and Universities)
- PI13/02434/MEC | Instituto de Salud Carlos III (ISCIII)
- PI16/01861/MEC | Instituto de Salud Carlos III (ISCIII)
- B2017/BMD-3733/Comunidad de Madrid (Madrid Autonomous Community)
- Merck Salud Foundation
- BIOSS-EXC294/Deutsche Forschungsgemeinschaft (DFG)
- CIBSS-EXC 2189/Deutsche Forschungsgemeinschaft (DFG)
- SFB1381/Deutsche Forschungsgemeinschaft (DFG)
- SCHA976/7-1/Deutsche Forschungsgemeinschaft (DFG)
- "la Caixa" Foundation ("la Caixa")
LinkOut - more resources
Full Text Sources
Molecular Biology Databases
Research Materials

