. 2020 Jun 11;15(6):e0233589.
doi: 10.1371/journal.pone.0233589. eCollection 2020.

Self-regulated critical brain dynamics originate from high frequency-band activity in the MEG

Affiliations

Self-regulated critical brain dynamics originate from high frequency-band activity in the MEG

Stefan Dürschmid et al. PLoS One. .

Abstract

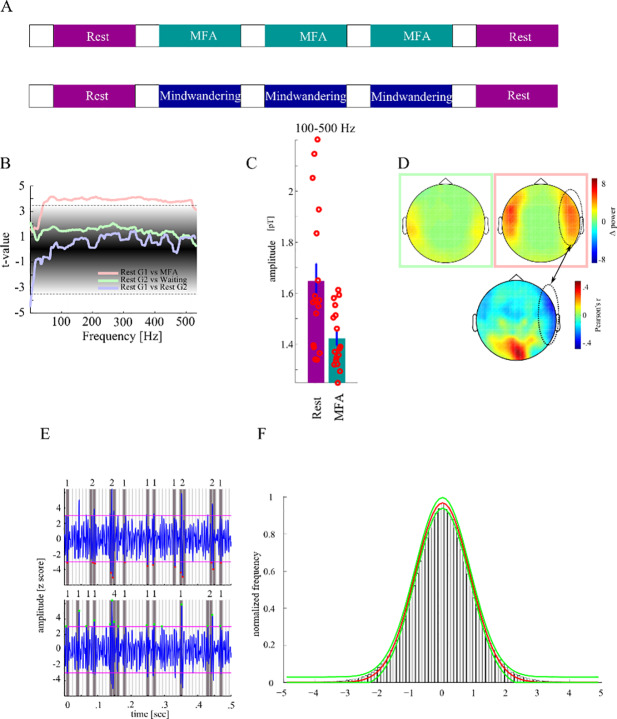
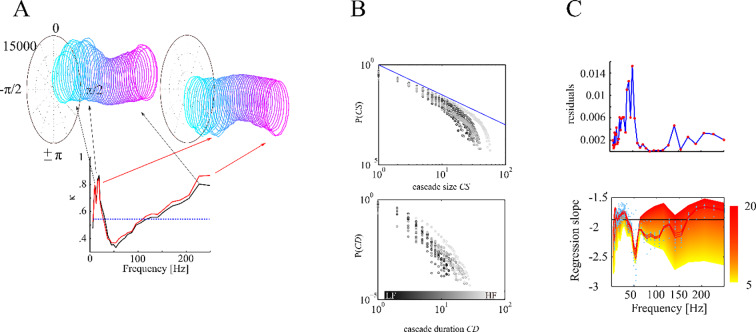
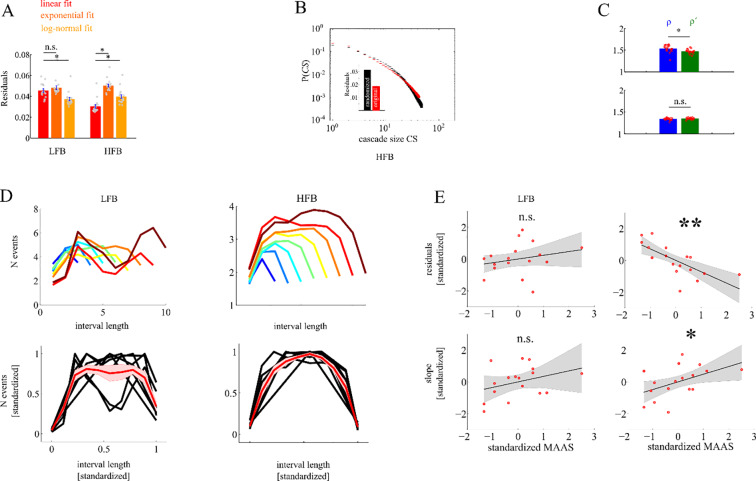
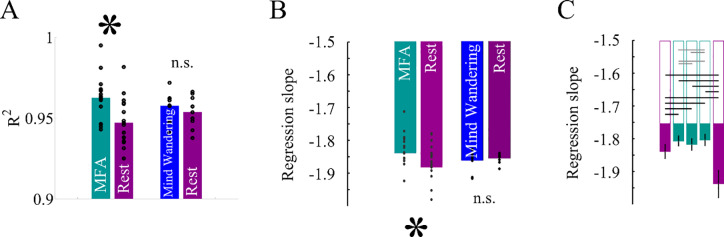
Brain function requires the flexible coordination of billions of neurons across multiple scales. This could be achieved by scale-free, critical dynamics balanced at the edge of order and disorder. Criticality has been demonstrated in several, often reduced neurophysiological model systems. In the intact human brain criticality has yet been only verified for the resting state. A more direct link between the concept of criticality and oscillatory brain physiology, which is strongly related to cognition, is yet missing. In the present study we therefore carried out a frequency-specific analysis of criticality in the MEG, recorded while subjects were in a defined cognitive state through mindfulness meditation. In a two-step approach we assessed whether the macroscopic neural avalanche dynamics is scale-free by evaluating the goodness of a power-law fits of cascade size and duration distributions of MEG deflections in different frequency bands. In a second step we determined the closeness of the power-law exponents to a critical value of -1.5. Power-law fitting was evaluated by permutation testing, fitting of alternative distributions, and cascade shape analysis. Criticality was verified by defined relationships of exponents of cascade size and duration distributions. Behavioral relevance of criticality was tested by correlation of indices of criticality with individual scores of the Mindful Attention Awareness Scale. We found that relevant scale-free near-critical dynamics originated only from broad-band high-frequency (> 100 Hz) MEG activity, which has been associated with action potential firing, and therefore links criticality on the macroscopic level of MEG to critical spike avalanches on a microscopic level. Whereas a scale-free dynamics was found under mindfulness meditation and rest, avalanche dynamics shifted towards a critical point during meditation by reduction of neural noise. Together with our finding that during mindfulness meditation avalanches show differences in topography relative to rest, our results show that self-regulated attention as required during meditation can serve as a control parameter of criticality in scale-free brain dynamics.


Conflict of interest statement

The authors have declared that no competing interests exist.

Figures

Fig 1
Fig 1. Procedure of the experiment.
A The mindful focused attention (MFA) experiment conducted with group 1 consisted of five blocks each 5 min long and initiated by an instruction either to rest or to meditate with the breath as the primary object of awareness while in intermediate blocks in group 2 short stories were read from the same speaker and subjects had to wait for 5 min afterwards. B Power spectral density was compared between rest, mindful focused attention and in the mind-wandering condition of group 1 (G1) and group 2 (G2), respectively. Colored lines show difference in power values (t-values) as a function of frequency, within each group between the first resting block, and the MFA- (pink line), W- (green line) and final resting blocks (violet line), respectively. The black shaded area gives the surrogate distribution against which each t-value was compared. The horizontal lines give the confidence interval. C We observed a significant decrease of power between rest and MFA across a wide frequency spectrum covering the gamma and high frequency activity range. D shows the topographical distribution of differences in power in the high frequency band. The green and pink square correspond with the green and pink line in C, respectively. MEG magnetometers showing the strongest difference in power were located bilaterally over a fronto-temporal region. The lower panel shows correlation of individual MAAS scores with power difference between rest and MFA. Only in sensors covering the right frontal cortex we found both power difference between rest and MFA and correlation of these power differences with MAAS score. E shows MEG activity with trough (upper panel) and peak (lower panel) events showing different patterns of clustering yielding different likelihood distribution of cascade sizes. F shows Gaussian fit to histogram of trough and peak events (red line mean, green line lower and upper confidence interval of estimated Gaussian fits.
Fig 2
Fig 2. Depiction of trough and peak cascades.
A We extracted the peaks (black) and troughs (red) of the broad band signal. At these time points we estimated the phase distribution of all 39 narrow frequency bands. Each ring represents the phase distribution of one frequency band ranging from low (cyan) to high frequencies (pink). We calculated the phase concentration κ for each of the frequencies (lower panel). The phase distributions in the alpha, beta, gamma and high-frequency range have an oval (corresponding with high κ) while frequencies around 50 Hz have more circular form (corresponding with low κ). B shows cascade size and cascade duration likelihood distributions for one subject for the different frequency bands in a log-log representation. Low frequencies are shown in darker shades. C We found systematically lower residuals (better linear fit) for 9–37 Hz (LFB) and 170–275 Hz (HFB) frequency bands and slopes not different from the critical value α = -1.5. Red line shows average across subjects (individual values shown by blue dots) and standard errors for 10 ms time bins.
Fig 3
Fig 3. Depiction of cascade size distribution across frequencies.
A We found better linear fits in the HFB compared to exponential and log-normal fits but no such pattern in the LFB. B We found high residuals of the linear fit to the CS taken from randomized data (black) as compared to empirical data (red). C ratio of CS and CD slopes were not different from correlation slopes between CS and CD indicating criticality in HFB but not in the LFB. D shows cascade evolution (shape) as a function of cascade length for both LFB and HFB. Note that only HFB shows comparable cascade shapes for different cascade sizes. E in the HFB higher MAAS score predicted a better linear fit as indicated by smaller residuals and were also correlated with the slope of the linear regression.
Fig 4
Fig 4
A shows that the linear fit explained almost perfectly variance in the cascade size distributions of both conditions in both groups. B shows that only the HFB showed a significant difference between blocks in group 1 with CS more closely to α = -1.5 during MFA but not for the control group. C shows regression slope α for each of the 5 blocks. All black lines indicate statistically significant pairwise differences. The gray lines indicate pairwise comparisons which did not show significant differences.
Fig 5
Fig 5. Depiction of topographical distribution differences between conditions.
A shows events centred on start of the cascade as marked by 0 for each magnetometer (y-axis). The red framed area denotes the time bin in which no event was found. In each MEG magnetometer we summed all events found at each sample point both for rest and MFA. Here we depict the difference in the number of events. Light areas indicate that more events were found in the MFA condition while darker areas indicate that more events were found in the Rest condition. The upper panel shows the events found in the HFB. Vertical lines show the temporal bins of 10 msec. MEG magnetometers were sorted according to the number of events found in the first time bin. MEG magnetometers marked by the black vertical line are those showing the strongest difference between rest and MFA and are located over the right hemisphere. This difference is stronger in the HFB than in the LFB. B shows the topographical distribution of the likelihood of MEG magnetometers to be involved in HFB cascades (left in the first time bin and right across all time bins). Blue areas show regions of MEG magnetometers in which the likelihood is higher during MFA than during rest. Red areas show regions of MEG magnetometers in which the likelihood is higher during rest than meditation. MEG magnetometers at which we observed a significant difference are marked with a black dot.

References

    1. Bak P. How Nature Works. 2nd ed copernicus; 1996.
    1. Cocchi L, Gollo LL, Zalesky A, Breakspear M. Criticality in the brain: A synthesis of neurobiology, models and cognition. Prog Neurobiol. 2017;158:132–52. 10.1016/j.pneurobio.2017.07.002 - DOI - PubMed
    1. Beggs JM, Plenz D. Neuronal Avalanches in Neocortical Circuits. J Neurosci. 2003;23(35):11167–77. 10.1523/JNEUROSCI.23-35-11167.2003 - DOI - PMC - PubMed
    1. Shew WL, Yang H. Neuronal Avalanches Imply Maximum Dynamic Range in Cortical Networks at Criticality. 2009;(September 2014). - PMC - PubMed
    1. Shew WL. Neuroscientist The Functional Benefits of Criticality in the Cortex. 2012;(May 2012). - PubMed

Publication types