. 2020 Aug 5;107(3):496-508.e6.
doi: 10.1016/j.neuron.2020.05.010. Epub 2020 Jun 10.

Genetics of Gene Expression in the Aging Human Brain Reveal TDP-43 Proteinopathy Pathophysiology

Affiliations

Genetics of Gene Expression in the Aging Human Brain Reveal TDP-43 Proteinopathy Pathophysiology

Hyun-Sik Yang et al. Neuron. .

Abstract

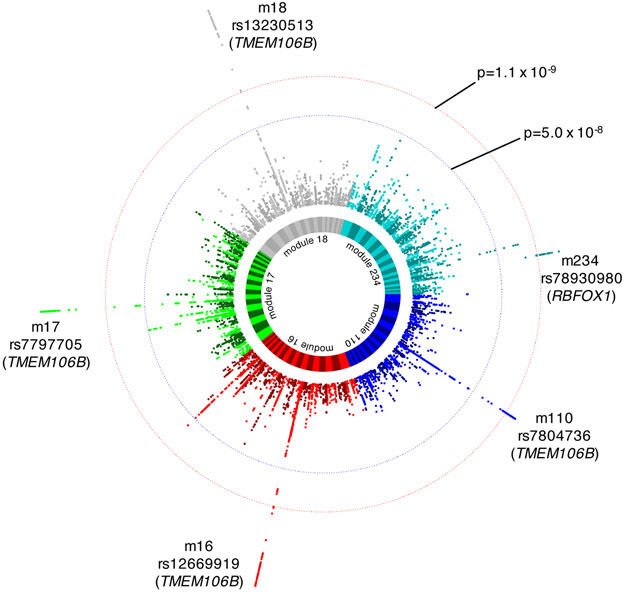
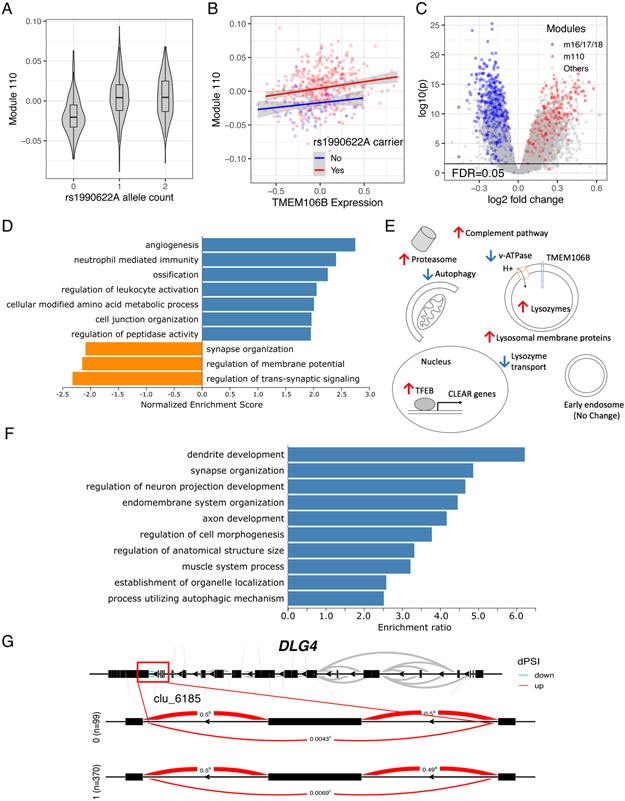
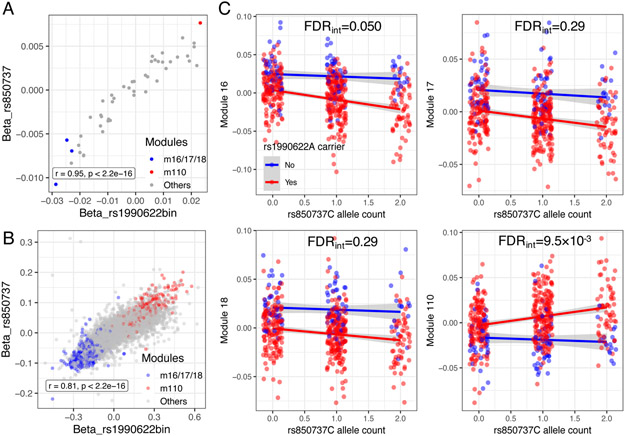
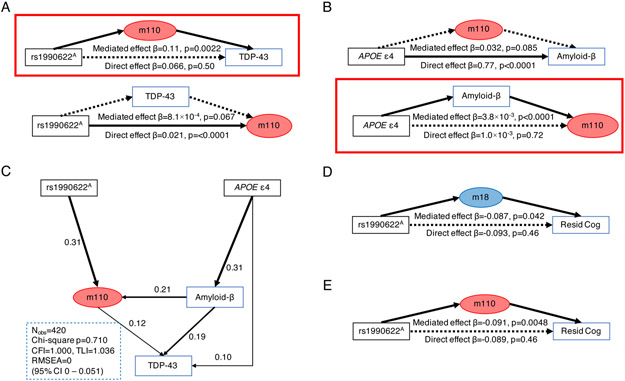
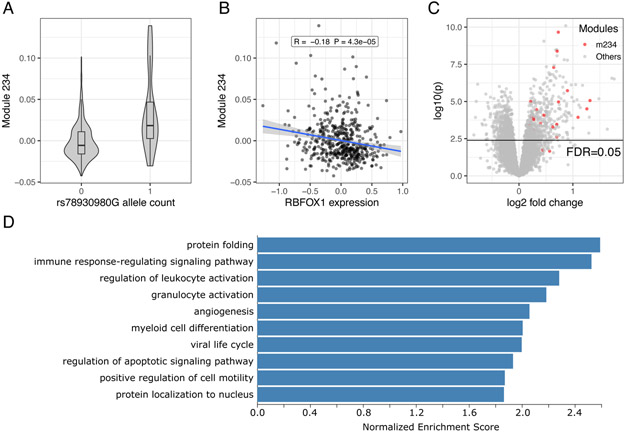
Here, we perform a genome-wide screen for variants that regulate the expression of gene co-expression modules in the aging human brain; we discover and replicate such variants in the TMEM106B and RBFOX1 loci. The TMEM106B haplotype is known to influence the accumulation of TAR DNA-binding protein 43 kDa (TDP-43) proteinopathy, and the haplotype's large-scale transcriptomic effects include the dysregulation of lysosomal genes and alterations in synaptic gene splicing that are also seen in the pathophysiology of TDP-43 proteinopathy. Further, a variant near GRN, another TDP-43 proteinopathy susceptibility gene, shows concordant effects with the TMEM106B haplotype. Leveraging neuropathology data from the same participants, we also show that TMEM106B and APOE-amyloid-β effects converge to alter myelination and lysosomal gene expression, which then contributes to TDP-43 accumulation. These results advance our mechanistic understanding of the TMEM106B TDP-43 risk haplotype and uncover a transcriptional program that mediates the converging effects of APOE-amyloid-β and TMEM106B on TDP-43 aggregation in older adults.

Keywords: Alzheimer's disease; Amyloid-β; GRN; RBFOX1; TDP-43; TMEM106B; co-expression module; cognitive resilience; eQTL; expression quantitative trait loci; sQTL; splicing quantitative trait loci.


Conflict of interest statement

Declaration of Interests P.L.D. serves on a scientific advisory board for Neuroimmunology Newco, Roche, Biogen, and Celgene; has a sponsored research agreement with Biogen and Roche; and has fellowship funding through Genentech, outside the submitted work. All other authors declare no competing interests.

Figures

Figure 1.
Figure 1.. Module quantitative trait loci (ROSMAP).
Summary of the genome-wide association studies (GWAS) of gene co-expression module levels in the primary dataset (ROSMAP DLPFC, n=494). The circos plot displays five independent Manhattan plots: each colored sector represents a Manhattan plot summarizing the GWAS result for a module that had a significant modQTL. Outer (red) dotted circle indicates the Bonferroni-corrected p-value threshold for genome-wide significance, considering 47 independent GWAS we conducted, each for one of the 47 ROSMAP DLPFC modules. Inner (blue) dotted circle indicates genome-wide threshold for a single GWAS (p=5×10⁻⁸). Top association SNP is noted for each module, and the candidate gene corresponding to each SNP is noted in parenthesis. We note that four TMEM106B SNPs are in the same haplotype with rs1990622 (D’=0.99 to 1, r2=0.95 to 0.98).
Figure 2.
Figure 2.. The TMEM106B locus harbors multiple modQTL, trans-eQTL, and trans-sQTL effects.
(A) Dominant effect of rs1990622A on m110 expression. Violin plot shows the distribution of module expression level (y-axis) in relation to rs1990622A allele count (x-axis). The upper edges of the boxes are the 75th percentiles, and the middle horizontal lines are medians, and the lower edges are 25th percentiles. The whiskers of the boxes extend to the maximum and minimum values, but no further than 1.5 × interquartile range. See Figure S3A for m16-18. (B) TMEM106B expression level (x-axis) does not modify the strength of the association between rs1990622A carrier status (red: yes, blue: no) and m110 expression (y-axis). Solid colored line is a fitted linear regression line for each rs1990622A carrier status, and shaded regions indicate 95% confidence interval for the regression line. See Figure S3B for m16-18. (C) Volcano plot from the transcriptome-wide trans-eQTL analysis of rs1990622A (dominant model) shows n=4,170 upregulated genes and n=3,360 downregulated genes at FDR<0.05 (indicated by the black horizontal line). x-axis indicates log 2 fold change in gene expression, and y-axis is −log10 p-value. Observed extensive trans-eQTL association was not limited to the genes in the modQTL-associated modules (blue: m16/m/17/m18, red: m110). (D) Top 10 enriched GO terms (all FDR<0.05) of the rs1990622A trans-eQTLs (dominant model). (E) Schematic summary of selected upregulated and downregulated KEGG pathways. See Table S7 for the list of genes from each pathway that are up/downregulated. (F) Top 10 overrepresented GO terms (all FDR<0.05) among the genes differentially spliced according to rs1990622A carrier status (trans-sQTL). See Table S8 for the full list of differentially spliced genes. (G) DLG4 is an example gene that has a trans-sQTL association with rs1990622A. Differential intron usage at cluster 6185 (toward the 3’-end of DLG4) is shown. CLEAR, Coordinated Lysosomal Expression and Regulation network; dPSI, delta percent spliced in; KEGG, Kyoto Encyclopedia of Genes and Genomes; v-ATPase, vacuolar-ATPase.
Figure 3.
Figure 3.. Concordant and synergistic modQTL effects between rs850737C (GRN) and rs1990622A (TMEM106B).
(A and B) rs850737C and rs1990622A show highly correlated modQTL (A) and trans-eQTL (B) effects. m16-18 and their gene members are indicated by blue color, and m110 and its gene members are indicated by red color. The gray dots are other modules or genes. (C) Each panel shows module expression of m16, m17, m18, and m110 (y-axis; each dot representing each participant) according to rs1990622A carrier status (blue dots – non-carrier, red dots – carrier) and rs850737C allele count (x-axis). Blue and red lines capture mean module expression of rs1990622A non-carriers and carriers, respectively, at a given rs850737C allele count (with 95% confidence interval indicated by gray color). FDR for epistasis between rs1990622A carrier status and rs850737C dosage are indicated (FDRint; adjusted across four analyses displayed in the figure), showing significant epistasis between TMEM106B and GRN SNPs for m16 and m110. For full results of epistasis analysis, see Table S10.
Figure 4.
Figure 4.. Clinical implications of the rs1990622A modQTL.
(A) Bidirectional mediation models (nonparametric bootstrap with 10,000 simulations) testing the relationship of m110 and LATE-NC (TDP-43) burden with rs1990622A. The model assuming m110 as a mediator showed significant mediation (upper diagram, red box), while an alternative model did not (lower diagram). (B) Bidirectional mediation models testing the relationship of m110 and Aβ burden with APOE ε4. The model having Aβ as a mediator showed significant mediation (lower diagram, red box), while an alternative model did not (upper diagram). (C) A structural equation modeling of APOE/Aβ and TMEM106B-related pathways for LATE-NC pathogenesis. The analyses were conducted in 420 ROSMAP participants with non-missing data and were adjusted for age at death and sex. Model fit metrics (left lower corner) indicate excellent model fit. (D and E) m18 (D) and m110 (E) mediate the association between rs1990622A and residual cognition. APOE ε4, APOE ε4 carrier status; CFI, comparative fit index; Nobs=number of participants; RMSEA, root mean square error of approximation; rs1990622A, rs1990622A carrier status; TLI, Tucker Lewis index.
Figure 5.
Figure 5.. RBFOX1 rs78930980 modQTL and trans-eQTL.
(A) modQTL association between rs78930980G and m234. There was no rs78930980G homozygote in ROSMAP. Violin plot shows the distribution of module expression level (y-axis) in relation to rs78930980G allele count (x-axis). The upper edges of the boxes are the 75th percentiles, and the middle horizontal lines are medians, and the lower edges are 25th percentiles. The whiskers of the boxes extend to the maximum and minimum values, but no further than 1.5 × interquartile range. (B) Lower RBFOX1 expression is associated with higher m234 expression. Pearson’s r and p-value are indicated in the label. Solid line is a fitted linear regression line, and shaded regions indicate 95% confidence interval for the regression line. (C) Volcano plot from the transcriptome-wide trans-eQTL analysis of rs78930980G shows n=547 upregulated genes and n=537 downregulated genes at FDR<0.05 (indicated by the black horizontal line). x-axis indicates log 2 fold change in gene expression, and y-axis is −log10 p-value. M234 genes are indicated in red dots. (D) Top 10 enriched GO terms (all FDR<0.05) of the rs78930980G trans-eQTLs.

References

    1. Albert FW, and Kruglyak L (2015). The role of regulatory variation in complex traits and disease. Nature reviews Genetics 16, 197–212. - PubMed
    1. Allen M, Carrasquillo MM, Funk C, Heavner BD, Zou F, Younkin CS, Burgess JD, Chai HS, Crook J, Eddy JA, et al. (2016). Human whole genome genotype and transcriptome data for Alzheimer's and other neurodegenerative diseases. Scientific data 3, 160089. - PMC - PubMed
    1. Allen M, Wang X, Burgess JD, Watzlawik J, Serie DJ, Younkin CS, Nguyen T, Malphrus KG, Lincoln S, Carrasquillo MM, et al. (2018a). Conserved brain myelination networks are altered in Alzheimer's and other neurodegenerative diseases. Alzheimer's & dementia : the journal of the Alzheimer's Association 14, 352–366. - PMC - PubMed
    1. Allen M, Wang X, Serie DJ, Strickland SL, Burgess JD, Koga S, Younkin CS, Nguyen TT, Malphrus KG, Lincoln SJ, et al. (2018b). Divergent brain gene expression patterns associate with distinct cell-specific tau neuropathology traits in progressive supranuclear palsy. Acta neuropathologica 136, 709–727. - PMC - PubMed
    1. Alzheimer's Association (2018). 2018 Alzheimer's disease facts and figures. Alzheimer's & Dementia 14, 367–429. - PubMed

Publication types

MeSH terms