. 2020 Jun 25;181(7):1661-1679.e22.
doi: 10.1016/j.cell.2020.05.001. Epub 2020 Jun 10.

Personalized Mapping of Drug Metabolism by the Human Gut Microbiome

Affiliations

Personalized Mapping of Drug Metabolism by the Human Gut Microbiome

Bahar Javdan et al. Cell. .

Abstract

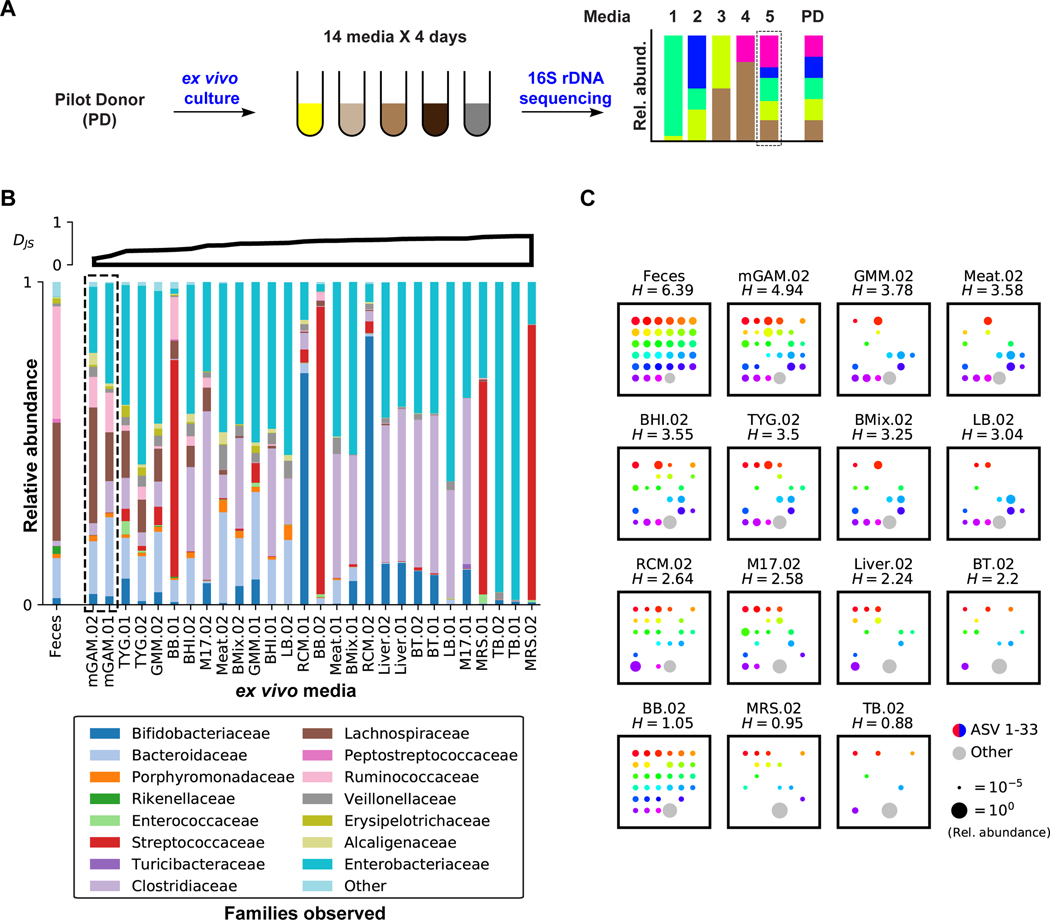
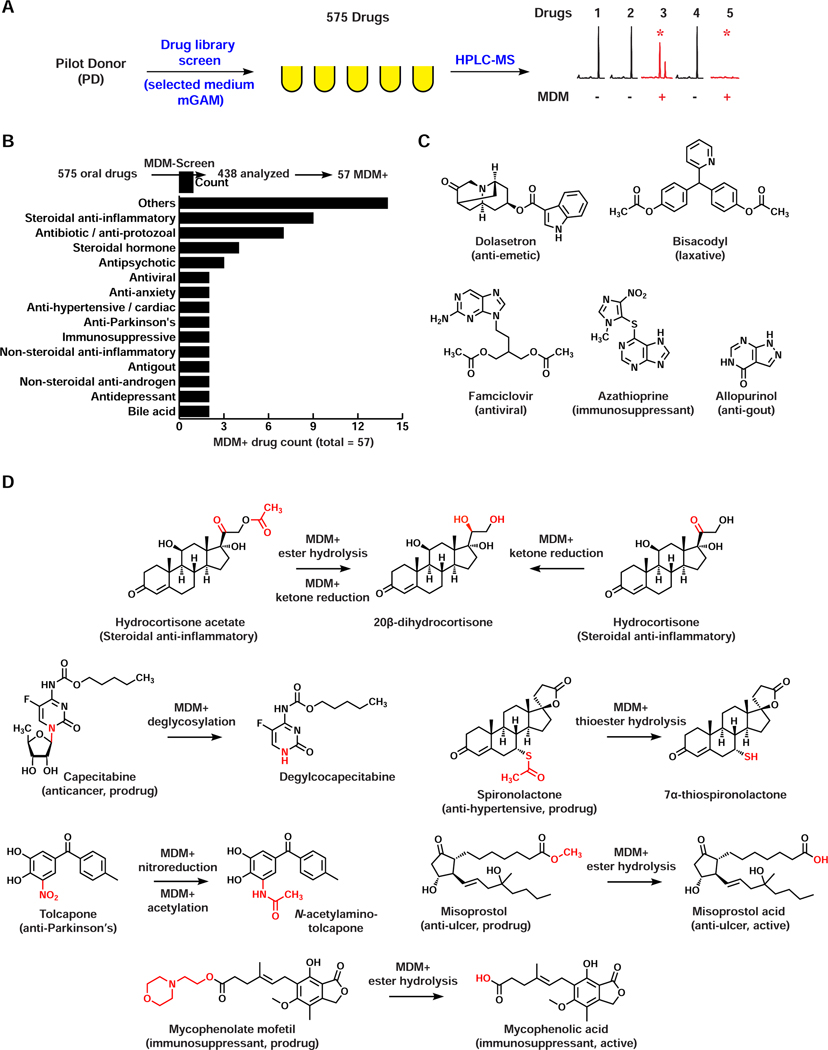
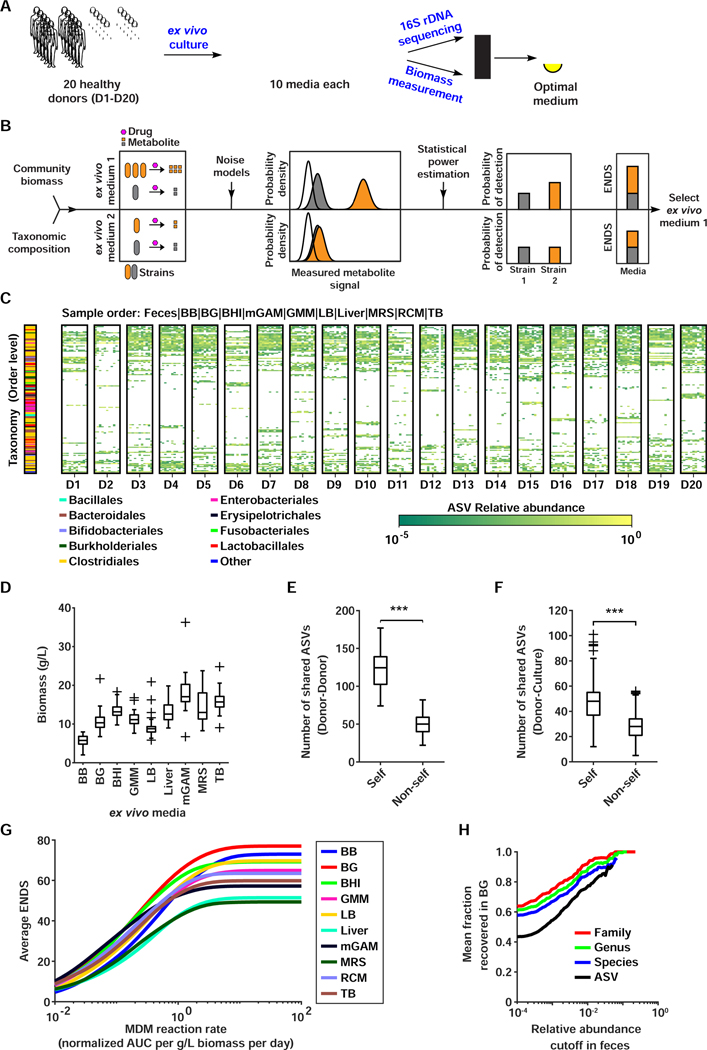
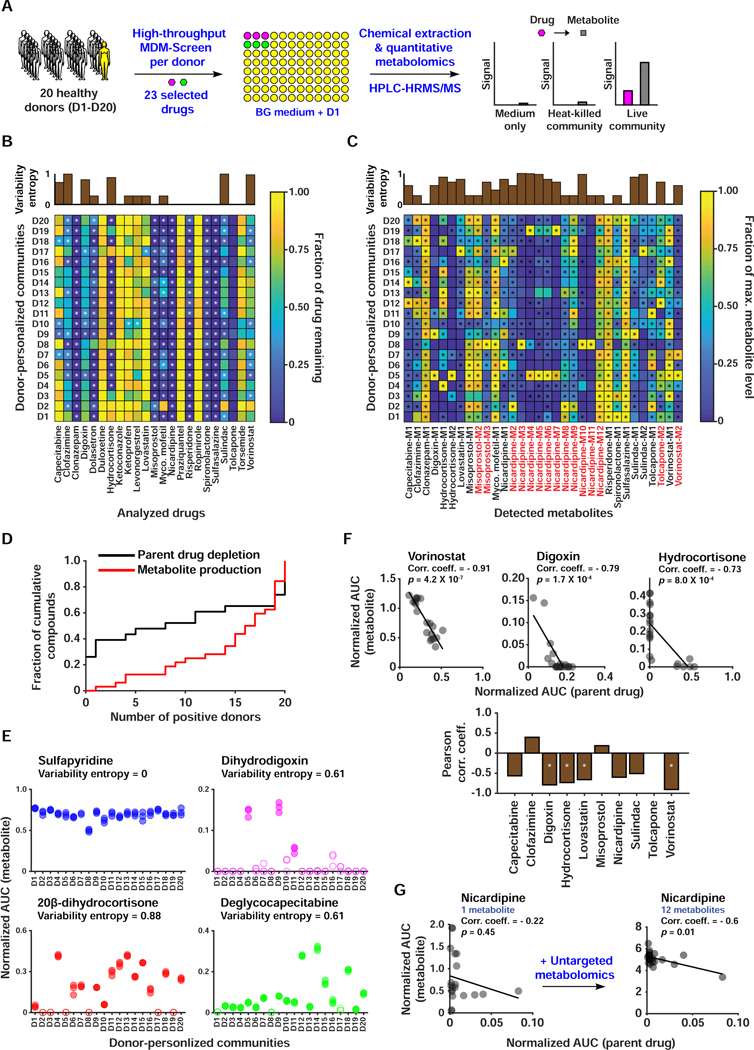
The human gut microbiome harbors hundreds of bacterial species with diverse biochemical capabilities. Dozens of drugs have been shown to be metabolized by single isolates from the gut microbiome, but the extent of this phenomenon is rarely explored in the context of microbial communities. Here, we develop a quantitative experimental framework for mapping the ability of the human gut microbiome to metabolize small molecule drugs: Microbiome-Derived Metabolism (MDM)-Screen. Included are a batch culturing system for sustained growth of subject-specific gut microbial communities, an ex vivo drug metabolism screen, and targeted and untargeted functional metagenomic screens to identify microbiome-encoded genes responsible for specific metabolic events. Our framework identifies novel drug-microbiome interactions that vary between individuals and demonstrates how the gut microbiome might be used in drug development and personalized medicine.

Keywords: drug metabolism; drug-microbiome interactions; functional metagenomics; gut microbiome; microbial community; personalized medicine.


Conflict of interest statement

Declaration of Interests M.S.D. is a member of the scientific advisory board of DeepBiome Therapeutics. A patent is being filed by Princeton University for the use of quantitative MDM-Screen to measure inter-individual variability in drug metabolism.

Figures

Figure 1.
Figure 1.. Development of an ex vivo batch culturing system for the PD microbiome.
A) Schematic representation of the media selection procedure. B) Family level bacterial composition of the original fecal sample (far left), as well as that of PD ex vivo cultures grown anaerobically in 14 different media over two days (.01 and .02). See STAR Methods for full media names. 16S rRNA gene sequences that could not be classified at the family level, and families with less than 1% relative abundance in all samples are grouped into “Other”. Cultures are ordered according to their Jensen-Shannon (DJS) divergence from the original PD sample (upper axes, computed at the family level in base e). C) ASV level bacterial composition of the original PD fecal sample, and that of day two ex vivo cultures of PD, where each square represents one sample. Rainbow colored dots represent the relative abundance of individual ASVs that are above 1% in PD, while grey dots represent the combined relative abundance of all ASVs below 1% in PD. Samples are ordered by their Shannon diversity (H) at the ASV level, computed in base 2 and shown above each square. See also Figure S1, Table S2.
Figure 2.
Figure 2.. Screening of the PD microbiome against orally administered drugs identifies novel drug-microbiome interactions.
A) Schematic representation of MDM-Screen. A drug was considered MDM+ if a new metabolite is produced (e.g., drug 3) or if the drug is no longer detectable (e.g., drug 5) after incubation with the microbiome, as compared to abiotic media controls. B) A bar graph showing the pharmacological classes of MDM+ drugs discovered by MDM-Screen with the PD microbiome. “Others” include one drug each from 14 additional classes. C) Examples of MDM+ drugs where the drug is no longer detectable after incubation with the PD microbiome. D) Examples of MDM+ drugs where a new metabolite is discovered by MDM-Screen and fully characterized in this study. See also Table S1, Data S1,S2.
Figure 3.
Figure 3.. Identifying the optimal medium for multi-donor MDM-Screen.
A) Schematic representation of the media selection procedure for D1–20. B) Schematic representation of the ENDS metric. Using 16S rDNA sequencing and biomass measurements, absolute abundances of ASVs (orange and grey strains) in different ex vivo communities are measured and metabolite production from each member of the community is estimated using a simple mathematical model. Using instrument noise properties, distributions of metabolite measurements from each ASV (orange and grey distributions) are estimated and compared to instrument noise (white distribution). Statistical power estimation is then used to compute metabolism detection probabilities for each ASV and the condition maximizing ENDS (the sum of these probabilities) is selected. C) ASV abundance heat map of the original fecal samples and ex vivo microbial communities for each donor. Each box corresponds to samples from a single donor, with the original fecal sample shown on the far left followed by different ex vivo media in the order specified above the heat map. Only ASVs above 5% in at least one sample are shown, with all remaining ASVs aggregated into ‘Other’. The taxonomic classification of each ASV (on the order level) is indicated by the color bar on the left. D) Histogram of ex vivo community biomass for all donors in different media conditions. E) Comparison of shared ASVs within (self, i.e., the ASV richness) and between (non-self) donor fecal samples. ‘***’ indicates p < 0.001, permutation test. F) Comparison of shared ASVs between donor fecal samples and ex vivo cultures originating from the same donor (self) versus ones originating from other donors (non-self). ‘***’ indicates p < 0.001, permutation test. G) Average ENDS of different media conditions at varying metabolite production rates (quantified as AUC normalized to an internal standard). ENDS was computed for each ex vivo culture assuming a p-value significance cutoff of 0.01 and three replicates. For each media condition, ENDS was averaged across all donors. H) Average fractional recovery of different taxa in BG ex vivo communities as a function of relative abundance in the original donor fecal sample. The fractional recovery was calculated for all donors and then averaged. See also Figure S1, Table S2.
Figure 4.
Figure 4.. A HT, quantitative metabolomic approach to assess inter-individual variability in MDM using personalized microbial communities.
A) Schematic representation of quantitative MDM-Screen with 20 donors and 23 selected drugs. B) Heat map of drug depletion showing the mean fraction of drug remaining after 24 hours for each donor-drug combination. The fraction remaining is computed relative to the medium-drug control, and fractions above 1 are truncated to 1 for simplicity. C) Heat map of metabolite production showing the mean level of metabolite after 24 hours, normalized to the maximum level of that metabolite across all donors. Metabolites in red were discovered using the untargeted metabolomics approach, while ones in black were discovered previously or by MDM-Screen with the PD microbiome (Table S3B). In B and C, “*” indicates statistically significant metabolism in the donor condition as compared to controls. The upper inset axes represent inter-individual variability in MDM using the Shannon entropy (calculated in base 2) of the distribution of donors with significant and non-significant metabolism. D) Cumulative histogram of the number of significant donors for both metabolite production and parent drug depletion. For parent drugs, the y-axis is normalized to the total number of drugs tested (23), and for metabolite production, it is normalized to the total number of metabolites produced (32). Levels of metabolite production (measured by HPLC-HRMS in AUC normalized to an internal standard) for four drugs, with the variability entropy indicated above. Filled data points indicate that the replicates are significantly higher than control conditions, while hollow data points indicate that they are not. F) The upper three scatter plots show significant negative correlation between drug depletion and metabolite production, with the Pearson correlation coefficient indicated above. The line shown is a linear regression fit of the data. The lower bar plot indicates the Pearson correlation coefficient between remaining drug levels and total metabolite production for all computed cases. ‘*’ indicates an FDR corrected two-sided t-test p < 0.01. For drugs with multiple metabolites, we sum the normalized AUC of all metabolites. G) Correlation between drug depletion and metabolite production for nicardipine before and after inclusion of metabolites discovered by untargeted metabolomics. See also Table S3.
Figure 5.
Figure 5.. Genetic basis and widespread nature of MDM deglycosylation among the FPs and in human gut metagenomes.
A) Genetic organization of the udp and deoA loci in the genome of E. coli BW25113. B) A bar graph indicating percent conversion of capecitabine to deglycocapecitabine by wild type E. coli BW25113 (WT), and Δudp, ΔdeoA, and ΔdeoAudp mutants (each tested in triplicate). *** indicates p-value <0.001, while ** indicates p-value <0.01, two-tailed t-test. Error bars represent the standard deviation. C) Biochemical reaction catalyzed by thymidine and uridine phosphorylases on their natural substrates. D) MDM deglycosylation of the oral anticancer drug trifluridine leads to its premature inactivation, since trifluorothymine is no longer active. E) MDM deglycosylation of the anticancer prodrug doxifluridine leads to its premature activation, since 5-FU is the intended active metabolite. F) Heat maps indicating the prevalence and median abundance (in RPKM) of E. coli-derived deoA and udp across six gut metagenomic cohorts. G) Jitter plots of E. coli-derived deoA and udp abundances (in RPKM) in the same cohorts. See also Figures S4,S5, Table S4.
Figure 6.
Figure 6.. A functional metagenomic screening approach to identify a metabolizing enzyme.
A) Schematic representation of the functional metagenomic screening approach. B) A scatter plot comparing the coverage of assembled PD scaffolds (≥ 2 Kbp, in RPKM) in the two metagenomic datasets (PD and PD-CL-100). Dots representing PD metagenomic scaffolds are colored and sized on the basis of their phylum-level taxonomic assignments and lengths, respectively, and as indicated in the key on the right. For ease of visualization, only scaffolds with RPKM values ≤ 10 are shown in this plot (97% of all scaffolds ≥ 2 Kbp) (see also Table S4A for the entire dataset). C) Functional metagenomic screening of the PD-CL library. Beginning with pools containing 2–6 X 10⁴ unique clones, pools were selected and further sub-pooled based on their functional ability to convert hydrocortisone to 20β-dihydrocortisone. Produced 20β-dihydrocortisone levels were quantified using HPLC-HRMS as AUC normalized to an internal standard. For each round, the pool producing the highest normalized signal of 20β-dihydrocortisone (signified by a red dot with a black outline) was selected for further sub-pooling, until a unique clone encoding a 20β-HSDH activity was identified. A single 20β-HSDH gene from the positive metagenomic clone was further verified by heterologous expression in E. coli, when cloned as the native sequence (cloned) or synthesized as codon-optimized for E. coli (synth.), in comparison to an empty-vector control (empty vector). D) Genetic organization of two unique clones identified using functional metagenomic screening for the 20β-HSDH activity (PD-CL-Hyd-red-1 and PD-CL-Hyd-red-2), in comparison to their corresponding scaffold assembled from the PD metagenome. E) A bar graph indicating the count of PD fecal metatranscriptomic reads that mapped to the discovered 20β-HSDH gene (red) and its flanking genes (grey). F) Heat maps indicating the prevalence and median abundance (in RPKM) of 20α-HSDH (from C. scindens) and 20β-HSDH (from the PD metagenome) across six gut metagenomic cohorts. G) Jitter plots of 20α-HSDH (from C. scindens) and 20β-HSDH (from the PD metagenome) abundances (in RPKM) in the same cohorts. See also Figure S6, Table S4.
Figure 7.
Figure 7.. MDM deglycosylation occurs in vivo.
A) Schematic representation of the microbiome-dependent pharmacokinetic experiment performed here. B) Design of the capecitabine pharmacokinetic experiment. Mice are treated with antibiotics for 14 days, then colonized with PD (N=6) or left uncolonized (N=6). On the pharmacokinetic experiment day, a single human-equivalent dose is administered to mice using oral gavage, and serial sampling of blood (B) and feces (F) is performed at 0, 20, 40, 60, 120, and 240 minutes post dosing. C) HPLC-HRMS based quantification of deglycocapecitabine in fecal samples from mice colonized with PD in comparison to uncolonized ones. Metabolite AUC per gram of feces is normalized by the AUC of the internal standard (see STAR Methods). Error bars represent the standard error of the mean. The difference between the two conditions is significant (p < 0.01, determined by testing the intersection null hypothesis with marginal two-tailed t-tests using the Bonferroni correction to control family-wise error rate). See also Figure S7.

References

    1. Almeida A, Mitchell AL, Boland M, Forster SC, Gloor GB, Tarkowska A, Lawley TD, and Finn RD (2019). A new genomic blueprint of the human gut microbiota. Nature 568, 499–504. - PMC - PubMed
    1. Azadkhan AK, Truelove SC, and Aronson JK (1982). The disposition and metabolism of sulphasalazine (salicylazosulphapyridine) in man. Br J Clin Pharmacol 13, 523–528. - PMC - PubMed
    1. Baba T, Ara T, Hasegawa M, Takai Y, Okumura Y, Baba M, Datsenko KA, Tomita M, Wanner BL, and Mori H. (2006). Construction of Escherichia coli K-12 in-frame, single-gene knockout mutants: the Keio collection. Mol Syst Biol 2, 2006 0008. - PMC - PubMed
    1. Backhed F, Ley RE, Sonnenburg JL, Peterson DA, and Gordon JI (2005). Host-bacterial mutualism in the human intestine. Science 307, 1915–1920. - PubMed
    1. Bankevich A, Nurk S, Antipov D, Gurevich AA, Dvorkin M, Kulikov AS, Lesin VM, Nikolenko SI, Pham S, Prjibelski AD, et al. (2012). SPAdes: a new genome assembly algorithm and its applications to single-cell sequencing. J Comput Biol 19, 455–477. - PMC - PubMed

Publication types

MeSH terms

Substances