. 2020 Jul 23;182(2):417-428.e13.
doi: 10.1016/j.cell.2020.05.034. Epub 2020 May 22.

Structural Basis for RNA Replication by the SARS-CoV-2 Polymerase

Affiliations

Structural Basis for RNA Replication by the SARS-CoV-2 Polymerase

Quan Wang et al. Cell. .

Abstract

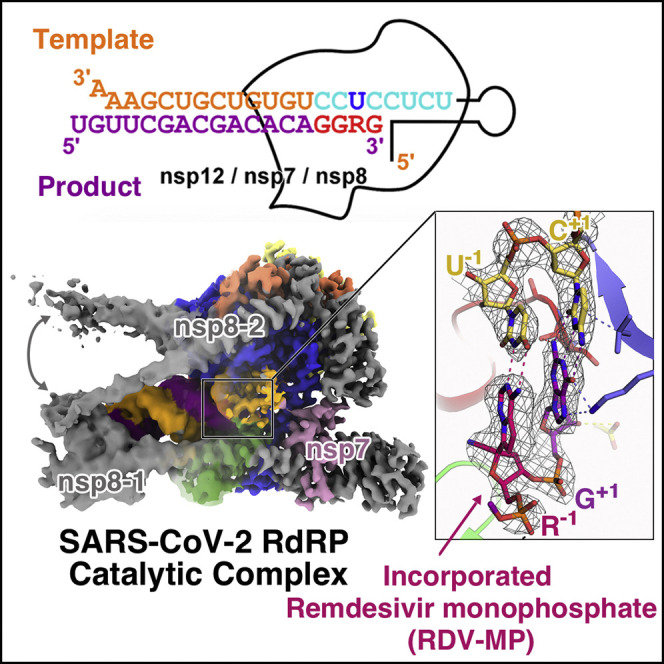
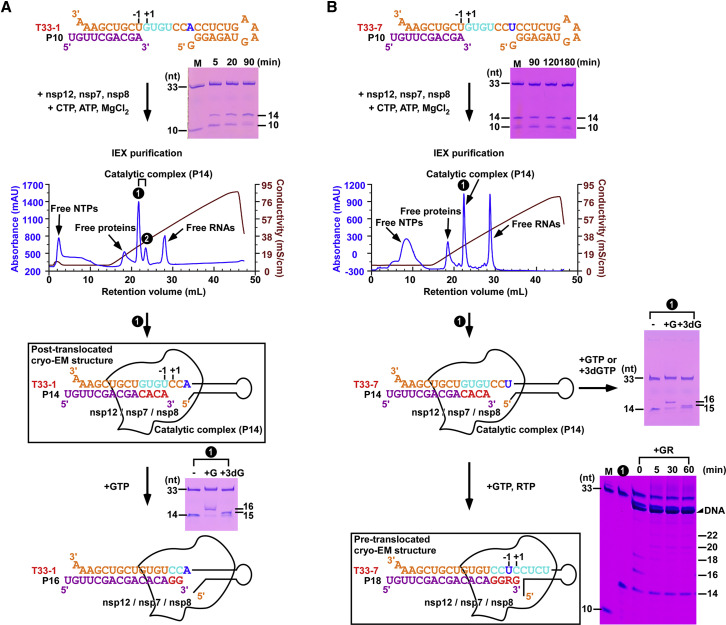
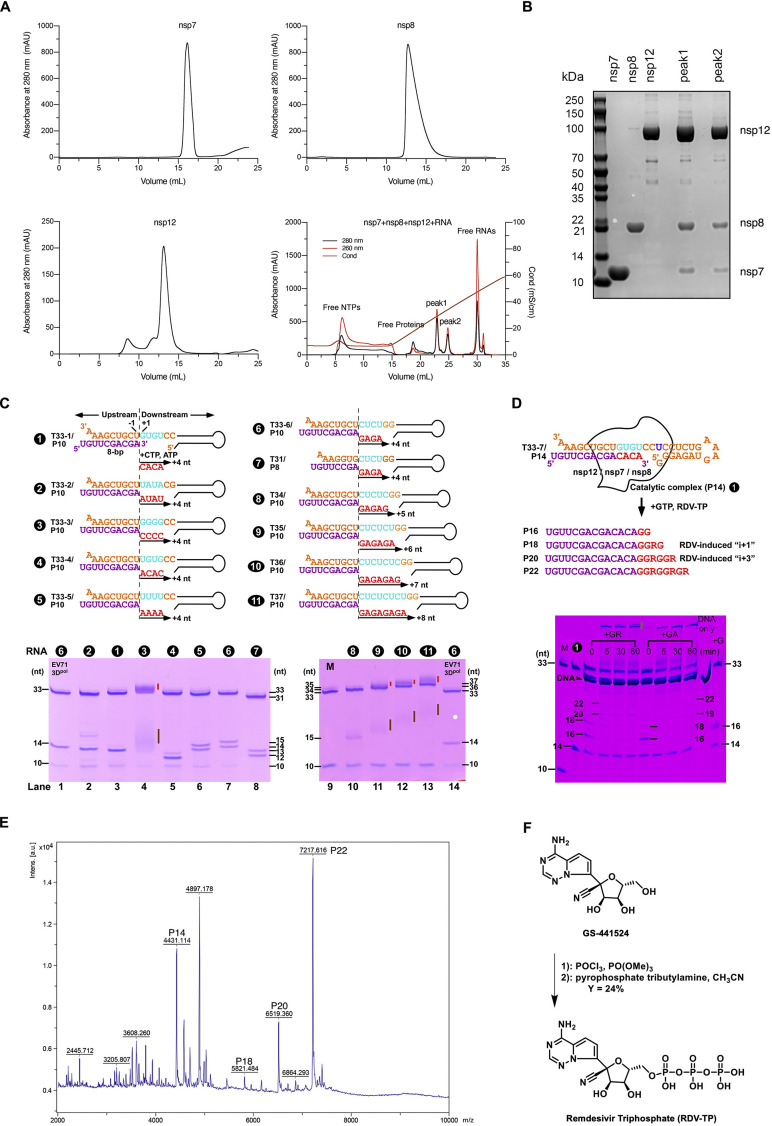
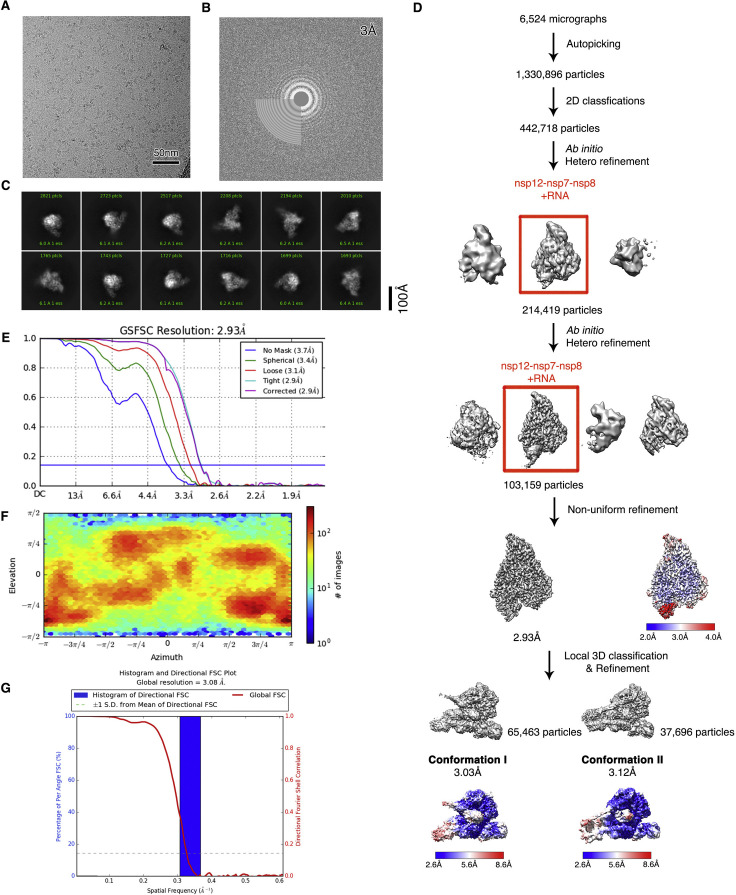
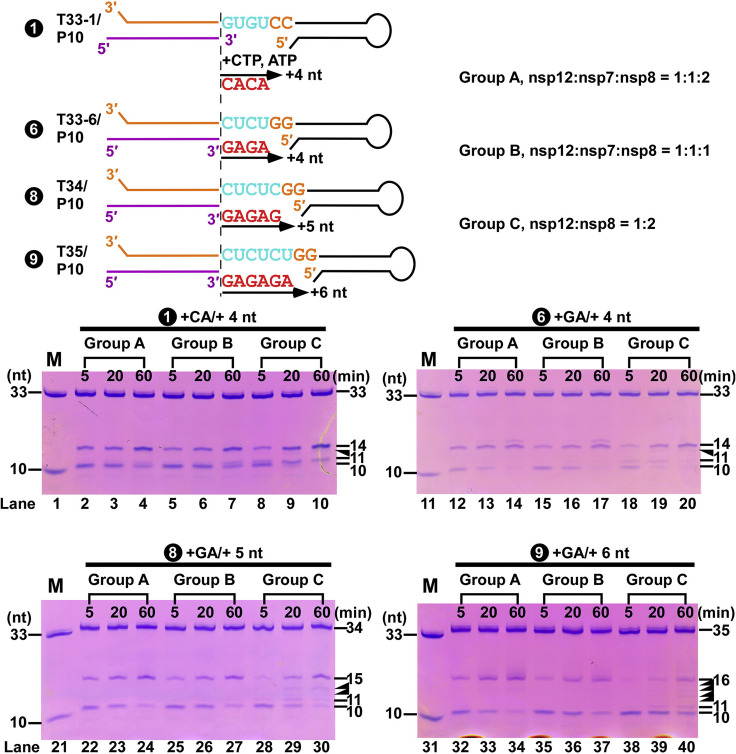
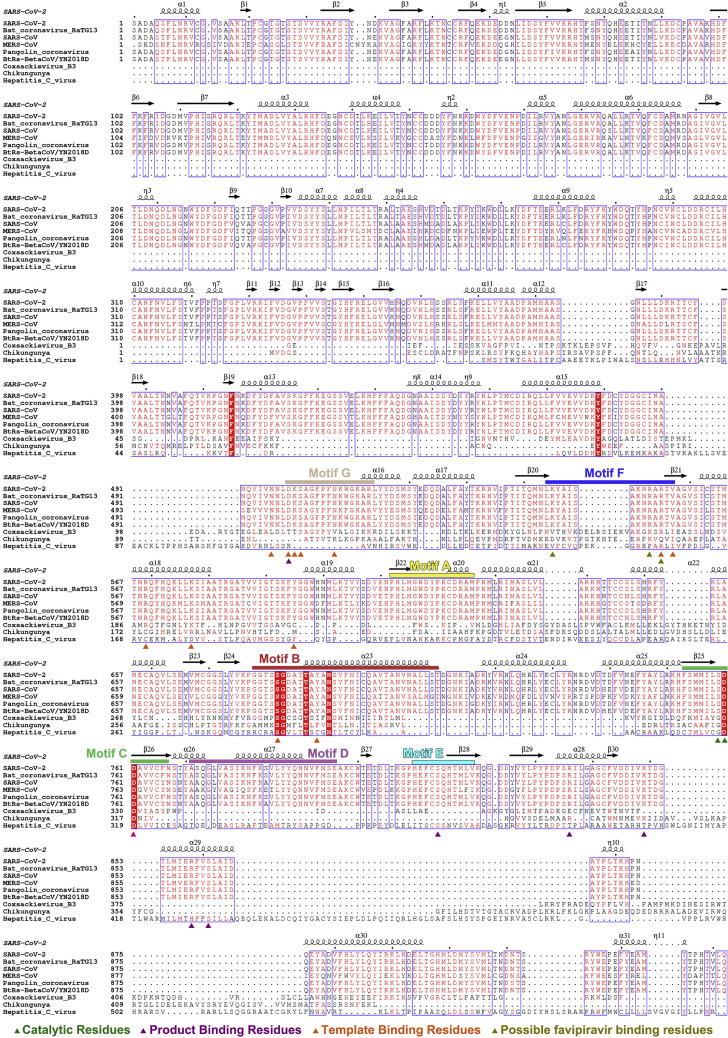
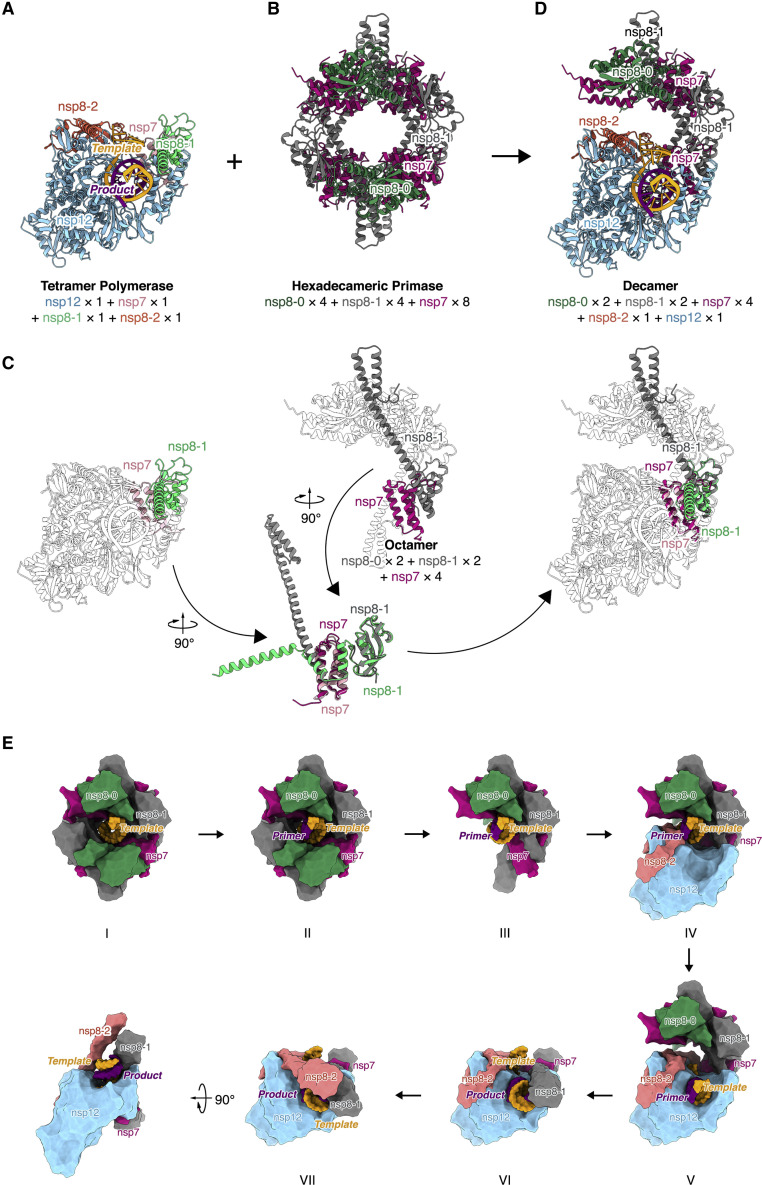
Nucleotide analog inhibitors, including broad-spectrum remdesivir and favipiravir, have shown promise in in vitro assays and some clinical studies for COVID-19 treatment, this despite an incomplete mechanistic understanding of the viral RNA-dependent RNA polymerase nsp12 drug interactions. Here, we examine the molecular basis of SARS-CoV-2 RNA replication by determining the cryo-EM structures of the stalled pre- and post- translocated polymerase complexes. Compared with the apo complex, the structures show notable structural rearrangements happening to nsp12 and its co-factors nsp7 and nsp8 to accommodate the nucleic acid, whereas there are highly conserved residues in nsp12, positioning the template and primer for an in-line attack on the incoming nucleotide. Furthermore, we investigate the inhibition mechanism of the triphosphate metabolite of remdesivir through structural and kinetic analyses. A transition model from the nsp7-nsp8 hexadecameric primase complex to the nsp12-nsp7-nsp8 polymerase complex is also proposed to provide clues for the understanding of the coronavirus transcription and replication machinery.

Keywords: 2019-nCoV; COVID-19; RdRP; SARS-CoV-2; favipiravir; nsp12; nsp8; polymerase; remdesivir; virus.


Conflict of interest statement

Declaration of Interests The authors declare no competing interests.

Figures

None
Graphical abstract
Figure 1
Figure 1
Assembly of SARS-CoV-2 RNA polymerase catalytic complexes A schematic diagram of the catalytic complex assembly, purification, and reactivity assays of a stalled post-translocated complex (A) and an RDV-MP incorporated pre-translocated complex (B). Abbreviation is as follows: IEX: ion-exchange chromatography. (A) The post-translocated complex assembly was performed by using a T33-1:P10 construct, the three nsp proteins, and CTP/ATP as the only NTP substrates to allow the synthesis of a 14-mer product (P14). The majority of the P10 was converted to P14 after a 90-min incubation (“M” indicates a marker with a mixture of 33-mer and 10-mer RNAs). The P14-containing catalytic complex was purified by anion exchange chromatography, and the purified complex can further react with GTP (G) or 3¢-deoxy-GTP (3dG) to yield the 16-mer (P16) or 15-mer containing complexes, respectively. The structure of this P14-containing complex was solved in cryo-EM trials at the post-translocated state. (B) The pre-translocated complex was obtained through a two-step process. In the first step, a T33-7:P10 construct, the three nsp proteins, and CTP/ATP were mixed to allow the synthesis of a 14-mer product (P14). The majority of the P10 are converted to P14 after a 180-min incubation. The P14-containing catalytic complex was purified by anion exchange chromatography, and the purified complex can further react with G or 3dG to yield the 16-mer (P16) or 15-mer containing complexes, respectively. In the second step, the purified P14-containing complex was mixed with GTP and RDV-TP, and a pausing event corresponding to the synthesis of an 18-mer product (P18) was observed. The structure of this P18-containing complex was solved in cryo-EM trials at the pre-translocated state. See also Figure S1.
Figure S1
Figure S1
SARS-CoV-2 polymerase catalytic complex purification and characterization, related to Figures 1, 2, 3, 5, and 6 (A) Gel filtration chromatography analysis of nsp7, nsp8, and nsp12. Ion exchange chromatography analysis of the RdRP-RNA complex (lower right). (B) SDS-PAGE analysis of the chromatography peaks. (C) Eleven RNA constructs tested in screening. The coloring scheme is the same as in Figure 1A and the downstream hairpin sequences are identical for all constructs. Besides the construct name (e.g., T33-1:P10), a number is assigned to each construct. RNA profile on the primer-extension reactions is tested on a gel (lower panels). The EV71 RdRP (3Dpol) capable of producing a homogeneous P14 product from the T33-6:P10 construct (number 6) was used as a reference (lanes 1 and 14). Different extent of primer utilization (compare lanes 2-8 and 10-13), misincorporation (lanes 2/6/7), product migration shift (lanes 4/11/12/13, brown vertical bars), and formation of product template-product-containing higher-order RNA structures (lanes 4/11/12/13, red vertical bars) were observed. One construct did not yield the product of the expected length (lane 5). The T33-1:P10 construct (number 1) was chosen for the catalytic complex assembly and structural study. (D) The accumulation of the T33-7:P10-derived P18 product is related to RDV-MP incorporation. Purified T33-7/P14 complex was incubated with GTP/RDV-TP (+GR) or GTP/ATP (+GA) at 4°C for various periods (“0 min” corresponds to immediate reaction quench after manual mixing to initiate the reaction). For the +GR reaction, the P18 product is most prominent at “0 min” and diminishes over time, suggesting an RDV-induced pausing mechanism. The level of the P20 product is consistent at 5, 30, and 60 min time points, consistent with the RDV-induced “i+3” premature termination mechanism. In the +GA reaction, both the P18 and P20 products are not as prominent. Due to the formation of higher-order product-containing RNA structures (indicated by the green vertical bar), a 33-mer DNA complementary to the RNA template was supplied to help release the RNA products. Note that, in most cases, the release was still incomplete. (E) Mass spectrometry analysis of the mixture sample for cryo-EM imaging of the pre-translocation complex. Purified T33-7/P14 complex was incubated with GTP/RDV-TP (+GR) at 4°C for 30 min. Proteins in the mixture were removed after a heat denature process. (F) Synthesis of remdesivir triphosphate (RDV-TP).
Figure S2
Figure S2
Cryo-EM reconstruction of RdRP pre-translocated catalytic complex, related to Figures 2, 3, 4, 5, and 7 (A) Raw image of particles in vitreous ice recorded at defocus values of −1.0 to −2.0 μm. Scale bar, 50 nm. (B) The power spectrum of the image shown in (A), with an indication of the spatial frequency corresponding to 3.0 Å resolution. (C) Representative class averages. The edge of each square is 246 Å. (D) The data processing scheme. Overview of nsp12-nsp7-nsp8-RNA pre-translocated catalytic complex reconstruction is shown in the bottom panel with the local resolution map. (E) Fourier shell correlation (FSC) of the final 3D reconstruction following gold standard refinement. FSC curves are plotted before and after masking. (F) Angular distribution heatmap of particles used for the refinement. (G) 3DFSC result of the final map. Global FSC and histogram are shown.
Figure S3
Figure S3
Cryo-EM reconstruction of RdRP post-translocated catalytic complex, Related to Figures 2, 3, 4, 5, and 7 (A) Raw image of particles in vitreous ice recorded at defocus values of −1.0 to −1.8 μm. Scale bar, 50 nm. (B) The power spectrum of the image shown in (A), with an indication of the spatial frequency corresponding to 3.0 Å resolution. (C) Representative class averages. The edge of each square is 246 Å. (D) The data processing scheme. Overview of nsp12-nsp7-nsp8-RNA post-translocated catalytic complex reconstruction is shown in the bottom panel with the local resolution map. (E) Fourier shell correlation (FSC) of the final 3D reconstruction following gold standard refinement. FSC curves are plotted before and after masking. (F) Angular distribution heatmap of particles used for the refinement. (G) 3DFSC result of the final map. Global FSC and histogram are shown.
Figure S4
Figure S4
Representative cryo-EM map, related to Figures 2 and 5 Representative regions of the protein model, colored as indicated, under cryo-EM map.
Figure 2
Figure 2
Overall structure of SARS-CoV-2 RNA polymerase catalytic complex (A and B) The overall structure of the stalled post-translocated (A) and RDV-MP-incorporated pre-translocated (B) RNA polymerase catalytic complexes. Experimental cryo-EM maps are shown in the left graphics. In the right graphic, the protein is represented by ribbons and colored by subdomain (blue, fingers; red, palm; green, thumb; yellow, NiRAN; beta-hairpin, cyan; orange, interface). The RNA is depicted with the template strand in orange and the product strand in purple. Nucleotides resolved in the structures are indicated by color shading. (C) Close-up view of the RNA in RDV-MP incorporated pre-translocated complex. Cryo-EM map is colored according to the same scheme in (B). The map threshold of the protein is 0.6, whereas that of the nucleic acid and nsp8 N-terminal helical extension (in white) is 0.3. (D) Focus classification of the reconstruction in (C) results in two conformations of the complex with structural variations on the two nsp8 N-terminal helical extensions. The unsharpened maps (threshold 0.2) are colored according to the same scheme in (B). The threshold for the bent N-terminal helical extension of nsp8-2 (in white) in conformation I is 0.1. (E) Structural variations between the two conformations in (D) are demonstrated in aligned complex structures depicted in the cartoon. N-terminal helical extensions of the nsp8 are docked with the corresponding portion in the SARS-CoV-1 nsp7-nsp8 hexadecameric primase complex (PDB: 2AHM). The gray two-way arrow indicates structural variations. See also Figure S1, Figure S2, Figure S3, Figure S4 and S7.
Figure 3
Figure 3
Polymerase-nucleic acid interactions (A) The interface between RNA template and product and the subdomains that coordinate them (thumb, palm, and fingers) in the pre-translocated complex. A map cross-section showing the nucleic acid signal near the center of the reaction is placed on the right graphic. (B and C) The representative conserved amino acid residues and interactions that coordinate RNA. RNA bases are labeled according to standard polymerase numbering conventions. Protein-ligand hydrogen bonds are shown as dashed lines. The experimental cryo-EM map is superimposed on the RNA template (B) and product (C). See also Figure S1, Figure S2, Figure S3, Figure S4 and S7.
Figure 4
Figure 4
Structural variations among apo and catalytic complexes (A) The pre-translocated complex is colored according to the root mean square deviation (RMSD), which measures the average distance in Å between the C-alpha atoms of the three aligned complexes (pre-translocated complex in red; post-translocated complex in dark green; apo complex in white). (B–F) Structural rearrangements of motif B on palm (B), motif G on fingers (C) and thumb (D), and two copies of nsp8 (E and F). See also Figure S2, Figure S3, and S5.
Figure S5
Figure S5
Structural Variations and corresponding cryo-EM map in NiRAN and motif B among Apo and Catalytic Complexes, related to Figure 4 Pre-translocated complex in red; post-translocated complex in dark green; apo complex in white. (A) The experimental cryo-EM map is superimposed by structural rearrangements of motif B on Palm. Three states are aligned by helix after loop S682 to T686 and residue A685 (shown as black dash lines). (B) The pre-translocated complex is colored according to the root mean square deviation (RMSD) which measures the average distance in Å between the C-alpha atoms of the three aligned complexes(top). An extra undefined map signal (in green) in NiRAN is indicated under an unambiguous experimental cryo-EM map signal. Surrounding residues are shown in sticks and cartoons with the same threshold level (middle). Structural rearrangements of NiRAN are indicated (bottom).
Figure 5
Figure 5
Catalytic center, incorporation and implications on inhibition of nucleotide analog inhibitors (A) Close view of the catalytic center in the RDV-MP incorporated pre-translocated complex. Interactions are shown as dashed lines and measured in Å. (B) The base pair of cytosine and guanosine at +1 position and the coordinating residues under unambiguous experimental cryo-EM map signal. (C) Favipiravir-DP is shown as the stick in olive, aligned on the guanosine at +1 position. (D) The base pair of uracil and incorporated RDV-MP at −1 position under experimental cryo-EM map signal. The 2D chemical structure of the incorporated RDV-MP is provided. (E) Structural demonstration of the delayed chain termination hypothesis of RDV. RDV (in gray) is aligned onto the product strand (in purple) to demonstrate their incorporated state at −4 position. See also Figure S1, Figure S2, Figure S3, Figure S4 and S7.
Figure 6
Figure 6
Behaviors of RDV-TP in primer extension assays (A) The reaction flow charts for five different NTP combinations. (B) The extension profiles are compared for three NTP combinations: (1) CTP+ATP; (2) CTP; and (3) CTP+RDV-TP. The R denotes incorporated RDV-MP. Shown on top, the CTP/RDV-TP reaction yields both 14-mer and misincorporation-related 15-mer products (lanes 5–6). Shown at the middle and bottom, this misincorporation is reduced when RDV-TP but not CTP concentration is lowered. (C) The extension profiles are compared for two NTP combinations: (4) CTP+ATP+GTP (CAG) and (5) CTP+RDV-TP+GTP (CRG) in the absence (left) and presence (right) of a 33-mer DNA complementary to T33-1. Shown on top, both WT RdRP and the S861A mutant can synthesize the expected 16-mer product with the combination of C, A, and GTP. Shown in the middle, other than the 16-mer product, an RDV-related 15-mer product was made (corresponding to an RNA three nucleotides longer than that has the first incorporated RDV-MP or the “i+3” product) by the WT RdRP, indicating a premature termination event. Shown at the bottom, the S861A mutant also produced the 16-mer and the “i+3” products, albeit with a relatively lower amount of “i+3” termination. The addition of the complementary DNA helped visualize the 16- and 17-mer bands by trapping the RNA template. The same marker (M) was used as in Figure 1. See also Figure S1, Figure S4, and S5.
Figure S6
Figure S6
The role of nsp7 and nsp8-1, related to Figure 7 A comparison of primer-extension activities for three different nsp combinations on four RNA constructs. Top: the four RNA constructs differ in template sequences that direct the initial synthesis and the three combination modes (Groups A-C) of nsp12, nsp7, and nsp8 proteins. Bottom: primer-extension profiles. Solid triangles indicate the intermediate products that are more prominent in Group C combination (lanes 8-10, 18-20, 28-30, and 38-40). M: a marker with a mixture of 33-mer and 10-mer RNAs.
Figure S7
Figure S7
Sequence alignment of RdRPs encoded by the virus mentioned, related to Figures 2, 3, and 5 Catalytic residues (in forest), product binding residues (in purple), template binding residues (in orange) and possible favipiravir binding residues (in sandy) are indicated by triangle. Motif A-G are indicated by rectangular.
Figure 7
Figure 7
Transition model from the primase complex to the polymerase catalytic complex (A and B) The SARS-CoV-2 nsp12-nsp7-nsp8 polymerase pre-translocation complex (A) and the SARS-CoV-1 nsp7-nsp8 hexadecameric primase complex (B) (PDB: 2AHM). (C) Structure superimposition of the nsp12-nsp7-nsp8 polymerase catalytic complex and the nsp7-nsp8 octamer half-ring primase complex, on the basis of a common pair of nsp7 (SARS-CoV-1 in rose-red; SARS-CoV-2 in pink) and nsp8-1 (SARS-CoV-1 in dark gray; SARS-CoV-2 in light green). The rest of the subunits remain in a transparent outline. (D) Proposed decamer assembly of nsp12-nsp7-nsp8 polymerase complex and half-ring primase complex. (E) Proposed transition model from the primase complex to the polymerase complex. In state I, the RNA template (in orange) binds to the hexadecameric primase complex (nsp7 in rose-red; first nsp8 isoform, nsp8-0 in dark green; second nsp8 isoform, nsp8-1 in dark gray). In state II, the primase complex de novo synthesizes primer (in purple). In state III, half of the primase complex dissociates. In state IV, the remaining half of the primase complex recruits nsp12 (in blue) and the third isoform of nsp8 (nsp8-2 in pink) bound to it. In state V, the template and primer translocate into the active site of nsp12, the polymerase. RNA synthesis in nsp12-nsp7-nsp8 polymerase complex and the nsp8 N-terminal extension platform is forming (state VI, pre-translocation catalytic complex in conformation I; State VII, pre-translocation catalytic complex in conformation II). See also Figure S2, Figure S3, and S6.

References

    1. Afonine P.V., Grosse-Kunstleve R.W., Echols N., Headd J.J., Moriarty N.W., Mustyakimov M., Terwilliger T.C., Urzhumtsev A., Zwart P.H., Adams P.D. Towards automated crystallographic structure refinement with phenix.refine. Acta Crystallogr. D Biol. Crystallogr. 2012;68:352–367. - PMC - PubMed
    1. Agostini M.L., Andres E.L., Sims A.C., Graham R.L., Sheahan T.P., Lu X., Smith E.C., Case J.B., Feng J.Y., Jordan R. Coronavirus Susceptibility to the Antiviral Remdesivir (GS-5734) Is Mediated by the Viral Polymerase and the Proofreading Exoribonuclease. MBio. 2018 doi: 10.1128/mBio.00221-18. - DOI - PMC - PubMed
    1. Agostini M.L., Pruijssers A.J., Chappell J.D., Gribble J., Lu X., Andres E.L., Bluemling G.R., Lockwood M.A., Sheahan T.P., Sims A.C. Small-Molecule Antiviral β-d-N4-Hydroxycytidine Inhibits a Proofreading-Intact Coronavirus with a High Genetic Barrier to Resistance. J. Virol. 2019 doi: 10.1128/JVI.01348-19. - DOI - PMC - PubMed
    1. Batey R.T., Kieft J.S. Improved native affinity purification of RNA. RNA. 2007;13:1384–1389. - PMC - PubMed
    1. Chen S., McMullan G., Faruqi A.R., Murshudov G.N., Short J.M., Scheres S.H., Henderson R. High-resolution noise substitution to measure overfitting and validate resolution in 3D structure determination by single particle electron cryomicroscopy. Ultramicroscopy. 2013;135:24–35. - PMC - PubMed

Publication types

MeSH terms