. 2020 Sep 7;217(9):e20200412.
doi: 10.1084/jem.20200412.

Poor quality Vβ recombination signal sequences stochastically enforce TCRβ allelic exclusion

Affiliations

Poor quality Vβ recombination signal sequences stochastically enforce TCRβ allelic exclusion

Glendon S Wu et al. J Exp Med. .

Abstract

The monoallelic expression of antigen receptor (AgR) genes, called allelic exclusion, is fundamental for highly specific immune responses to pathogens. This cardinal feature of adaptive immunity is achieved by the assembly of a functional AgR gene on one allele, with subsequent feedback inhibition of V(D)J recombination on the other allele. A range of epigenetic mechanisms have been implicated in sequential recombination of AgR alleles; however, we now demonstrate that a genetic mechanism controls this process for Tcrb. Replacement of V(D)J recombinase targets at two different mouse Vβ gene segments with a higher quality target elevates Vβ rearrangement frequency before feedback inhibition, dramatically increasing the frequency of T cells with TCRβ chains derived from both Tcrb alleles. Thus, TCRβ allelic exclusion is enforced genetically by the low quality of Vβ recombinase targets that stochastically restrict the production of two functional rearrangements before feedback inhibition silences one allele.


Conflict of interest statement

Disclosures: The authors declare no competing interests exist.

Figures

None
Graphical abstract
Figure 1.
Figure 1.
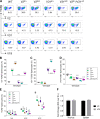
Increased utilization of 3′Dβ1 RSS-replaced Vβ segments on αβ T cells. (A) Schematic of the Tcrb locus and relative positions of V, D, and J segments, C exons, and the Eβ enhancer. Not drawn to scale. (B) Sequences of a consensus heptamer and nonamer and the 3′Dβ1, V2, and V31 RSSs. Differences relative to the consensus heptamer and nonamer are indicated in red. Differences of each Vβ RSS relative to the 3′Dβ1 RSS are underlined. (C) Total numbers of SP thymocytes and splenic αβ T cells (n ≥ 6 mice per group). (D) Representative plots of SP thymocytes expressing V2+, V31+, or V19+ TCRβ chains. (E–G) Quantification of V2+ (E), V31+ (F), or V19+ (G) SP thymocytes; refer to legend in D. n = 5 mice per group, one-way ANOVA followed by Dunnett’s post-tests comparing each RSS mutant to WT (B) or Tukey’s post-tests for multiple comparisons (E–G). ns, not significant; *, P < 0.05; **, P < 0.01; ****, P < 0.0001. All quantification plots show mean ± SD. Data in C and E–G are compiled from five experiments.
Figure S1.
Figure S1.
Validation of V2 and V31 RSS replacement mice. Sequence validation of the V2 or V31 RSS replacement with the 3′Dβ1 RSS. The 3′Dβ1 RSSs are highlighted in blue.
Figure S2.
Figure S2.
Normal gross αβ T cell development in V2 and V31 RSS replacement mice. (A and B) DN thymocyte development. Representative plots (A) and quantification (B) of DN cells. Gated on LinCD4CD8TCRβ thymocytes (n ≥ 5 mice per group). (C and D) Global thymocyte development. Representative plots (C) and quantification (D) of DN, DP, CD4+, and CD8+ thymocytes (n = 5 mice per group). (E and F) Representative plots (E) and quantification (F) of SP αβ T cells in the spleen. Gated on TCRβ+ cells (n = 5 mice per group). (B, D, and F) Two-way ANOVA followed by Dunnett’s post-tests for multiple comparisons. All quantification plots show mean ± SD. Data in B, D, and F are compiled from at least five experiments.
Figure S3.
Figure S3.
The 3′Dβ1 RSS replacement increases V2 and V31 recombination in DN3 thymocytes. (A) Quantification of Dβ2-Jβ2.1 rearrangements by TaqMan qPCR in DN1/2 thymocytes (n = 3 mice per group). (B and C) Quantification of indicated Vβ rearrangements by TaqMan qPCR in DN1/2 (B) or DN3 (C) thymocytes (n = 3 mice per group, two-way ANOVA followed by Bonferroni’s post-tests for multiple comparisons). These data are compiled from three experiments. N.D., not determined; *, P < 0.05; ****, P < 0.0001.
Figure S4.
Figure S4.
Peripheral αβ T cells exhibit similar shifts in the Vβ repertoire in RSS replacement mice. (A) Representative plots of SP splenocytes expressing V2+, V31+, or V19+ TCRβ chains. (B–D) Quantification of V2+ (B), V31+ (C), or V19+ (D) SP thymocytes (n = 5 mice per group, one-way ANOVA followed by Tukey’s post-tests for multiple comparisons). (E) Quantification of SP splenocytes expressing V4+, V12+, or V13+ TCRβ chains (n = 5 mice per group, two-way ANOVA followed by Tukey’s post-tests for multiple comparisons). (F) Ratio of the V2+ and V31+ Vβ repertoires. The fold change calculates the frequency of V2+ cells from V2R/R mice divided by V2R/+ mice. A similar calculation was made for V31+ cells from V31R/R and V31R/+ mice. All quantification plots show mean ± SD. Multiple post-tests are compared with WT unless indicated by bars, and P values are corrected for multiple tests. ns, not significant; **, P < 0.01; ***, P < 0.001; ****, P < 0.0001. Data in B–F are compiled from five experiments.
Figure 2.
Figure 2.
Vβ RSS replacement alleles compete with normal Tcrb alleles for usage in the TCRβ repertoire. (A and C) Representative plots of SP thymocytes expressing V2+ (A) or V31+ (C) TCRβ chains. (B and D) Quantification of V2+ (B) or V31+ (D) SP thymocytes (mean ± SD, n ≥ 3 mice per group, unpaired Student’s t test; ****, P < 0.0001). Data in B and D are compiled from three experiments.
Figure 3.
Figure 3.
3′Dβ1 RSS-replaced Vβ segments increase biallelic Tcrb gene expression. (A, C, and E) Representative plots of SP thymocytes expressing both V2+ and V19+ (A), V31+ and V19+ (C), or V2+ and V31+ (E) TCRβ chains. (B, D, and F) Quantification of SP thymocytes expressing the two indicated TCRβ chains. (F) V2R/R and V31R/R thymocytes were mixed 1:1 and analyzed. (B and D) n = 5 mice per group, two-way ANOVA followed by Dunnett’s post-tests for multiple comparisons. (F) n ≥ 3 mice per group, one-way ANOVA followed by Tukey’s post-tests for multiple comparisons. (G) Quantification of double-staining SP thymocytes for each Vβ combination tested (n = 5 mice per group, one-way ANOVA followed by Dunnett’s post-tests comparing each RSS mutant to WT). All quantification plots show mean ± SD. ns, not significant; *, P < 0.05; **, P < 0.01; ***, P < 0.001; ****, P < 0.0001. Data in B, D, F, and G are compiled from five experiments.
Figure S5.
Figure S5.
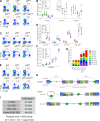
αβ T cells exhibiting biallelic Tcrb gene expression seed the periphery. (A, C, and E) Representative plots of SP splenocytes expressing both V2+ and V19+ (A), V31+ and V19+ (C), or V2+ and V31+ (E) TCRβ chains. (B, D, and F) Quantification of SP splenocytes expressing the two indicated TCRβ chains. n = 5 mice per group, two-way ANOVA followed by Tukey’s post-tests for multiple comparisons (B and D), one-way ANOVA followed by Dunnett’s post-tests comparing each RSS mutant to WT (F). (G) Quantification of double-staining SP splenocytes for each Vβ combination tested (n = 5 mice per group, two-way ANOVA). (H) Depiction of the recombination events that could result in two TCRβ chains expressed from one allele. RSSs indicated as triangles. (I) RIC scores of RSSs in this study, generated by RSSSite (https://www.itb.cnr.it/rss/). All quantification plots show mean ± SD. Multiple post-tests are compared with WT unless indicated by bars, and P values are corrected for multiple tests. ns, not significant, *, P < 0.05; **, P < 0.01; ***, P < 0.001; ****, P < 0.0001. Data in B, D, F, and G are compiled from five experiments.
Figure 4.
Figure 4.
3′Dβ1 RSS substitutions increase Vβ usage and TCRβ allelic inclusion independent of c-Fos binding. (A) Sequences of the normal and inactivated c-Fos binding site in the 3′Dβ1 RSS. The A→C and T→C mutations are indicated in red. (B) Sequence validation of the V2 or V31 RSS replacement with the variant 3′Dβ1 RSS. The inactivated c-Fos binding site is highlighted in blue and mutated nucleotides indicated by red arrows. (C) Representative plots of SP thymocytes expressing V2+ or V31+ TCRβ chains. (D and E) Quantification of V2+ (D) or V31+ (E) SP thymocytes (n ≥ 5 mice per group, one-way ANOVA followed by Tukey’s post-tests for multiple comparisons). (F) Representative plots of SP thymocytes expressing both V2+ and V31+ TCRβ chains. (G) Quantification of SP thymocytes expressing both V2+ and V31+ TCRβ chains (n ≥ 5 mice per group, one-way ANOVA followed by Dunnett’s post-tests comparing each RSS mutant to WT). All quantification plots show mean ± SD. ns, not significant; *, P < 0.05; ***, P < 0.001; ****, P < 0.0001. Data in D, E, and G are compiled from three experiments.
Figure 5.
Figure 5.
3′Dβ1 RSS substitutions increase Vβ recombination before enforcement of feedback inhibition. (A and C) Representative plots of SP thymocytes expressing V2+ (A), V31+ (C), or V13+ TCRβ chains. (B and D) Quantification of SP thymocytes expressing V2+ (B) or V31+ (D) TCRβ chains (n = 3 mice per group, unpaired Student’s t test; ****, P < 0.0001). All quantification plots show mean ± SD. Data in B and D are compiled from three experiments.

Comment in

  • RSSs set the odds for exclusion.
    Krangel MS. Krangel MS. J Exp Med. 2020 Sep 7;217(9):e20200831. doi: 10.1084/jem.20200831. J Exp Med. 2020. PMID: 32793983 Free PMC article.

References

    1. Agata Y., Tamaki N., Sakamoto S., Ikawa T., Masuda K., Kawamoto H., and Murre C.. 2007. Regulation of T cell receptor beta gene rearrangements and allelic exclusion by the helix-loop-helix protein, E47. Immunity. 27:871–884. 10.1016/j.immuni.2007.11.015 - DOI - PubMed
    1. Akira S., Okazaki K., and Sakano H.. 1987. Two pairs of recombination signals are sufficient to cause immunoglobulin V-(D)-J joining. Science. 238:1134–1138. 10.1126/science.3120312 - DOI - PubMed
    1. Banerjee J.K., and Schatz D.G.. 2014. Synapsis alters RAG-mediated nicking at Tcrb recombination signal sequences: implications for the “beyond 12/23” rule. Mol. Cell. Biol. 34:2566–2580. 10.1128/MCB.00411-14 - DOI - PMC - PubMed
    1. Bassing C.H., Alt F.W., Hughes M.M., D’Auteuil M., Wehrly T.D., Woodman B.B., Gärtner F., White J.M., Davidson L., and Sleckman B.P.. 2000. Recombination signal sequences restrict chromosomal V(D)J recombination beyond the 12/23 rule. Nature. 405:583–586. 10.1038/35014635 - DOI - PubMed
    1. Bassing C.H., Swat W., and Alt F.W.. 2002. The mechanism and regulation of chromosomal V(D)J recombination. Cell. 109(2, Suppl):S45–S55. 10.1016/S0092-8674(02)00675-X - DOI - PubMed

Publication types

Substances