. 2020 Jun 9;9(6):1796.
doi: 10.3390/jcm9061796.

Alterations in the Gut Microbiome and Suppression of Histone Deacetylases by Resveratrol Are Associated with Attenuation of Colonic Inflammation and Protection Against Colorectal Cancer

Affiliations

Alterations in the Gut Microbiome and Suppression of Histone Deacetylases by Resveratrol Are Associated with Attenuation of Colonic Inflammation and Protection Against Colorectal Cancer

Haider Rasheed Alrafas et al. J Clin Med. .

Abstract

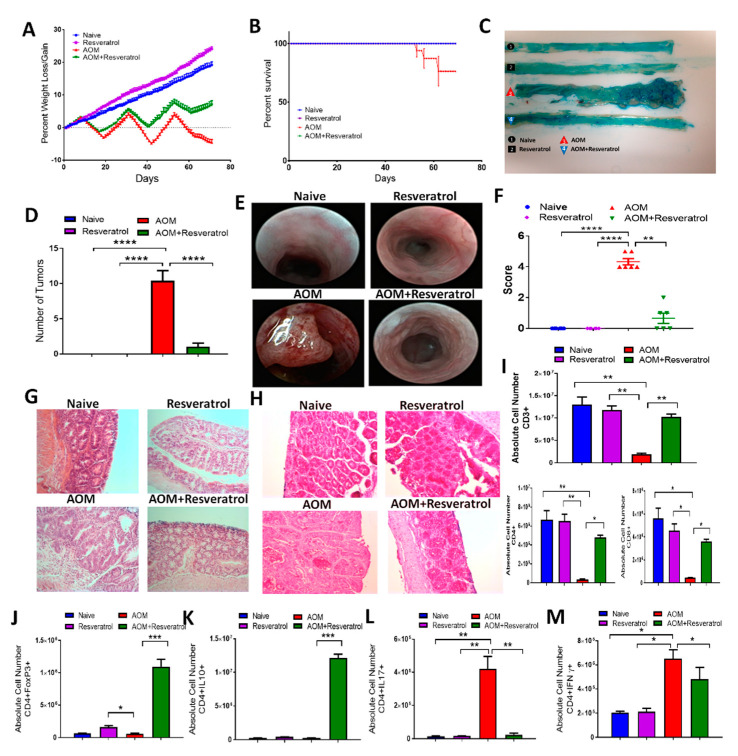
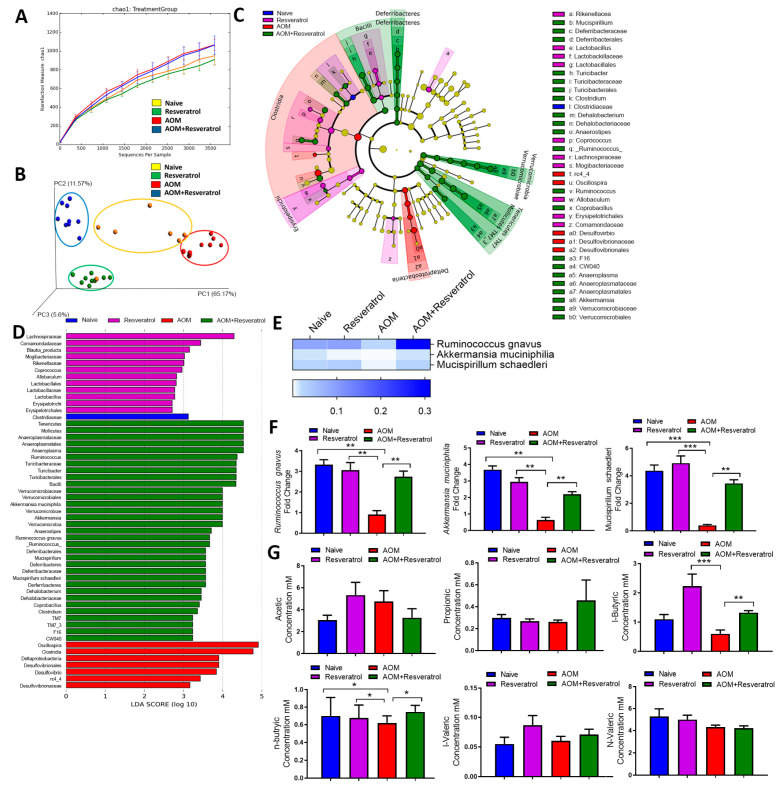
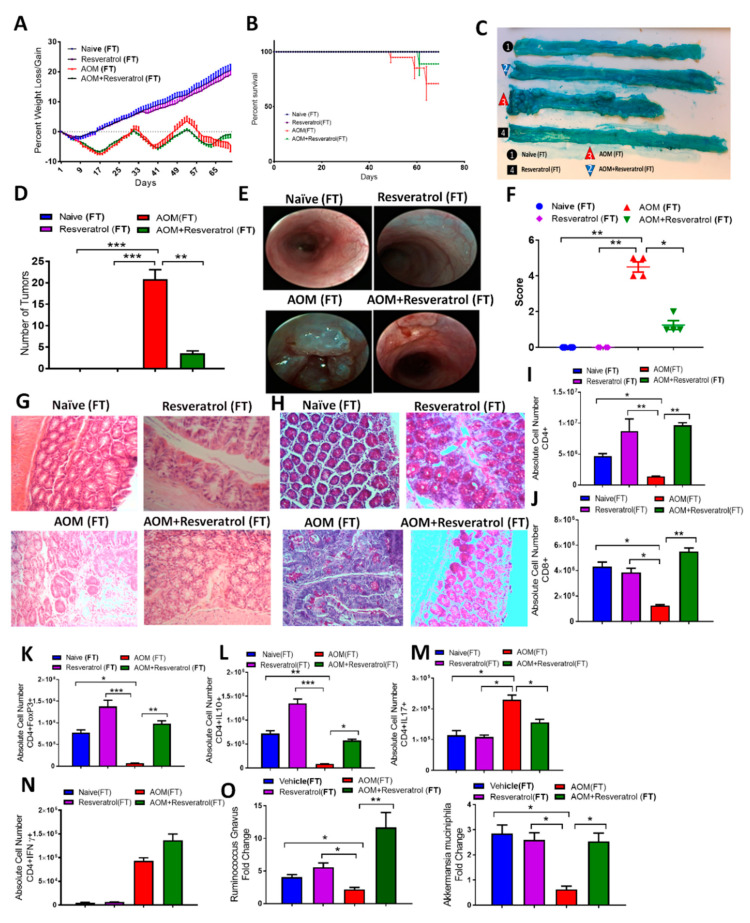
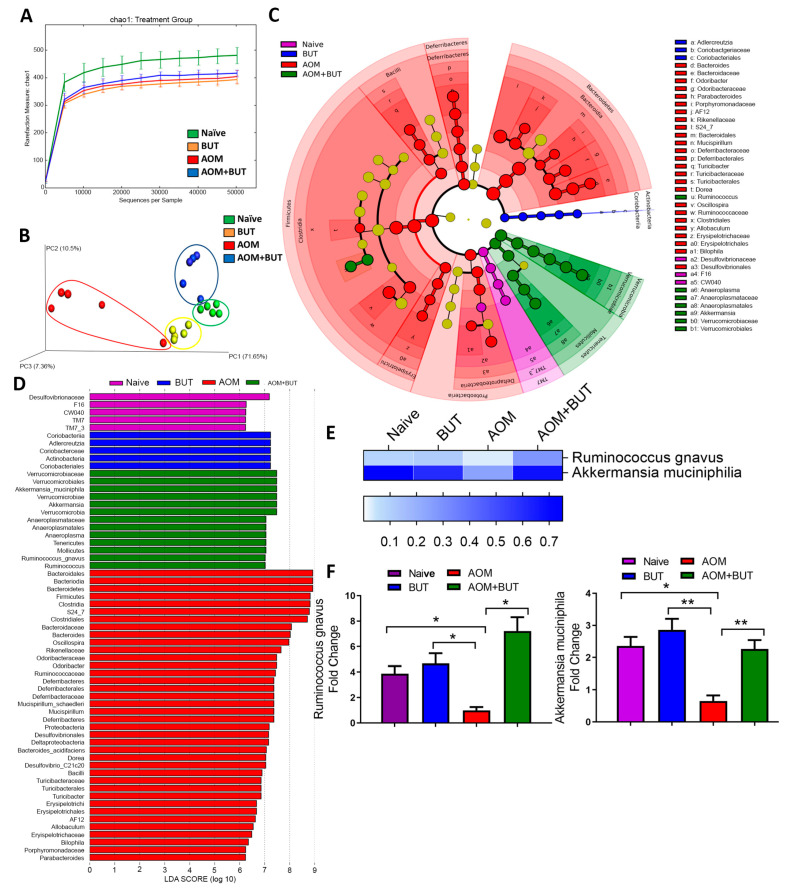
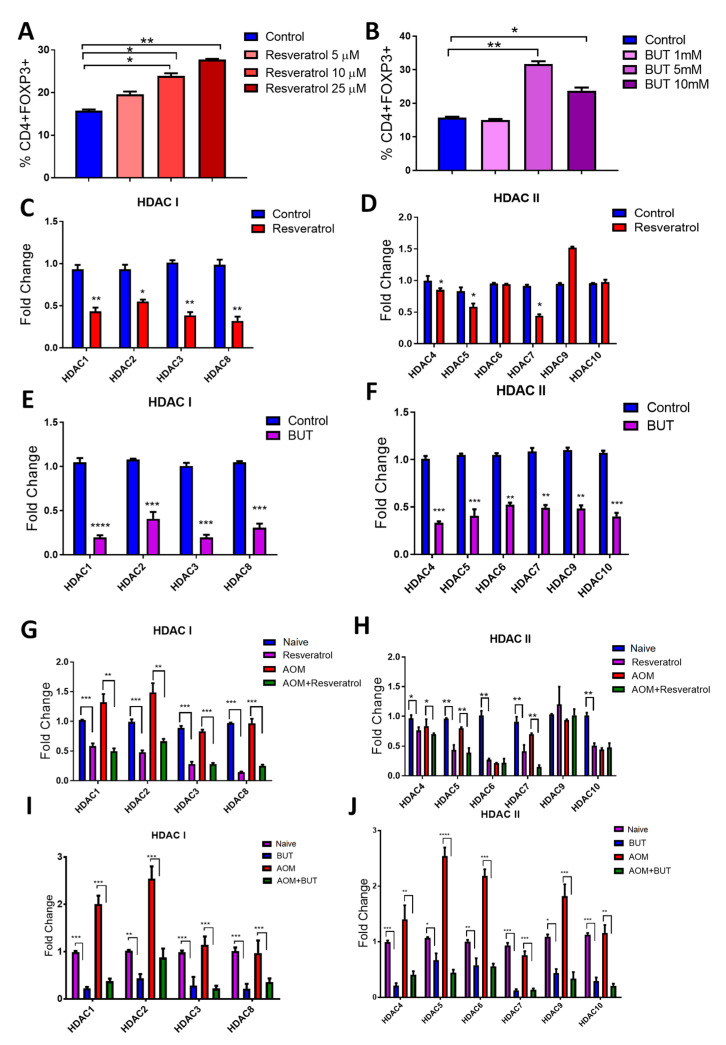
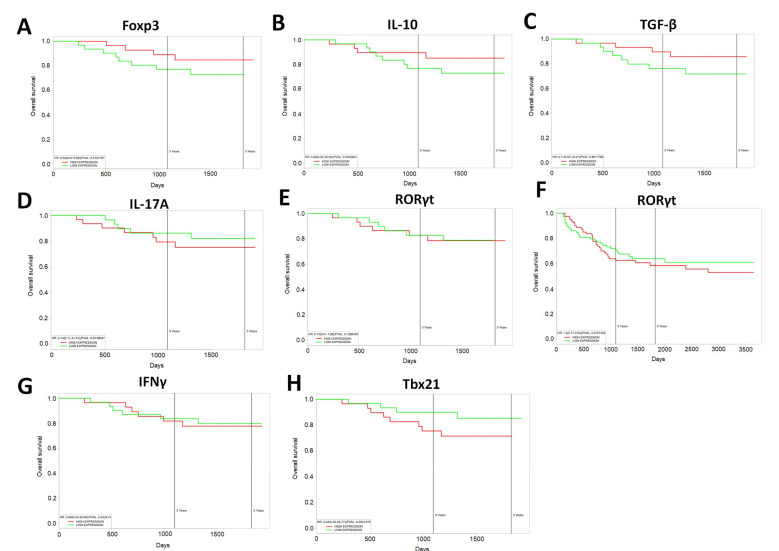
Inflammatory bowel disease (IBD) is known to significantly increase the risk for development of colorectal cancer (CRC), suggesting inflammation and cancer development are closely intertwined. Thus, agents that suppress inflammation may prevent the onset of cancer. In the current study, we used resveratrol, an anti-inflammatory stilbenoid, to study the role of microbiota in preventing inflammation-driven CRC. Resveratrol treatment in the azoxymethane (AOM) and dextran sodium sulphate (DSS) CRC murine model caused an increase in anti-inflammatory CD4 + FOXP3 + (Tregs) and CD4 + IL10 + cells, a decrease in proinflammatory Th1 and Th17 cells, and attenuated CRC development. Gut microbial profile studies demonstrated that resveratrol altered the gut microbiome and short chain fatty acid (SCFA), with modest increases in n-butyric acid and a potential butyrate precursor isobutyric acid. Fecal transfer from resveratrol-treated CRC mice and butyrate supplementation resulted in attenuation of disease and suppression of the inflammatory T cell response. Data also revealed both resveratrol and sodium butyrate (BUT) were capable of inhibiting histone deacetylases (HDACs), correlating with Treg induction. Analysis of The Cancer Genome Atlas (TCGA) datasets revealed increased expression of Treg-specific transcription factor FoxP3 or anti-inflammatory IL-10 resulted in an increase in 5-year survival of patients with CRC. These data suggest that alterations in the gut microbiome lead to an anti-inflammatory T cell response, leading to attenuation of inflammation-driven CRC.

Keywords: T regulatory cells; T-helper cells; azoxymethane; butyrate; colorectal cancer; dextran sodium sulfate; fecal transfer; histone deacetylase; microbiome; resveratrol.


Conflict of interest statement

The authors declare no conflict of interest. The funders had no role in the design of the study; in the collection, analyses, or interpretation of data; in the writing of the manuscript; or in the decision to publish the results.

Figures

Figure 1
Figure 1
Treatment with resveratrol reduces clinical symptoms and alters T cell phenotype in azoxymethane (AOM)-induced colorectal cancer (CRC) model. C57BL/6 mice were injected intraperitoneal with 10 mg of AOM followed by 3 cycles of 2% DSS, to induce CRC. Experimental groups consisted of: Naïve (n = 6), Resveratrol (n = 6), AOM (n = 6), and AOM+Resveratrol (n = 6). Clinical parameters consisted of percent weight loss (A) and survival (B). (C) Representative colons stained with 1% Alcian blue. (D) Bar graph depicting number of tumors counted in each experimental group. (E) Representative colonoscopic images from experimental groups. (F) Bar graph depicting scores after examination of tumor polyps detected during colonoscopies. (G) Representative colon sections stained with H&E; scale bar = 100 µM at 40x objective. (H) Representative colon sections with PAS staining; scale bar = 100 µM at 40x objective. (I) Bar graphs depicting absolute cell numbers in mesenteric lymph node (MLN) for all T cells (CD3+), T helper (CD3+CD4+), and cytotoxic (CD3+CD8+) T cells. (JM) Bar graphs depicting absolute cell numbers in MLN for Tregs (J), Th cells producing IL-10 (K), Th17 (L), and Th1 (M) cells. Significance (p-value: * p < 0.05, ** p < 0.01, *** p < 0.005, **** p < 0.001) was determined by using one-way ANOVA and post-hoc Tukey’s test for bar/dot graphs, Mann–Whitney test for weight data, and log rank test for survival curve. Data are representative of at least 3 independent experiments.
Figure 2
Figure 2
16S rRNA sequencing analysis during AOM-induced CRC treated with resveratrol. The study was designed as described in Figure 1 legend. Gut microbiome samples were collected from experimental groups by performing colonic flushes in experimental groups, which were the following: Naïve (n = 7), Resveratrol (n = 9), AOM (n = 10), and AOM+Resveratrol (n = 9). Nephele analysis (nephele.niaid.nih.gov) was used to generate charts for chao1 alpha diversity (A) and PCA beta diversity (B). LeFSe analysis of the Nephele OTU output files generated the cladogram (C) and LDA score bar graph (D). (E) Heatmap and legend depicting mean OTU percent abundances of significantly altered species Ruminococcus gnavus, Akkermansia muciniphila, and Mucispirillum schaedleri. Rows represent bacterial species and columns represent the mean OTU percentages of experimental groups with SEM. (F) PCR validation of Ruminococcus gnavus, Akkermansia muciniphila, and Mucispirillum schaedleri. (G) Bar graphs representing concentration of SCFAs acetic acid, propionic acid, i-butyric acid, n-butyric acid, i-valeric acid, and n-valeric acid. Significance (p-value: * p < 0.05, ** p < 0.01, *** p < 0.005) was determined by using one-way ANOVA followed by Tukey’s post-hoc multiple comparisons test for depicted bar graphs. Experiments are representative of 3 independent experiments.
Figure 3
Figure 3
Results from fecal transfer (FT) experiments in AOM-induced CRC model. Antibiotic-treated C57BL/6 mice were injected i.p. with 10 mg of AOM to induce colorectal cancer followed by 3 cycles of 2% DSS. Fecal material was inoculated into recipient mice from the following donors: Naïve (n = 4), Resveratrol (n = 4), AOM (n = 4), and AOM+Resveratrol (n = 4). Clinical parameters consisted of percent weight loss (A) and survival (B), both of which were found to have significant differences in AOM (FT) vs. AOM + Resveratrol (FT) groups. (C) Representative colons stained with 1% Alcian blue. (D) Bar graph depicting number of tumors counted in each experimental group. (E) Representative colonoscope images from experimental groups. (F) Bar graph depicting scores after examination of tumor polyps detected during colonoscopies. (G) Representative colon sections stained with H&E; scale bar = 100 µM at 40x objective. (H) Representative colon sections that underwent PAS staining; scale bar = 100 µM at 40x objective. (I,J) Bar graphs depicting absolute cell numbers in MLN for general T cells T helper (I) and cytotoxic (J) T cells. (KN) Bar graphs depicting absolute cell numbers in MLN for Tregs (K), Th cells producing IL-10 (L), Th17 (M), and Th1 (N) cells. (O) PCR validation for the bacterial species Ruminococcus gnavus and Akkermansia muciniphila. Significance (p-value: * p < 0.05, ** p < 0.01, *** p < 0.005) was determined by using one-way ANOVA and post-hoc Tukey’s test for bar/dot graphs, Mann–Whitney test for weight data, and log rank test for survival curve. Data are representative of at least 3 independent experiments.
Figure 4
Figure 4
Treatment with sodium butyrate (BUT) reduces clinical symptoms and alters T cell phenotype in AOM-induced CRC model. Female C57BL/6 mice were injected intraperitoneal with 10 mg of AOM to induce colorectal cancer followed by 3 cycles of 2% DSS. Experimental groups consisted of: Naïve (n = 4), BUT (n = 4), AOM (n = 4), and AOM + BUT (n = 4). Clinical parameters consisted of percent weight loss (A) and survival (B), both of which were found to have significant differences in AOM vs. AOM + Resveratrol groups. (C) Representative colons stained with 1% Alcian blue. (D) Bar graph depicting number of tumors counted in each experimental group. (E) Representative colonoscopic images from experimental groups. (F) Bar graph depicting scores after examination of tumor polyps detected during colonoscopies. (G) Representative colon sections stained with H&E; scale bar = 100 µM at 40x objective. (H) Representative colon sections, which underwent PAS staining; scale bar = 100 µM at 40x objective. (I) Bar graphs depicting absolute cell numbers in MLN for general T cells (CD3+), T helper (CD3+CD4+), and cytotoxic (CD3+CD8+) T cells. (JM) Bar graphs depicting absolute cell numbers in MLN for Tregs (J), Th cells producing IL-10 (K), Th17 (L), and Th1 (M) cells. Significance (p-value: * p < 0.05, ** p < 0.01, *** p < 0.005, **** p < 0.001) was determined by using one-way ANOVA and post-hoc Tukey’s test for bar/dot graphs, Mann–Whitney test for weight data, and log rank test for survival curve. Data are representative of at least 3 independent experiments.
Figure 5
Figure 5
AOM induction and treatment with BUT were performed as described in Figure 4 legend. Gut microbiota samples were collected from experimental groups by performing colonic flushes in experimental groups, which were the following: Naïve (n = 5), BUT (n = 5), AOM (n = 5), and AOM + BUT (n = 5). Nephele analysis (nephele.niaid.nih.gov) was used to generate charts for chao1 alpha diversity (A) and PCA beta diversity (B). LeFSe analysis of the Nephele OTU output files generated the cladogram (C) and LDA score bar graph (D). (E) Heatmap and legend depicting mean OTU percent abundances of significantly altered species Ruminococcus gnavus and Akkermansia muciniphila. Rows represent bacterial species and columns represent the mean OTU percentages of experimental groups with SEM. (F) PCR validation of Ruminococcus gnavus and Akkermansia muciniphila. Significance (p-value: * p < 0.05, ** p < 0.01) was determined by using one-way ANOVA followed by Tukey’s post-hoc multiple comparisons test for depicted bar graphs. Experiments are representative of 3 independent experiments.
Figure 6
Figure 6
Treatment with Resveratrol and BUT leads to HDAC suppression. Whole splenocytes (seeded at 1 × 10⁶ cells/mL) from 8–10 week old C57BL/6 mice were activated using CD3 (0.5µg/mL) and CD28 (2 µg/mL) in the absence or presence of appropriate vehicle control, resveratrol (5, 10, or 25 µM), or BUT (1, 5, or 10 mM). Tregs were identified by flow cytometry as represented in Figure S17. (A) Treg percentages after treatment with various doses of resveratrol. (B) Treg percentages after treatment with varying doses of BUT. Fold change expression as assessed by PCR for HDAC I (C) and HDAC II (D) after treatment with resveratrol (25 µM). Fold change expression as assessed by PCR for HDAC I (E) and HDAC II (F) after treatment with BUT (5 mM). Expression of HDAC I (G) and HDAC II (H) was evaluated from MLNs isolated from experimental groups (Naive, Resveratrol, AOM, and AOM+Resveratrol). Expression of HDAC I (I) and HDAC II (J) was evaluated from MLNs isolated from experimental groups (Naive, BUT, AOM, and AOM+BUT). For in vitro experiments, each group consisted of 3 wells (n = 3), and the data are representative of 2 independent experiments. For in vivo experiments, each group consisted of 5 mice (n = 5), and the data is representative of at least 3 independent experiments. Significance (p-value: * p < 0.05, ** p < 0.01, *** p < 0.005, **** p < 0.001) was determined by using one-way ANOVA followed by Tukey’s post-hoc multiple comparisons test for depicted bar graphs.
Figure 7
Figure 7
TCGA datasets for colorectal cancer from The Cancer genome Atlas (TCGA, https://cancergenome.nih.gov/) were used to correlate gene expression with patient survival over a 5-year period or more. Correlations to patient survival were performed based on the following gene expressions: (A) FoxP3, (B) IL-10, (C) TGF-β, (D) IL-17A, (E) ROR-γt, (F) ROR-γt (past five year interval), (G) IFN-γ, and (H) Tbx21. Kaplan–Meier survival curves, defined as the probability of survival in a given length of time while considering time in many small intervals, were used to generate survival curves plots.

References

    1. Fitzmaurice C., Dicker D., Pain A., Hamavid H., Moradi-Lakeh M., MacIntyre M.F., Allen C., Hansen G., Woodbrook R., Wolfe C., et al. The Global Burden of Cancer 2013. JAMA Oncol. 2015;1:505–527. doi: 10.1001/jamaoncol.2015.0735. - DOI - PMC - PubMed
    1. Edwards B.K., Noone A.-M., Mariotto A.B., Simard E.P., Boscoe F.P., Henley S.J., Jemal A., Cho H., Anderson R.N., Kohler B.A., et al. Annual Report to the Nation on the status of cancer, 1975–2010, featuring prevalence of comorbidity and impact on survival among persons with lung, colorectal, breast, or prostate cancer. Cancer. 2013;120:1290–1314. doi: 10.1002/cncr.28509. - DOI - PMC - PubMed
    1. Pittman M.E. Fecal Microbiota and Screening for Colorectal Cancer. Clin. Chem. 2018;64:1273–1274. doi: 10.1373/clinchem.2018.292433. - DOI - PubMed
    1. Bose D., Zimmerman L.J., Pierobon M., Petricoin E., Tozzi F., Parikh A., Fan F., Dallas N., Xia L., Gaur P., et al. Chemoresistant colorectal cancer cells and cancer stem cells mediate growth and survival of bystander cells. Br. J. Cancer. 2011;105:1759–1767. doi: 10.1038/bjc.2011.449. - DOI - PMC - PubMed
    1. Lopez A., Pouillon L., Beaugerie L., Danese S., Peyrin-Biroulet L. Colorectal cancer prevention in patients with ulcerative colitis. Best Pr. Res. Clin. Gastroenterol. 2018:103–109. doi: 10.1016/j.bpg.2018.05.010. - DOI - PubMed