. 2020 Jun 12;368(6496):1205-1210.
doi: 10.1126/science.aay7794.

Membrane-proximal F-actin restricts local membrane protrusions and directs cell migration

Affiliations

Membrane-proximal F-actin restricts local membrane protrusions and directs cell migration

Anjali Bisaria et al. Science. .

Abstract

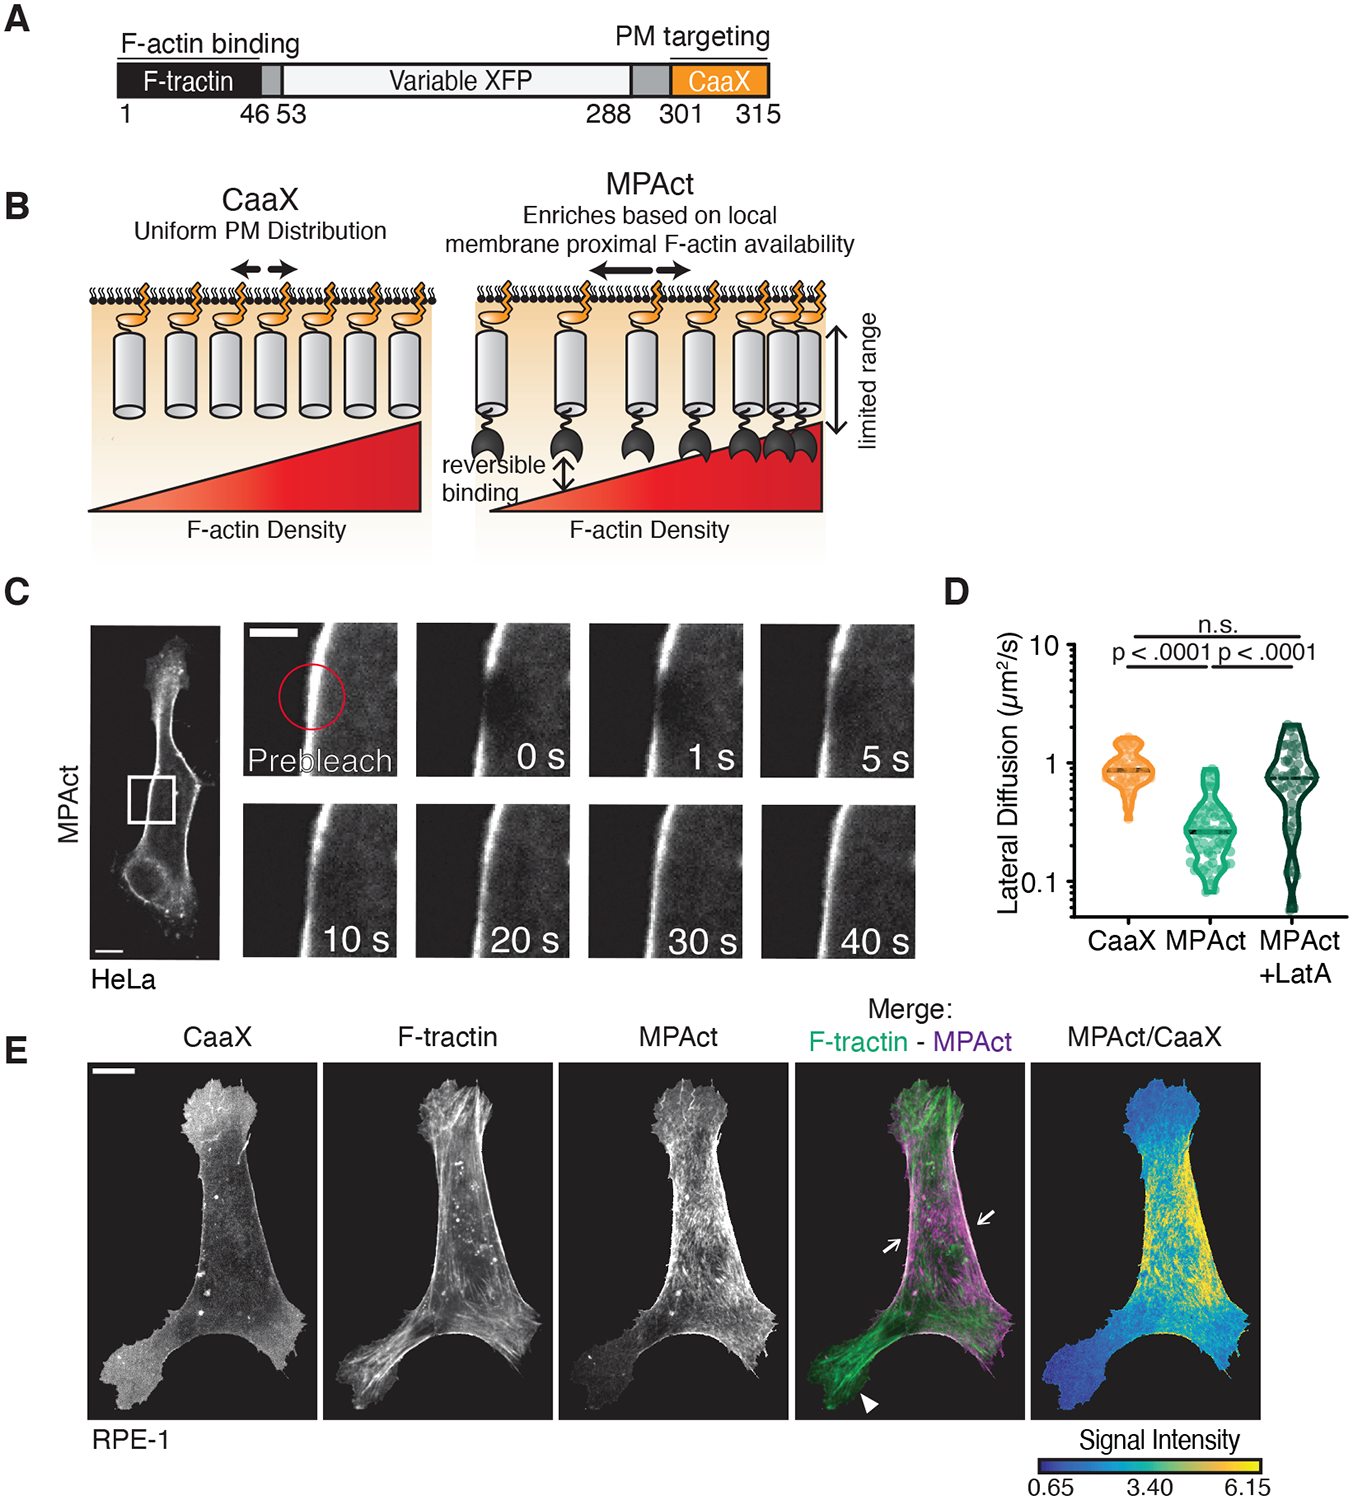
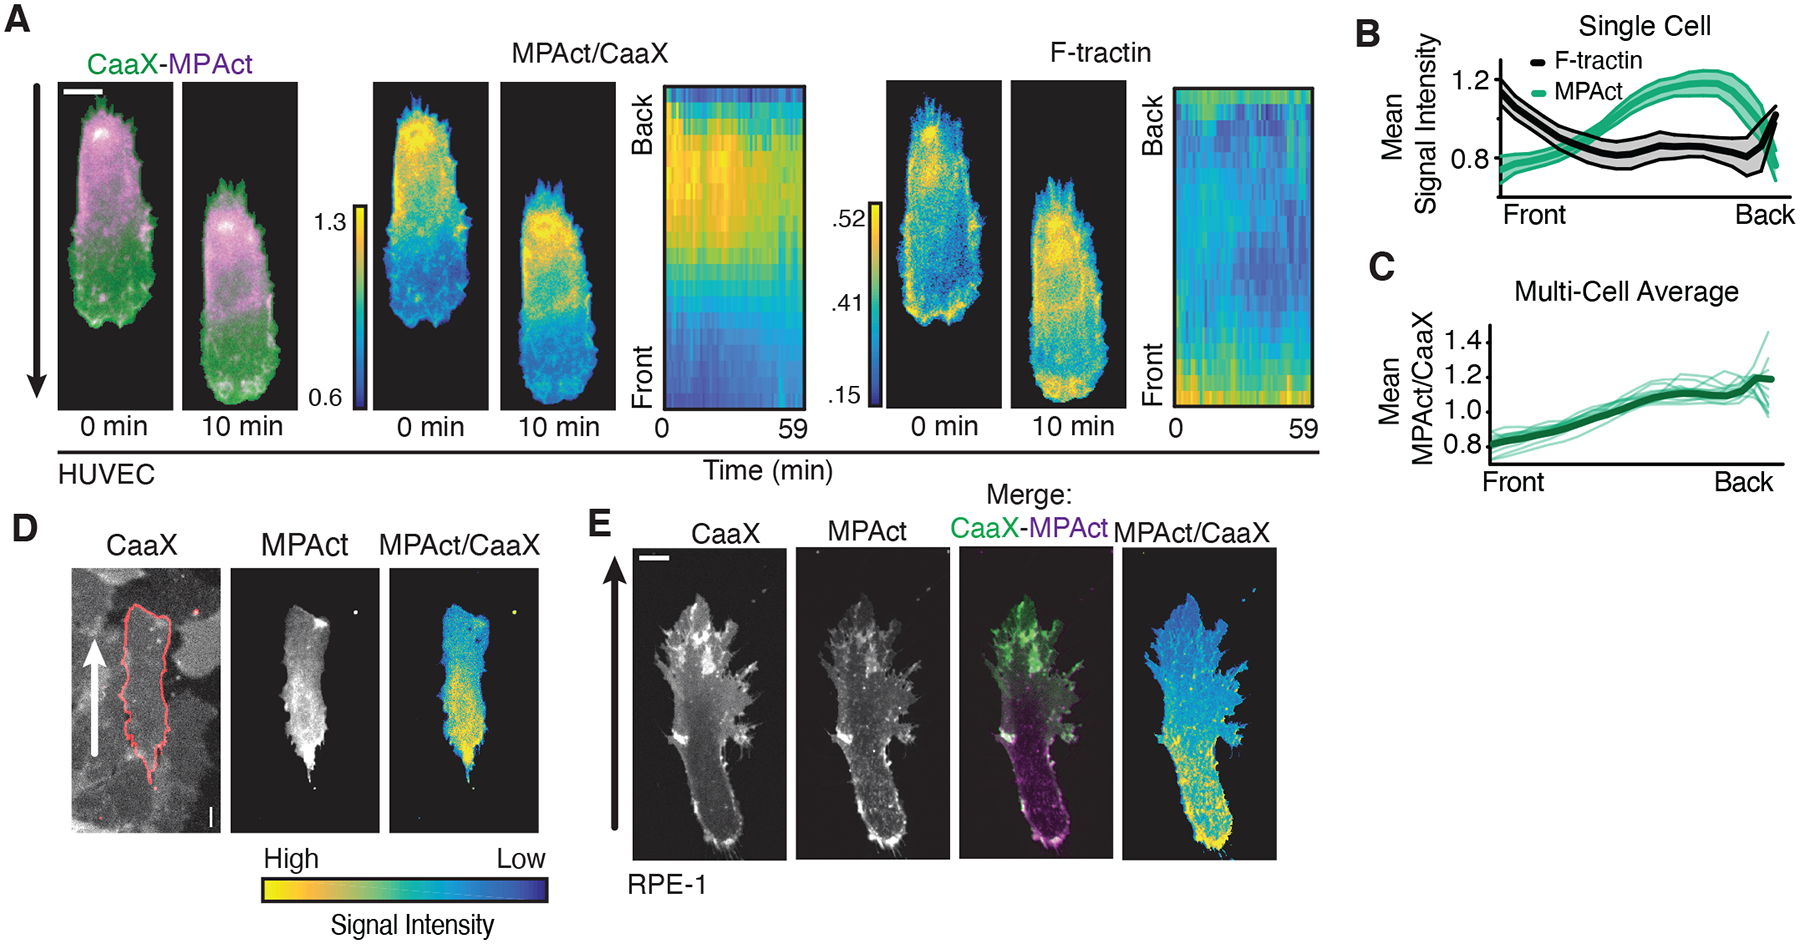
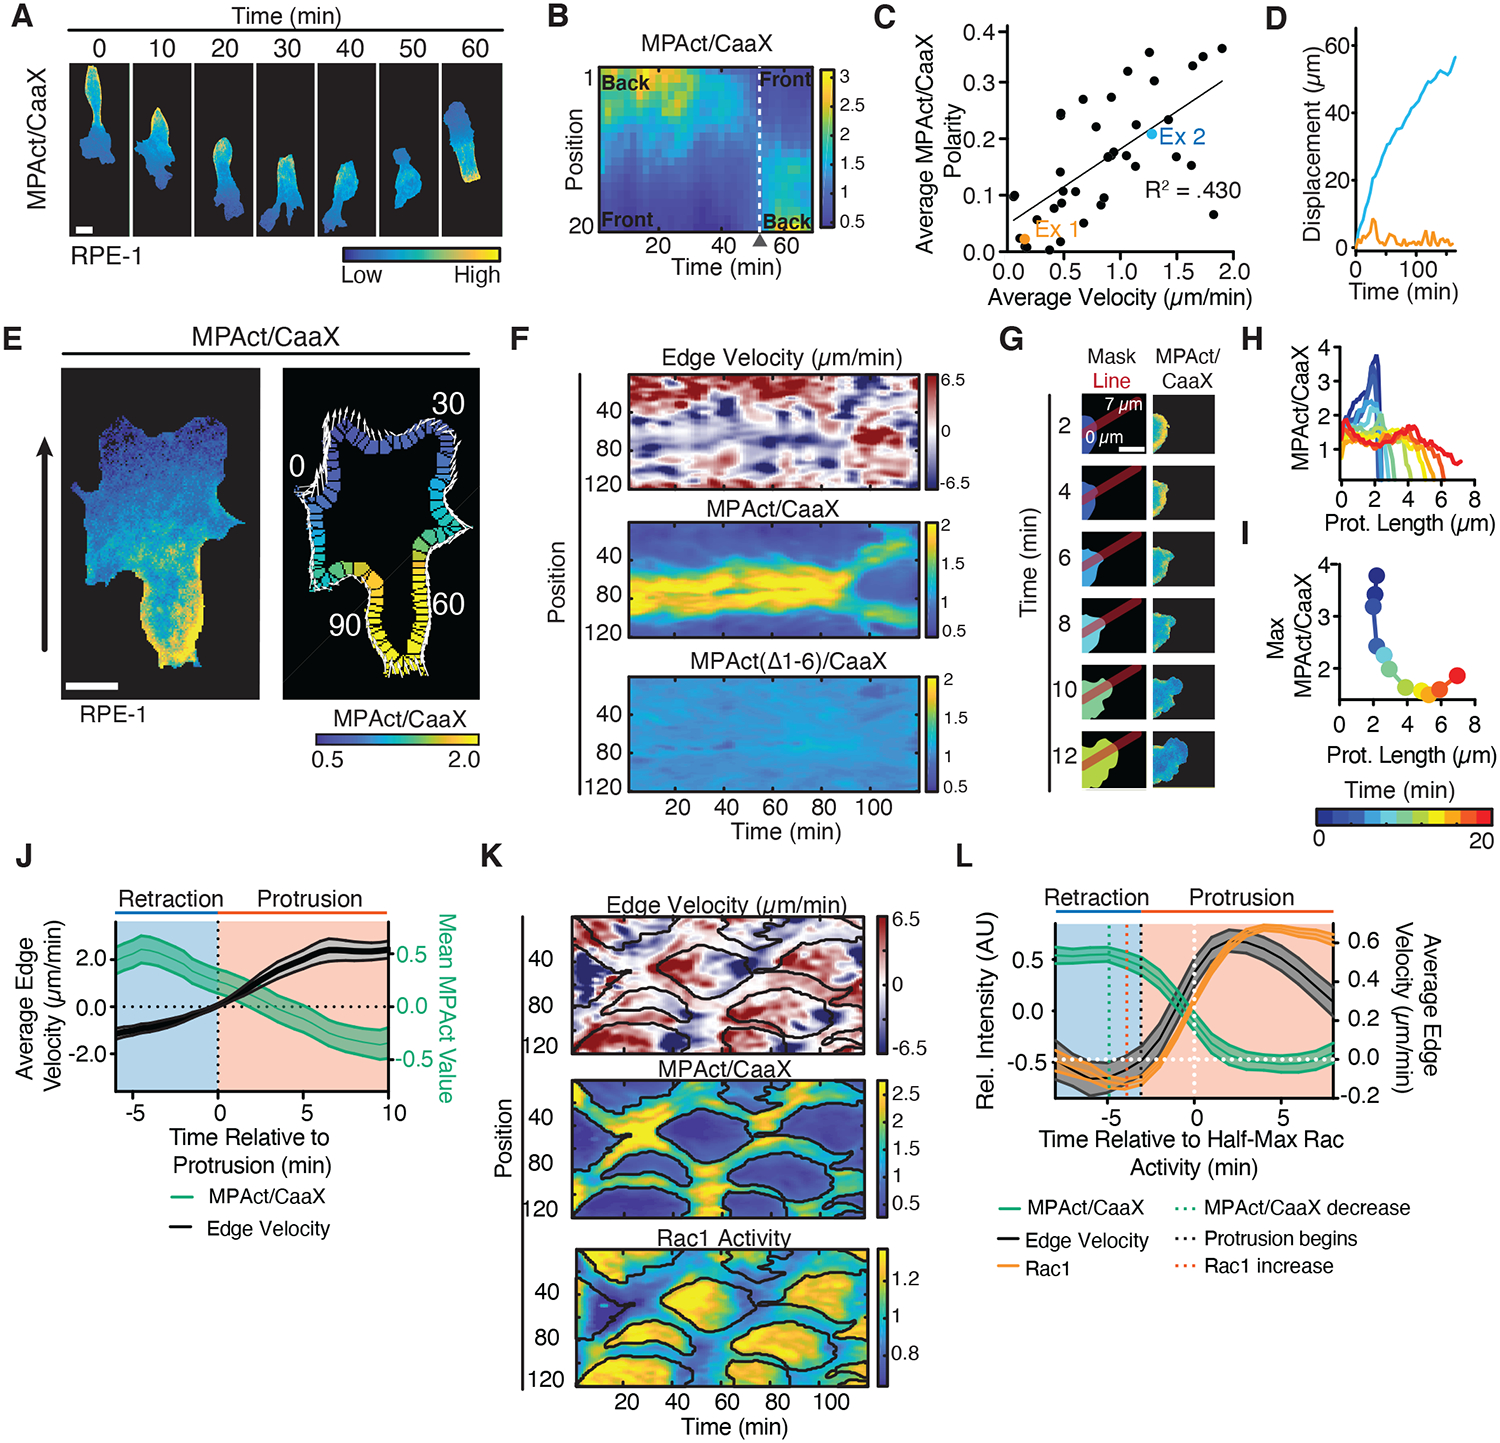
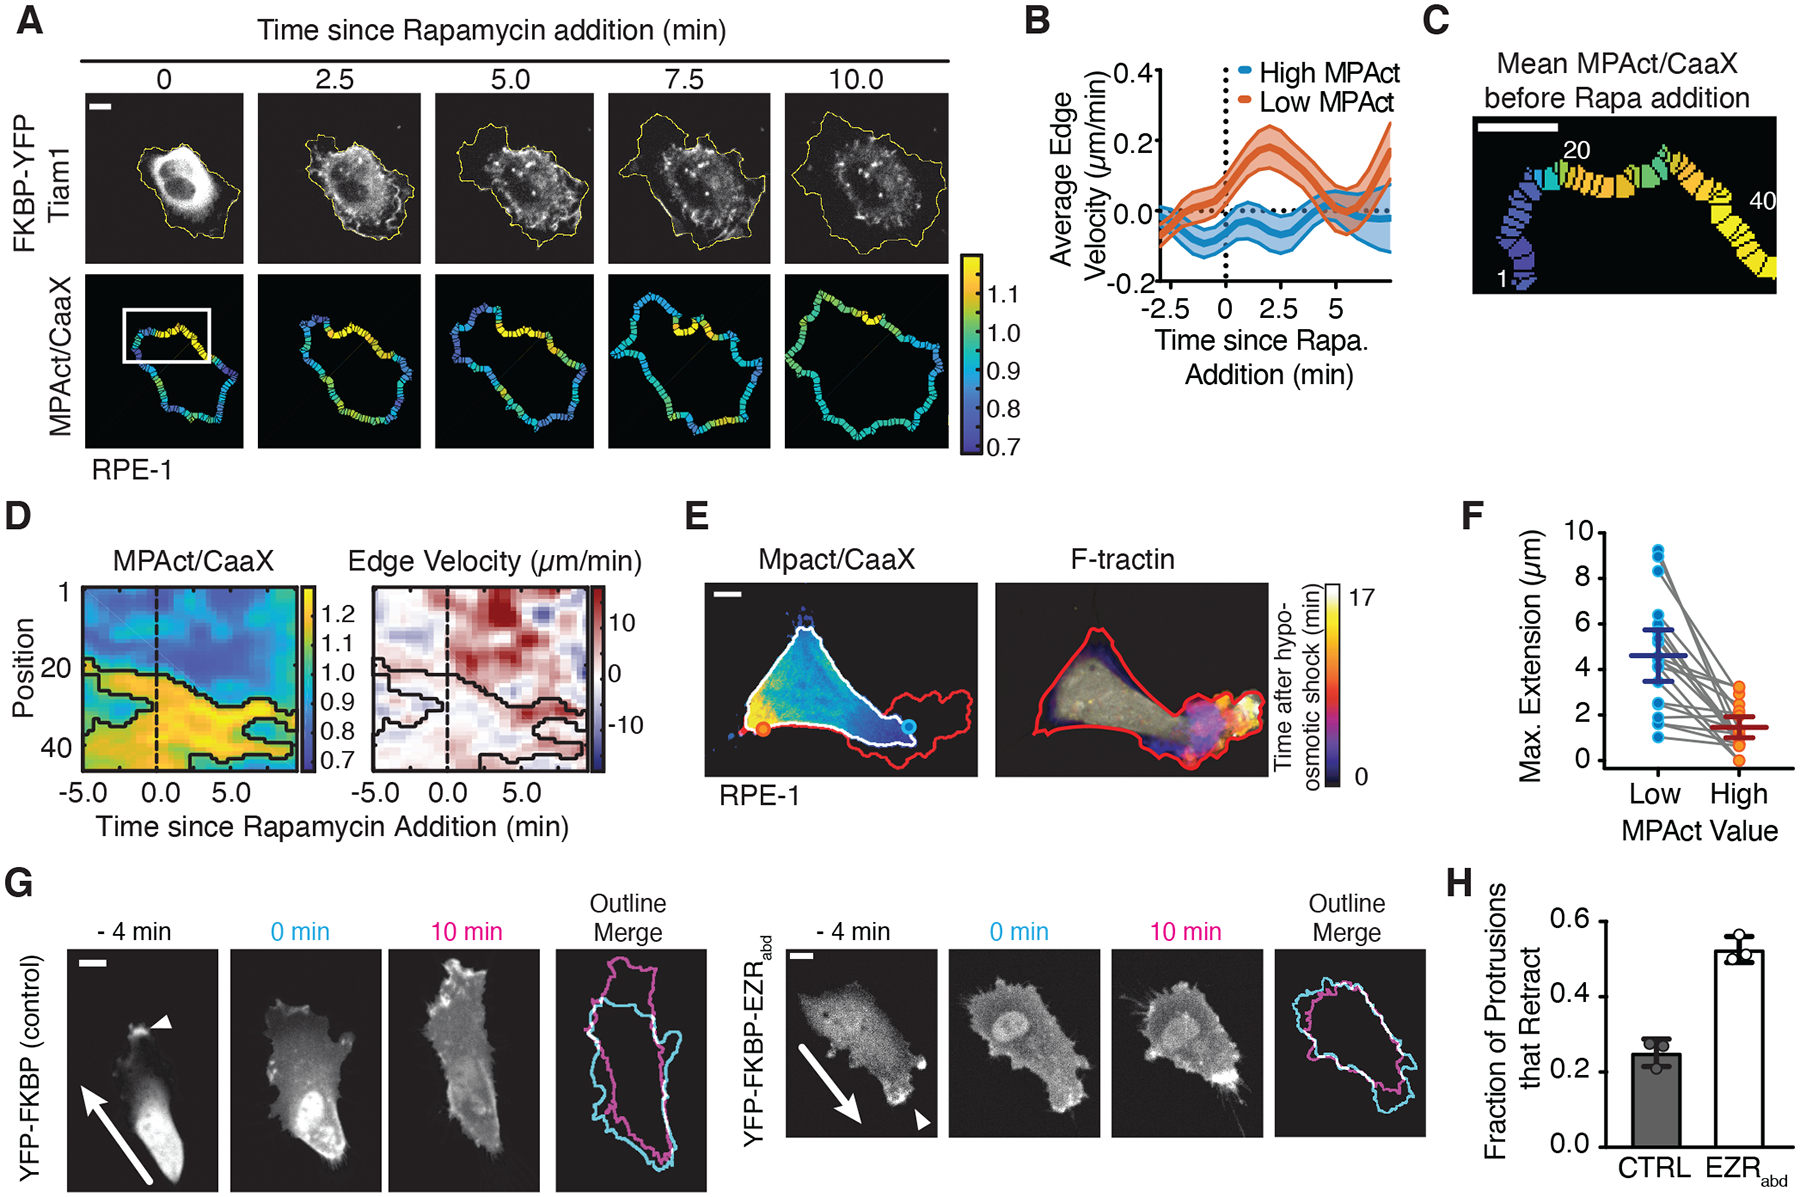
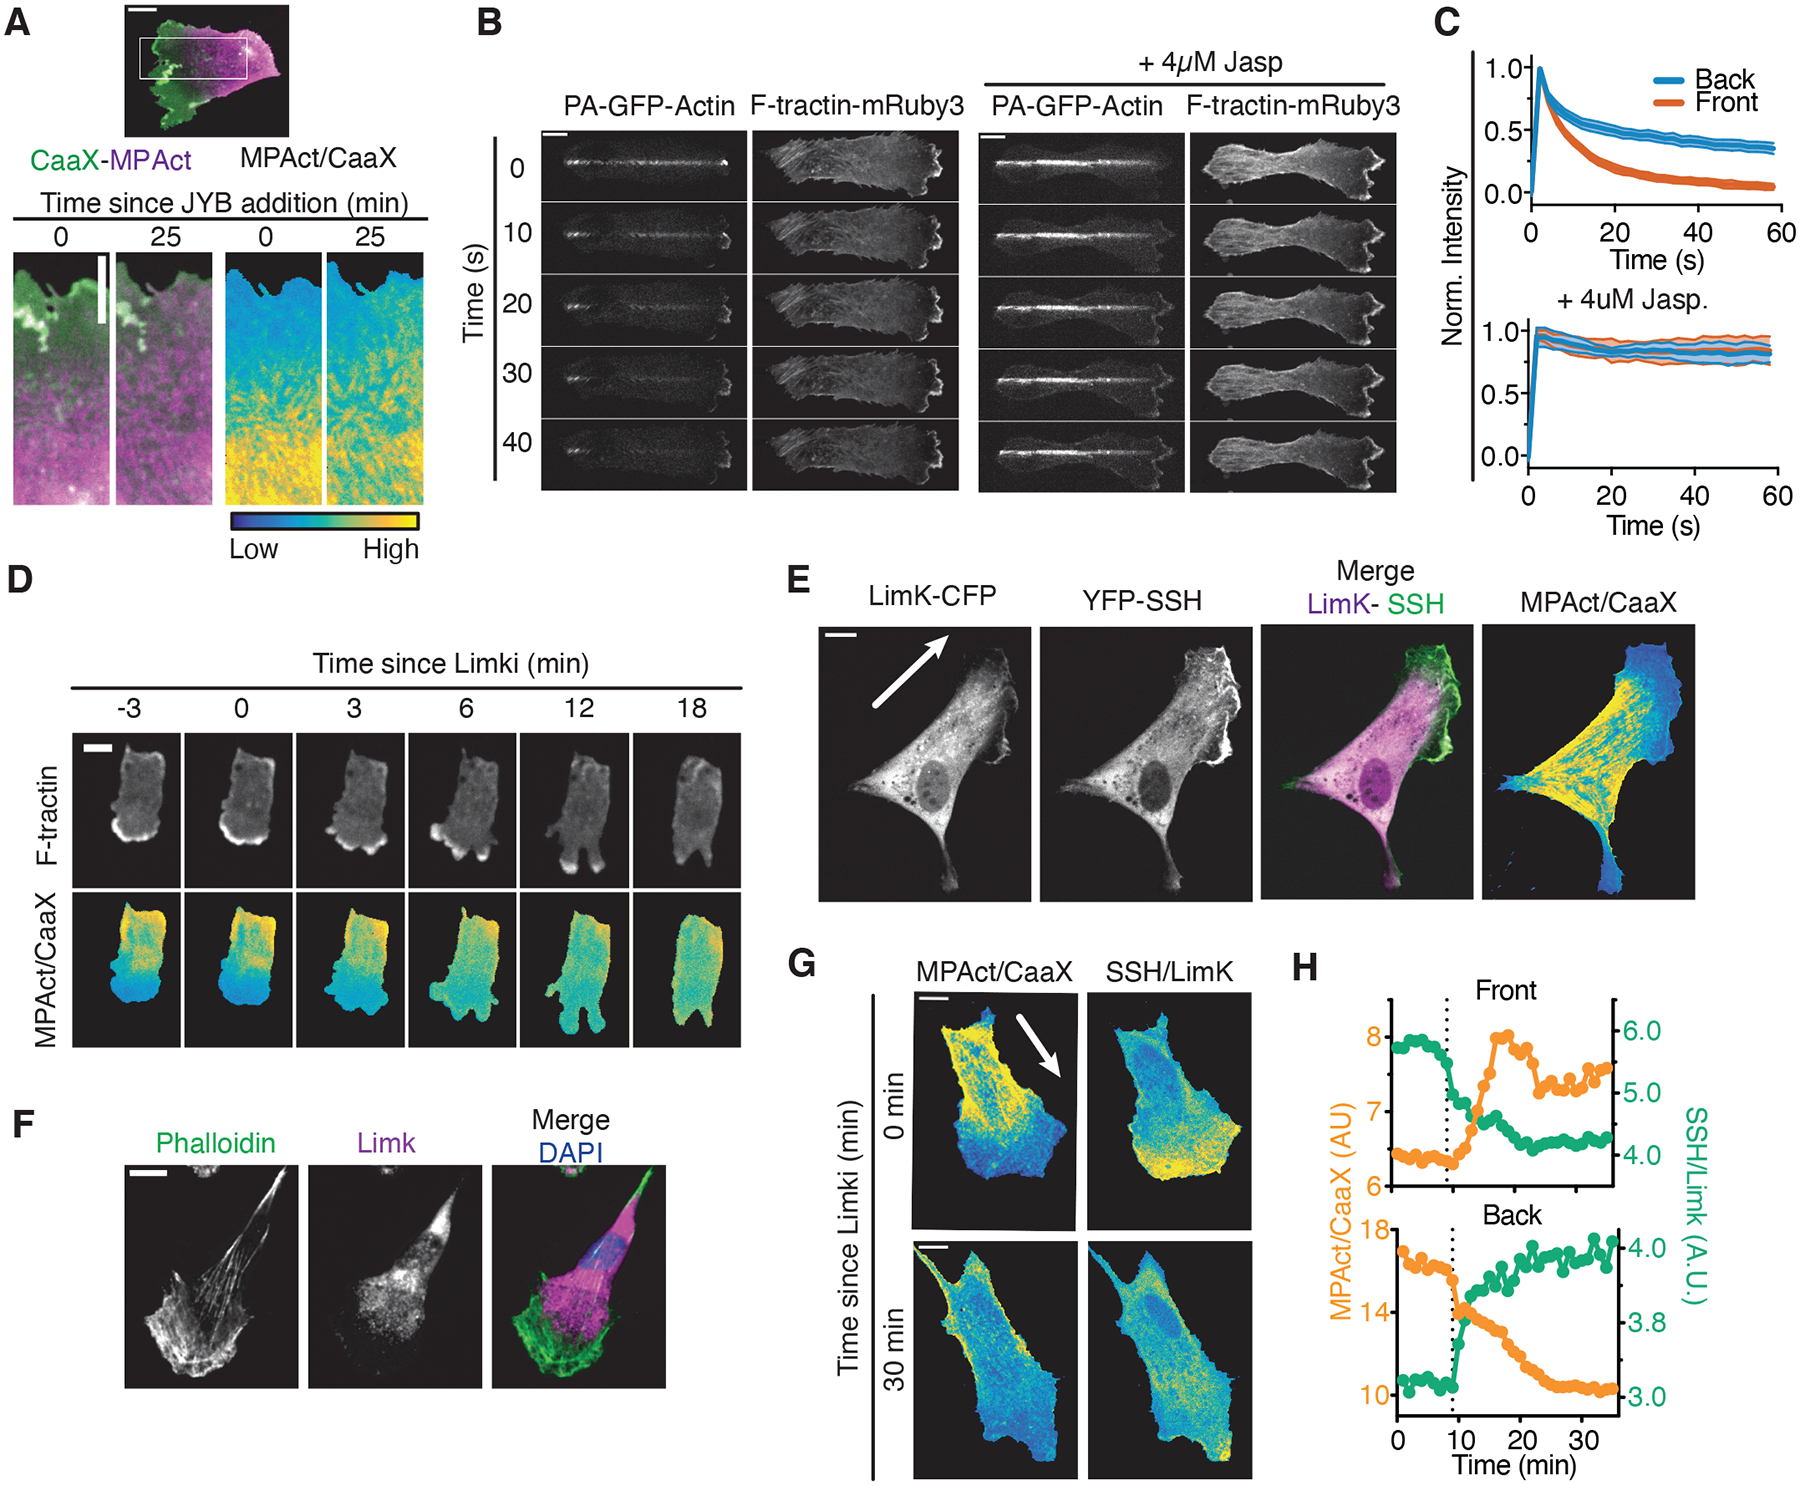
Cell migration is driven by local membrane protrusion through directed polymerization of F-actin at the front. However, F-actin next to the plasma membrane also tethers the membrane and thus resists outgoing protrusions. Here, we developed a fluorescent reporter to monitor changes in the density of membrane-proximal F-actin (MPA) during membrane protrusion and cell migration. Unlike the total F-actin concentration, which was high in the front of migrating cells, MPA density was low in the front and high in the back. Back-to-front MPA density gradients were controlled by higher cofilin-mediated turnover of F-actin in the front. Furthermore, nascent membrane protrusions selectively extended outward from areas where MPA density was reduced. Thus, locally low MPA density directs local membrane protrusions and stabilizes cell polarization during cell migration.


Conflict of interest statement

Competing interests: Authors declare no competing interests.

Figures

Fig. 1
Fig. 1. Development of a fluorescent reporter that measures the local density of membrane-proximal F-actin.
(A) Design of a membrane-proximal actin density (MPAct) reporter. (B) Ratiometric analysis of MPA density. MPAct signal normalized by CaaX PM marker. (C) FRAP analysis of lateral membranes of RPE-1 cells expressing MPAct-mCitrine. Scale bar = 5 μm. (D) Diffusion coefficients calculated from FRAP experiments in RPE-1 with and without 1 μM LatA. N =52, 69, 54 respectively, 2 independent experiments. Median shown. Dotted lines are quartiles. p-values from unpaired t-test. (E) RPE-1 cells expressing MPAct-mCitrine (magenta), CFP-CaaX, and F-tractin-mCherry (green). For all figures, scale bar = 10 μm, unless marked.
Fig. 2
Fig. 2. Migrating cells have stable back-to-front MPA density gradients with MPA density being lowest in the front independent of cell type and migration mode.
(A) (left) HT-HUVEC expressing MPAct-mCitrine (magenta) and iRFP-CaaX (green) migrating on 20 μm fibronectin stripes. MPAct/CaaX ratio (middle) and F-actin marker F-tractin (right) images shown at same time points. Kymographs of activity changes comparing front-to-back location. 2 min time points. (B) Quantification of activity profile changes over one hour for cell in (A). Error bars are standard deviation. (C) Average gradients of MPAct/CaaX ratio for 14 individual HT-HUVEC (green) and group average (black) migrating on stripes. (D) Example of MPAct/CaaX ratio image in collectively migrating HT-HUVEC monolayers with mosaic MPAct expression. (E) Image section of RPE-1 cells stably expressing iRFP-CaaX (green) and MPAct-mCitrine (magenta) migrating in 0.5 mg/mL collagen matrix. Scale of MPAct/CaaX normalized for maximal signal range. Migration directions indicated by arrows.
Fig. 3
Fig. 3. MPA density is locally lowered prior to local Rac activation and local membrane protrusion.
(A, B) Repolarization of migrating RPE-1, MPAct/CaaX image series (A). Kymograph analysis (B). (C-D) Mean MPAct/CaaX gradient steepness versus mean velocity for HT-HUVEC migrating on stripes over periods > 1 hour. Gradient steepness calculated as ratio of MPAct signal between back and front 10 % of cell. Average velocity is total displacement/time. Line of best fit shown. N = 43 cells from 2 independent experiments. (D) Centroid displacement for the two cells marked in (C). (E) Edge parametrization. Local protrusion direction and distance shown as white arrows, global direction as black arrow. (F) Comparison of local edge velocity (top), MPAct/CaaX (middle), MPAct(Δ1–6)/CaaX (bottom) signals versus time. Images taken every 1 minute. (G-I) MPAct signal change during local retraction and protrusion. Red line shows profile direction (G). Analysis of MPAct/CaaX line profile over time (H) and maximal MPAct signal as a function of time and protrusion length (I). Scale bar = 5 μm. (J) Comparison of mean protrusion edge velocity and local MPAct signal change. Traces aligned to time of protrusion. Mean and 95% CI, N = 25 repolarization events. (K) Kymograph of normalized edge velocity (top), MPAct/membrane (middle), and Raichu-Rac1 FRET (bottom) in RPE-1. Edge analysis as in (E-F). Black outlines marks areas of low MPAct signals. (L) In silico activity alignment to half-maximal Rac activation, comparing edge velocity (black, right y-axis), MPAct (green left y-axis), and Raichu-Rac1 (orange, left y-axis) signal time courses. Mean and 95% CI, N =30 events, 3 independent experiments.
Fig. 4
Fig. 4. Local sites with low MPA density direct local membrane protrusions by Racmediated actin polymerization and osmotic pressure.
(A-D) Cell response after uniform acute Rac-GEF activation (TIAM). Membrane outline changes shown as yellow periphery (A). Induced edge velocity comparing areas of high (red) and low (blue) MPAct signal. N = 27 cells, 2 independent experiments (B). Kymograph focusing on white box (C) from image in (A) comparing MPAct/CaaX signal (left) and edge velocity (right). Black outlines marks areas of high MPAct signals. Scale bar = 5 μm. (E) (left) MPAct/CaaX image before hypoosmotic shock. Maximum future expansion (red), initial cell area (white). (right) F-tractin image showing progressive expansion after hypoosmotic shock. (F) Hypoosmotic membrane extension over 10 minutes, high versus low MPAct areas. Data from the same cell connected by gray lines. Mean and 95% CI shown. N = 20 cells. (G) Control FKBP-YFP (left) and FKBP-mCitrine-Ezrinabd (right) during rapamycin addition. Active protrusion marked by white arrow and outlines at 0- and 10-minute shown. (H) Mean fraction of retracting protrusions. N =109 (CTRL), 121 (EZRabd) cells from 3 separate experiments. Mean and standard deviation shown.
Fig. 5
Fig. 5. Higher cofilin-mediated F-actin disassembly in the front versus back regulates the MPA density gradient during cell migration.
(A) (Top) Migrating RPE-1 before treatment with JBY cocktail. Boxed region is shown below, (Bottom) CaaX (green), MPAct (magenta), and MPAct/CaaX images shown before and after addition of JBY cocktail. (B) PA-GFP-actin and F-tractin dynamics after a PA-GFP-Actin line photoconversion in migrating RPE-1, in control (left), and after addition of 4 μM Jasplakinolide to stabilize F-actin (right). (C) Mean PA-GFP-Actin fluorescence loss at the front (red) and back (blue) of migrating RPE-1 with WT (top, N = 44 cells), 4 μM Jasplakinolide (bottom, N = 9 cells). Mean and 95% confidence intervals (CI) are shown. (D) F-tractin (top) and MPAct/CaaX (bottom) signal changes after addition of 20 μM Limki 3. (E) RPE-1 expressing Limk-CFP (magenta), YFP-SSH (green), MPact-mRuby3 and iRFP-CaaX. (F) RPE-1 stained with phalloidin, anti-αLimk antibody, and Hoechst. (G) Distribution of MPAct/CaaX versus SSH/Limk before and after 20 μM Limki addition (typical example, N = 10 cells). (H) MPAct/CaaX (orange, left y-axis) and SSH/Limk (green, right y-axis) signal changes in front and back for cell in (G). Dashed line, Limki addition.

References

    1. Salbreux G, Charras G, Paluch E, Actin cortex mechanics and cellular morphogenesis. Trends Cell Biol 22, 536–545 (2012). - PubMed
    1. Chalut KJ, Paluch EK, The Actin Cortex: A Bridge between Cell Shape and Function. Developmental Cell 38, 571–573 (2016). - PubMed
    1. Ostrowski PP, Grinstein S, Freeman SA, Diffusion Barriers, Mechanical Forces, and the Biophysics of Phagocytosis. Developmental Cell 38, 135–146 (2016). - PubMed
    1. Freeman SA et al., Transmembrane Pickets Connect Cyto- and Pericellular Skeletons Forming Barriers to Receptor Engagement. Cell 172, 305–317.e10 (2018). - PMC - PubMed
    1. Fritzsche M, Thorogate R, Charras G, Quantitative analysis of ezrin turnover dynamics in the actin cortex. Biophys. J 106, 343–353 (2014). - PMC - PubMed

Publication types