. 2020 Jul 10;369(6500):eaaz5626.
doi: 10.1126/science.aaz5626. Epub 2020 Jun 11.

Human CNS barrier-forming organoids with cerebrospinal fluid production

Affiliations

Human CNS barrier-forming organoids with cerebrospinal fluid production

Laura Pellegrini et al. Science. .

Abstract

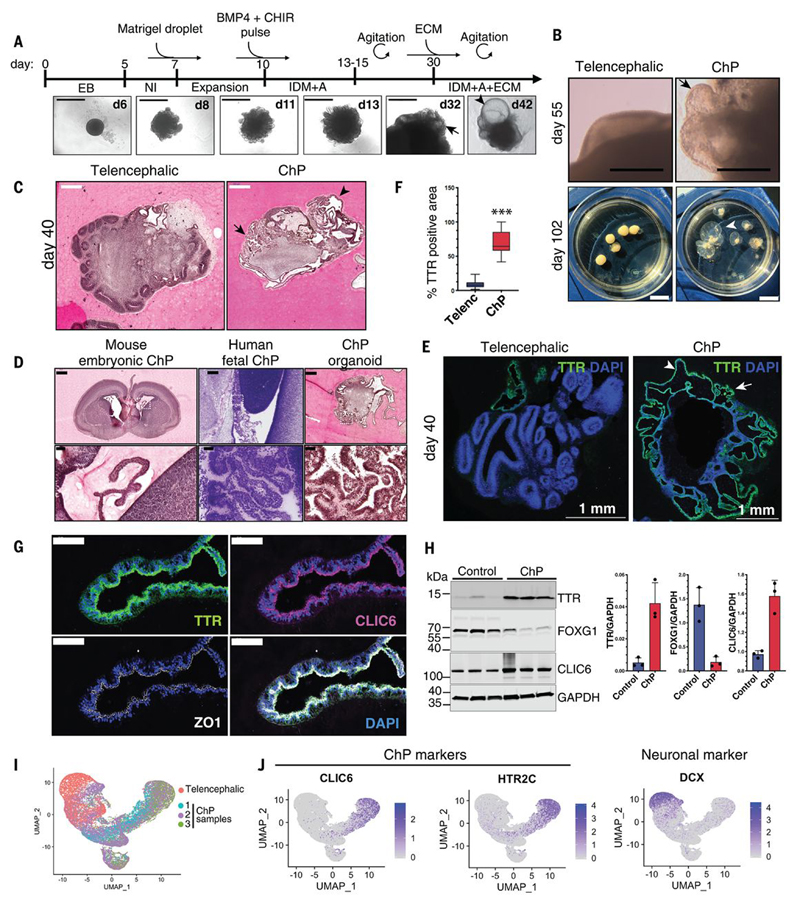
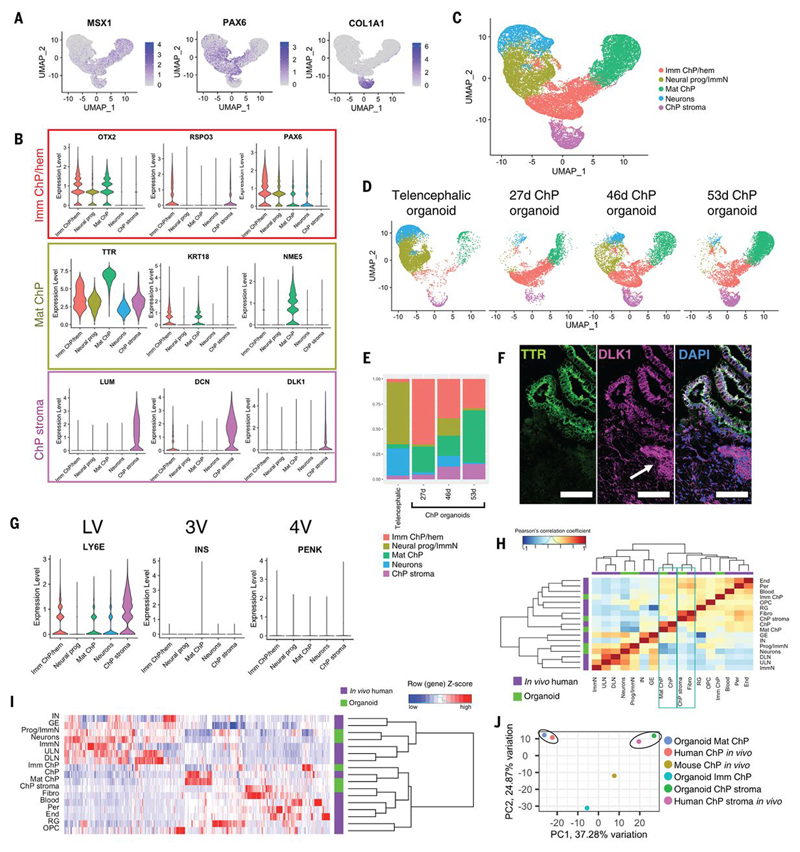
Cerebrospinal fluid (CSF) is a vital liquid, providing nutrients and signaling molecules and clearing out toxic by-products from the brain. The CSF is produced by the choroid plexus (ChP), a protective epithelial barrier that also prevents free entry of toxic molecules or drugs from the blood. Here, we establish human ChP organoids with a selective barrier and CSF-like fluid secretion in self-contained compartments. We show that this in vitro barrier exhibits the same selectivity to small molecules as the ChP in vivo and that ChP-CSF organoids can predict central nervous system (CNS) permeability of new compounds. The transcriptomic and proteomic signatures of ChP-CSF organoids reveal a high degree of similarity to the ChP in vivo. Finally, the intersection of single-cell transcriptomics and proteomic analysis uncovers key human CSF components produced by previously unidentified specialized epithelial subtypes.


Conflict of interest statement

Competing interests: The authors have filed a patent based on the ChP organoid method.

Figures

Figure 1
Figure 1. Generation of human ChP organoids with self-contained fluid-filled compartments.
(A) Protocol timeline with images of H9 round seeded ChP organoids over time. Arrow indicates emerging ChP epithelium and arrowhead the later fluid-filled compartment. Scale bar: 1000μm. (B) Comparison of H1 ChP and telencephalic organoids (day 55, scale bar:1mm and day 102, scale bar:1cm). Arrow indicates ChP epithelium, arrowhead points to fluid-filled cavity. (C) H&E stained sections of H1 telencephalic and ChP organoids (day 40). Arrow indicates convoluted ChP epithelium, arrowhead points to fluid-filled cavity. Scale bar:500μm. (D) Histological sections of E18.5 mouse embryonic brain (H&E stained), human fetal ChP at 15 post-conception weeks (Nissl stained, from BrainSpan Atlas of the Developing Human Brain (44)), and H1 human ChP organoid at day 40 (H&E stained). Scale bar: 500μm, 50μm for magnification. (E) Representative confocal images of H1 telencephalic and ChP organoids at day 40 stained for TTR and nuclei (DAPI, blue). Arrow indicates convoluted TTR-positive ChP epithelium, arrowhead points to ChP epithelium surrounding fluid-filled cavity. Scale bar: 1mm. (F) Quantification of percentage of TTR-positive area over total organoid area in n=4 independent H9 batches (3-4 organoids per batch, day 30, 40, 48). ***P<0.00001, Mann-Whitney test. (G) Representative confocal images of ChP epithelium from H1 organoid (day 40) stained for TTR, CLIC6 and ZO1. Scale bar:50μm. (H) Immunoblots from telencephalic control, and ChP organoids probed for TTR, FOXG1, CLIC6, and loading control GAPDH. Quantification of immunoblots show band intensity normalized for GAPDH (n=3 independent H9 batches collected at day 75, 73 and 68, in separate lanes). (I) UMAP dimensional reduction plot of the combined samples (telencephalic organoids, and three ChP organoids), showing overlap among ChP organoid cells. (J) Feature plots showing enrichment of ChP markers CLIC6 and HTR2C in ChP cells, and of neuronal marker DCX in telencephalic organoid cells.
Figure 2
Figure 2. ChP organoids closely recapitulate transcriptomic signature of human.
in vivo tissue.(A) Feature plots showing enrichment of genes involved in ChP development (MSX1, PAX6) and stromal marker COL1A1. (B) Violin plots of scRNA-seq analysis showing expression levels of ChP immature/hem (OTX2, RSPO3, PAX6), mature (TTR, KRT18, NME5) and stromal markers (LUM, DCN, DLK1). (C) UMAP plot showing scRNA-seq clusters of combined samples. (D) UMAP plots separated by samples showing progressive enrichment in ChP populations in ChP organoids compared to 55 day old mixed telencephalic identity organoids. (E) Stacked bar chart showing relative proportion of clusters in each sample. (F) Confocal images of ChP organoids positive for TTR and DLK1 in an adjacent stromal population (arrow). Scale bar:100μm. (G) Violin plots showing expression levels of regional ChP markers for lateral (LV, LY6E), third (3V, INS) and fourth (4V, PENK) ventricle. (H) Heatmap and dendrogram of Pearson’s correlation coefficients across identified in vivo human dorsal telencephalon (21) and organoid clusters showing high similarity between in vivo and in vitro ChP clusters (green outline). (I) Heatmap and dendrogram of unbiased hierarchical clustering based on the 1000 most variable genes between organoid single cell clusters and in vivo human brain single cell clusters. (J) PCA plot of scRNA-seq ChP clusters from mouse embryo, human fetal dorsal telencephalon, and ChP organoids, revealing higher similarity of ChP organoid clusters to human than to mouse ChP.
Figure 3
Figure 3. ChP organoids form a tightly sealed barrier.
(A) Violin plots showing expression levels of CLDN1, CLDN3 and CLDN5 in organoid cell clusters identified by scRNA-seq. (B) Feature plots showing enrichment in tight junction proteins TJP1 and TJP2, OCLN, INADL and MPDZ in ChP immature and mature clusters. (C) Representative images of H1 ChP organoids (day 40) staining positive for TTR, CLDN1, CLDN3, CLDN4 and CLDN5. Scale bar:50μm. (D) Electron micrographs showing tight junctions (TJ), microvilli (upper, middle panel), cilia (C), multivesicular bodies (MVB) and extracellular vesicles (Ex). Scale bar:1μm. (E) Bright field images of ChP organoids with clear, fluid-filled compartments despite incubation for 2h with 647-Alexafluor 10kDa dextran (blue tint). (F) Fluorescent intensity in media and organoid fluid after 2h incubation with 70kDa Oregon green-dextran, 10kDa 647-Alexafluor dextran and 3-5kDa FITC-dextran.
Figure 4
Figure 4. ChP organoids predict CNS permeability of small molecules.
(A) Schematic of CNS drug permeability measurement in ChP organoids. (B) Top: NMR spectra of organoid fluid upon application of Dopa, L-Dopa or no drug (Ctrl) measured after 2h incubation. Bottom: Quantifications of above NMR spectra in media and organoid fluid. (C) Representative images of ChP organoids stained for TTR, LAT1, Pgp. (D) Immunoblot for ChP transporters MRP1, LAT1, CLIC6, and secreted protein IGF2, and the loading control GAPDH of ChP organoid lysates (day 10 to day 31). (E) Confocal images of ChP organoids stained for transporters MRP4 and MRP1. Scale bar:50μm. (F) Relative quantifications of NMR spectra of bupropionyl, methotrexate and vincristine in media and organoid fluid after 2h. (G) Scatter plot with linear regression showing correlation (R2=0.9921; Slope=1.004) between in vivo CSF/plasma ratio (K p,uu,CSF) and in vitro organoid fluid/media ratio (K m,uu,Org.fluid) of unbound drugs (Table S2). In contrast to other drugs shown, Sephin 1 (red dot) in vivo CSF/plasma measurement is the reported value from mice (32). (H) Relative quantifications of NMR spectra of Sephin 1 in media and organoid fluid after 2h. (I) Relative quantifications of NMR spectra of BIA 10-2474 in media and organoid fluid after 2h. (J) Time course analysis of the ratio of BIA 10-2474 and bupropionyl in organoid fluid to media at 2h, 12h, 24h and 72h. (All drugs were tested in n=3 independent experiments; Table S1).
Figure 5
Figure 5. ChP organoids secrete human CSF proteins and progressively mature to a postnatal state.
(A) Top: violin plots showing expression levels of water transporter AQP1 and CSF secretion enzymes CA2 and CA12 in scRNA-seq clusters. Bottom: feature plots showing enrichment in SLC23A2 (vitamin C transporter) and SLC46A1 (folate transporter) in scRNA-seq clusters. (B) Confocal images of H1 ChP organoid at day 40 and in vivo ChP from a mouse embryo (E18.5) stained for Aqp1 and TTR. Scale bar:50μm. (C) gProfileR (45) analysis of proteins detected in iCSF from at least 2 ChP organoid samples, showing significant (P<0.05) enrichments for GO categories cellular component (GO:CC), molecular function (GO:MF) and biological process (GO:BP), KEGG, REAC, WP, HP databases. (D) Color-coded heatmap showing relative abundance (emPAI values) of proteins detected in organoid iCSF from at least two organoid batches (5 batches of H9, 6 batches of H1 and one iPSCs batch, Table S3) and with a mean emPAI ≥ in organoids. Corresponding values are shown for the media, the mean of the 12 organoid samples, and the mean of 3 in vivo CSF samples: human adult CSF, bovine fetal CSF and embryonic mouse CSF (E12.5-13.5) (Table S4). (E) Venn diagram of all proteins detected with an emPAI ≥ in any sample. Proteins were assigned to each group in which they were detectable at any level. (F) Venn diagram of proteins detected in at least 2 iCSF samples and with an emPAI ≥ in at least one. Overlap is shown for proteins detected in datasets of human adult CSF (46), pediatric CSF from healthy controls (47), and human embryonic CSF (48). (G) Color-coded heatmap of protein emPAI level showing abundant iCSF proteins (emPAI ≥ in early d32-d58 or late d68-d146 stage organoids) shared with in vivo samples (split into developing and adult). Proteins are highlighted and color-coded according to the earliest stage human in vivo CSF dataset in which they are detected from the following published datasets: human adult CSF (46), pediatric CSF (47) and embryonic CSF (48). (H) emPAI heatmap of proteins reproducibly (more than one iCSF sample) and abundantly (emPAI ≥ in early d32-d58 or late d68-d146 stage organoids) detected in iCSF but not in media, and shared with at least one in vivo sample, which are considered de novo ChP-derived CSF proteins.
Figure 6
Figure 6. Identification and molecular characterization of ChP epithelial subtypes.
(A) UMAP plot showing subclustering of the mature ChP epithelial cluster identified by scRNA-seq. (B) Heatmap of top 10 differentially up-regulated transcripts in the four subclusters identified, and the major GO terms enriched for each cluster. (C) Dot plot showing average expression and percent of cells expressing the displayed enriched genes identified by scRNA-seq. (D) Electron micrographs showing dark (D) and light (L) cells on the ChP epithelium in organoids. Arrowhead points to basal body in a light cell. Scale bar:40μm. (E) Representative confocal images of H1 ChP organoid (day 82) stained for mitochondrial marker CARD19, ciliated cell marker FOXJ1, and TTR. Scale bar:100μm. (F) Confocal images of H1 ChP organoid (day 46) stained for Foxj1, Arl13b (cilia) and TTR. Scale bar:50μm and 100μm (zoom-in:20μm). (G) Representative confocal images of H1 ChP organoid (day 82) stained for alpha-smooth muscle actin (α-SMA), transgelin (TAGLN) and TTR. Scale bar:100μm.
Figure 7
Figure 7. Identification of novel factors secreted by distinct ChP epithelial subtypes.
(A) Dot plot showing average expression and percent of cells expressing factors overlapping between iCSF detected proteins and differentially expressed genes within the four subclusters (Supplementary Data 3). (B) Violin plot showing expression of IGF2 in ChP epithelial subtypes identified by scRNA-seq. (C) Representative confocal images of H9 ChP organoid (day 50) stained for IGF2, ZO1, TTR and DAPI. Scale bar:50μm. (D) Color-coded heatmap showing proteins reproducibly (detected in more than one iCSF sample) and abundantly (emPAI ≥ in early d32-d58 or late d68-d146 stage organoids) detected in iCSF but not in media or in in vivo developing mouse or bovine CSF or in adult human CSF. Highlighted and color-coded accordingly are proteins detected in published datasets of human embryonic (48) or pediatric CSF (47), and novel factors predicted to be secreted (GeneCards database). (E) Violin plots showing expression levels of secreted proteins identified exclusively in organoid iCSF: LGALS3BP, MDK and PRAP1. (F) Representative confocal images of H1 ChP organoid (day 56) stained for LGALS3BP, DCN, TTR and DAPI. Scale bar:100μm.

Comment in

References

    1. Lun MP, Monuki ES, Lehtinen MK. Development and functions of the choroid plexus-cerebrospinal fluid system. Nat Rev Neurosci. 2015;16:445–457. - PMC - PubMed
    1. Lehtinen MK, Walsh CA. Neurogenesis at the Brain-Cerebrospinal Fluid Interface. Annu Rev Cell Dev Biol. 2011;27:653–679. - PMC - PubMed
    1. Silva-Vargas V, Maldonado-Soto AR, Mizrak D, Codega P, Doetsch F. Age-Dependent Niche Signals from the Choroid Plexus Regulate Adult Neural Stem Cells. Cell Stem Cell. 2016;19:643–652. - PubMed
    1. Lun MP, Johnson MB, Broadbelt KG, Watanabe M, Kang Y-j, Chau KF, Springel MW, Malesz A, Sousa AMM, Pletikos M, et al. Spatially Heterogeneous Choroid Plexus Transcriptomes Encode Positional Identity and Contribute to Regional CSF Production. J Neurosci. 2015;35:4903–4916. - PMC - PubMed
    1. Ghersi-Egea JF, Strazielle N, Catala M, Silva-Vargas V, Doetsch F, Engelhardt B. Molecular anatomy and functions of the choroidal blood-cerebrospinal fluid barrier in health and disease. Acta Neuropathol. 2018;135:337–361. - PubMed

Publication types

Substances