. 2020 Aug 7;369(6504):712-717.
doi: 10.1126/science.abc2061. Epub 2020 Jun 11.

Type I and III interferons disrupt lung epithelial repair during recovery from viral infection

Affiliations

Type I and III interferons disrupt lung epithelial repair during recovery from viral infection

Jack Major et al. Science. .

Abstract

Excessive cytokine signaling frequently exacerbates lung tissue damage during respiratory viral infection. Type I (IFN-α and IFN-β) and III (IFN-λ) interferons are host-produced antiviral cytokines. Prolonged IFN-α and IFN-β responses can lead to harmful proinflammatory effects, whereas IFN-λ mainly signals in epithelia, thereby inducing localized antiviral immunity. In this work, we show that IFN signaling interferes with lung repair during influenza recovery in mice, with IFN-λ driving these effects most potently. IFN-induced protein p53 directly reduces epithelial proliferation and differentiation, which increases disease severity and susceptibility to bacterial superinfections. Thus, excessive or prolonged IFN production aggravates viral infection by impairing lung epithelial regeneration. Timing and duration are therefore critical parameters of endogenous IFN action and should be considered carefully for IFN therapeutic strategies against viral infections such as influenza and coronavirus disease 2019 (COVID-19).


Figures

Fig. 1
Fig. 1. Type I and III IFNs reduce epithelial cell proliferation during lung repair.
(A and B) Mice were infected intranasally with 104 TCID50 X31 (H3N2) influenza virus in 30 μl. (A) Proliferating (Ki67+) AT2 cells (EpCam+MHCII+CD49flo) were measured by flow cytometry (n = 5 mice). (B) Type I and III IFN levels were detected in BALF (n = 4) on indicated days after infection. (C and D) X31-infected mice were administered IFNs every 24 hours (on days 7 to 10 after infection). Proliferating (Ki67+) AT2 cells (EpCam+MHCII+CD49flo) were measured by flow cytometry on day 11 after infection. (C) Lethally irradiated WT mice were injected with Ifnar1−/− BM cells. After reconstitution, influenza virus–infected chimeric mice were treated with phosphate-buffered saline (PBS) control (n = 8), IFN-α (n = 9), or IFN-β (n = 9). Naïve controls were uninfected, untreated BM chimeric mice (n = 2). (D) Infected WT mice were treated with IFN-λ (n = 4) or PBS control (n = 4). Naïve controls were uninfected, untreated WT mice (n = 5). IAV, influenza A virus. (E) B6-Mx1 mice were infected with 2.5 × 10³ TCID50 hvPR8-ΔNS1 (H1N1) and treated with IFN-λ (n = 4) or PBS control (n = 4). IFN treatment and lung analysis were performed as for (C) and (D). (F to H) Lungs from X31-infected WT mice (n = 4 to 7), Ifnar1−/− mice (n = 4) (F), Ifnlr1−/− mice (n = 7) (G), and BM chimeric mice (n = 4 to 5) (H) were harvested; and proliferating (Ki67+) AT2 cells were measured by flow cytometry on day 8 after infection. All data are representative of at least two independent experiments. Data are shown as means ± SEM, and statistical significance was assessed by one-way analysis of variance (ANOVA) with Dunnett’s posttest [(C), (D), and (H)] or unpaired two-tailed Student’s t test [(E) to (G)]. P > 0.05; *P ≤ 0.05; **P ≤ 0.01; ***P ≤ 0.001.
Fig. 2
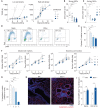
Fig. 2. IFN signaling blocks AEC growth and differentiation.
(A) Murine AECs were seeded at a low density (500 cells per transwell) or high density (104 cells per transwell) in the presence of equivalent doses of IFN-α, IFN-β, IFN-λ, or media control, and then grown for 12 days (n = 3 transwells for all conditions). Confluence was determined by measuring transepithelial electrical resistance (TEER) (>1000 ohm = confluent cultures). (B, D, and E) Proliferating murine AEC cultures (2 days before exposure to an ALI) were treated for 5 days with IFNs (2 days before ALI to day 3 after ALI), and effects on growth were determined by cell number (n = 9) (B) and incorporation of the thymidine analog EdU to measure proliferation (n = 9) [(D) and (E)]. DAPI, 4′,6-diamidino-2-phenylindole; EdU, 5-ethynyl-2′-deoxyuridine. (C) Primary human AEC cultures were treated with IFNs for 5 days and cells were counted (n = 4 to 6). (F and G) Murine AECs were grown to confluence, then exposed to an ALI for 2 days. IFNs were then administrated for 6 days during ALI exposure (n = 6 for all conditions). Differentiation was determined by mRNA expression of the indicated genes (F) and the level of acetylated α-tubulin staining in cultures (G). (H and I) WT and Ifnlr1−/− mice were infected with influenza virus, and lungs were analyzed by immunofluorescence (DAPI or acetylated α-tubulin) on day 10 after infection (n = 4 mice) (H), and flow cytometry (EpCam+CD49fhiCD24+) on day 14 after infection (n = 3) (I). All data are representative of at least three independent experiments. Data are shown as means ± SEM, and statistical significance was assessed by one-way [(B), (C), (E), and (G)] or two-way [(F) and (I)] ANOVA with Dunnett’s posttest. Scale bar represents 100 μm (H). ns, not significant; P > 0.05; *P ≤ 0.05; **P ≤ 0.01; ***P ≤ 0.001; ****P ≤ 0.0001.
Fig. 3
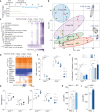
Fig. 3. Type I and III IFNs activate antiproliferative and cell death pathways in AECs via induction of p53.
(A) Schematic diagram for IFN treatment of murine AECs for RNA-sequencing analysis. (B) PCA plot of RNA-sequencing data from AECs after IFN treatment and from untreated controls. (C) Heatmap for significant differences in canonical pathways for nine pairwise comparisons between indicated IFN treatment and the respective mock, at each time point (fold change >1.5, one-way ANOVA with Benjamini-Hochberg correction, P < 0.05). Gene expression was compared using ingenuity pathway comparison analysis. MHC, major histocompatibility complex. (D) Predicted upstream transcriptional regulators of differentially expressed genes (ingenuity pathway analysis). (E to G) WT and p53−/− murine AECs were treated with IFN subtypes for 5 days and measured for growth by cell number (E), CFSE (carboxyfluorescein diacetate succinimidyl ester) dilution (F), and mRNA expression of indicated genes (G) (n = 3 transwells for all conditions). (H and I) Ifnar1−/− → WT BM chimeric mice (n = 4 to 5 mice) (H) and α-Ly6G treated mice (n = 4) (I) infected with influenza virus (X31), and treated with IFN every 24 hours consecutively for 4 days (days 7 to 10 after infection), before EpCam+MHCII+CD49flo AT2 cells were analyzed for p53 mean fluorescence intensity (MFI) on day 11 after infection by flow cytometry. All data are representative of at least two independent experiments [(E) to (I)]. Data are shown as means ± SEM, and statistical significance was assessed by two-way [(E) to (G)] or one-way (H) ANOVA with Dunnett’s posttest or by unpaired two-tailed Student’s t test (I). ns, not significant; P > 0.05; *P ≤ 0.05; **P ≤ 0.01; ***P ≤ 0.001; ****P ≤ 0.0001.
Fig. 4
Fig. 4. Ifnlr1−/− mice have improved lung repair, reduced damage, and improved epithelial barrier function.
WT and Ifnlr1−/− mice were infected with 104 TCID50 X31 influenza virus (X31). (A) GSEA plots of RNA-sequencing datasets from WT or Ifnlr1−/− bulk lung epithelial cells (EpCam+) on day 8 after infection. FDR, false discovery rate; NES, normalized enrichment score; GO, gene ontology. (B and C) Total cell and red blood cell (RBC) (TER-119+) number in BALF on day 8 after infection (n = 4 mice for both WT and Ifnlr1−/−). (D) Histopathological analysis of hematoxylin and eosin (H&E) lung sections on day 9 after infection (n = 4 for both WT and Ifnlr1−/−). (E) Lethally irradiated WT and Ifnlr1−/− mice were injected with WT BM cells. After reconstitution, chimeric mice were challenged with 2 × 10⁵ colony-forming units TIGR4 in 30 μl on day 8 (d8) after influenza virus infection (n = 8 WT; n = 9 Ifnlr1−/−). All data are representative of at least two independent experiments [(B) to (E)]. Data are shown as means ± SEM, and statistical significance was assessed by unpaired two-tailed Student’s t test (B), Mann-Whitney U test (D), or log-rank (Mantel-Cox) test (E). *P ≤ 0.05; **P ≤ 0.01.

Comment in

References

    1. Teijaro J. R., Ng C., Lee A. M., Sullivan B. M., Sheehan K. C. F., Welch M., Schreiber R. D., de la Torre J. C., Oldstone M. B. A., Persistent LCMV infection is controlled by blockade of type I interferon signaling. Science 340, 207–211 (2013). 10.1126/science.1235214 - DOI - PMC - PubMed
    1. Davidson S., Crotta S., McCabe T. M., Wack A., Pathogenic potential of interferon αβ in acute influenza infection. Nat. Commun. 5, 3864 (2014). 10.1038/ncomms4864 - DOI - PMC - PubMed
    1. Channappanavar R., Fehr A. R., Vijay R., Mack M., Zhao J., Meyerholz D. K., Perlman S., Dysregulated type I interferon and inflammatory monocyte-macrophage responses cause lethal pneumonia in SARS-CoV-infected mice. Cell Host Microbe 19, 181–193 (2016). 10.1016/j.chom.2016.01.007 - DOI - PMC - PubMed
    1. Wilson E. B., Yamada D. H., Elsaesser H., Herskovitz J., Deng J., Cheng G., Aronow B. J., Karp C. L., Brooks D. G., Blockade of chronic type I interferon signaling to control persistent LCMV infection. Science 340, 202–207 (2013). 10.1126/science.1235208 - DOI - PMC - PubMed
    1. Parker B. S., Rautela J., Hertzog P. J., Antitumour actions of interferons: Implications for cancer therapy. Nat. Rev. Cancer 16, 131–144 (2016). 10.1038/nrc.2016.14 - DOI - PubMed

Publication types

MeSH terms