. 2020 Jun 11;11(1):2958.
doi: 10.1038/s41467-020-16796-3.

Autophagy-mediated apoptosis eliminates aneuploid cells in a mouse model of chromosome mosaicism

Affiliations

Autophagy-mediated apoptosis eliminates aneuploid cells in a mouse model of chromosome mosaicism

Shruti Singla et al. Nat Commun. .

Abstract

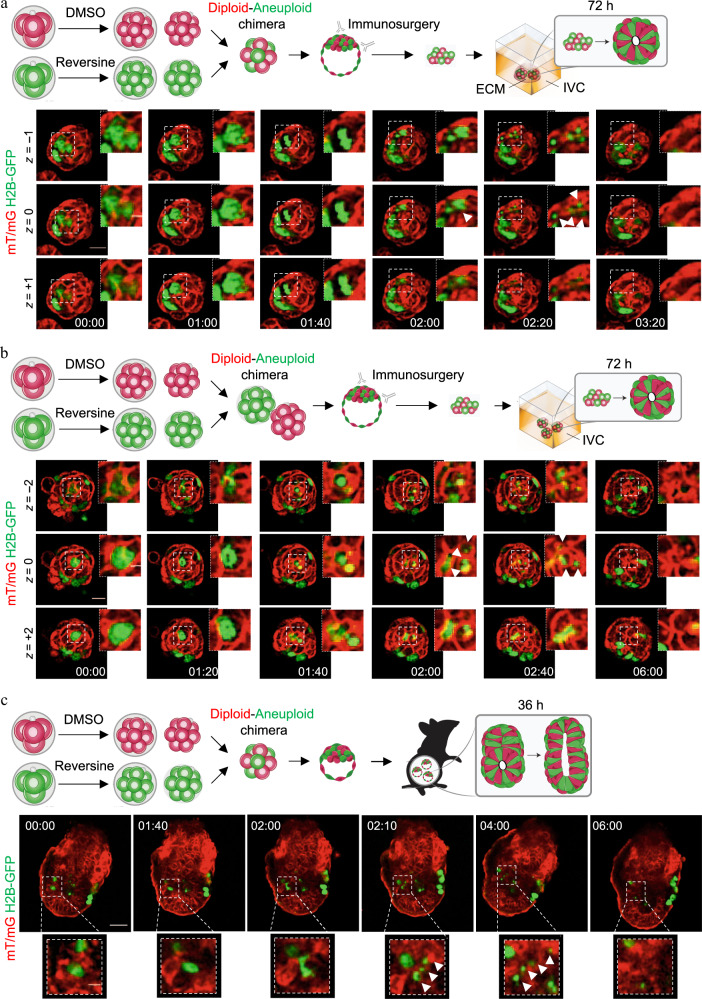
The high incidence of aneuploidy in the embryo is considered the principal cause for low human fecundity. However, the prevalence of aneuploidy dramatically declines as pregnancy progresses, with the steepest drop occurring as the embryo completes implantation. Despite the fact that the plasticity of the embryo in dealing with aneuploidy is fundamental to normal development, the mechanisms responsible for eliminating aneuploid cells are unclear. Here, using a mouse model of chromosome mosaicism, we show that aneuploid cells are preferentially eliminated from the embryonic lineage in a p53-dependent process involving both autophagy and apoptosis before, during and after implantation. Moreover, we show that diploid cells in mosaic embryos undertake compensatory proliferation during the implantation stages to confer embryonic viability. Together, our results indicate a close link between aneuploidy, autophagy, and apoptosis to refine the embryonic cell population and ensure only chromosomally fit cells proceed through development of the fetus.


Conflict of interest statement

The authors declare no competing interests.

Figures

Fig. 1
Fig. 1. Aneuploid cells become eliminated during peri-implantation epiblast remodelling.
Embryos were treated with reversine (or DMSO) at the four- to eight-cell stage transition and eight-cell chimeras containing a 1:1 ratio of control (diploid) and reversine-treated (aneuploid) cells were constructed from mT/mG (red) diploid cells and non-fluorescent aneuploid cells at the eight-cell stage. a At the late blastocyst stage, immunosurgery was performed to isolate the inner cell mass (ICM) from the trophectoderm (TE). Chimeras were embedded in Matrigel and cultured in IVC medium for 72 h to allow development into an epithelised epiblast (EPI) surrounded by a primitive endoderm (PE) layer with a central lumen. b In these examples, the diploid–diploid EPI contains both red fluorescent and non-fluorescent cells. Whereas, the majority of the diploid–aneuploid chimera originates from the red fluorescent diploid clone. Scale bars, 30 μm. c After culture according to (a), average distribution of red fluorescent and non-fluorescent cells was assessed for both types of chimeras in the EPI and PE. For b and c, diploid–diploid n = 21 embryos; n = 2636 EPI cells; n = 3003 PE cells and diploid–aneuploid n = 19 embryos; n = 1900 EPI cells; n = 2306 PE cells. d At the early blastocyst stage, chimeras were transferred to pseudo-pregnant mothers and recovered 12 h after implantation and cultured in IVC medium for 36 h. e In these examples, the diploid–diploid EPI contains both red fluorescent and non-fluorescent cells. Whereas, most of the diploid–aneuploid chimera EPI originated from the red fluorescent diploid clone. Scale bars, 40 μm. Squares indicate magnified regions. Scale bars, 20 μm. f After culture according to (d), average distribution of red fluorescent and non-fluorescent cells was assessed for both types of chimeras in the EPI and PE. For the EPI (f), diploid–diploid n = 7 embryos; n = 807 EPI cells and diploid–aneuploid n = 14 embryos; n = 1640 EPI cells. For (e) and the PE (f), diploid–diploid n = 6 embryos; n = 1110 PE cells and diploid–aneuploid n = 8 embryos; n = 1488 PE cells. Source data are provided as a Source Data file.
Fig. 2
Fig. 2. Elimination of aneuploid epiblast cells during peri-implantation development by apoptosis.
Chimeras containing a 1:1 ratio of control (diploid) and reversine-treated (aneuploid) cells were constructed from mT/mG (red) diploid cells and Histone H2B-GFP (green) aneuploid cells at the eight-cell stage and cultured beyond the blastocyst stage. Sequential representative images from time-lapse series for three diploid–aneuploid chimeras are shown, each showing apoptosis of an aneuploid cell (histone H2B-GFP) (white boxes) during pre- to post-implantation development. White arrows indicate the apoptotic debris. a Eight-cell diploid–aneuploid chimeras (n = 12 embryos) were generated at the eight-cell stage. Immunosurgery was performed at the late blastocyst stage to isolate the ICM from the TE. The ICMs were embedded in Matrigel and cultured in IVC medium for 72 h, during which they were live-imaged. Scale bar, 20 μm. Squares indicate magnified regions. Scale bar, 7 μm. Three z-planes have been shown. b Sixteen-cell diploid–aneuploid chimeras (n = 22 embryos) were generated at the eight-cell stage. Immunosurgery was performed at the late blastocyst stage and ICMs were cultured in IVC medium for 72 h, during which they were live-imaged. Scale bar, 20 μm. Squares indicate magnified regions. Scale bar, 7 μm. Three z-planes have been shown. c Eight-cell diploid–aneuploid chimeras (n = 12 embryos) were generated at the eight-cell stage. At the early blastocyst stage, the chimeras were transferred to pseudo-pregnant mothers and recovered 12 h after implantation to be cultured in vitro for 36 h and live-imaged. Scale bar, 40 μm. Squares indicate magnified regions. Scale bar, 10 μm.
Fig. 3
Fig. 3. Size regulation of diploid–aneuploid epiblasts during peri-implantation development.
Embryos were treated with reversine (or DMSO) at the four- to eight-cell stage transition. a Eight-cell diploid–aneuploid and diploid–diploid chimeras were generated at the eight-cell stage. Immunosurgery was performed at the late blastocyst stage to isolate the ICM from the TE. The ICMs were embedded in Matrigel and cultured in IVC medium for 72 h. n = 19 diploid–aneuploid; n = 1900 EPI cells and n = 21 diploid–diploid chimeras; n = 2636 EPI cells. Student’s t test. b Sixteen-cell diploid–aneuploid and diploid–diploid chimeras were generated at the eight-cell stage. Immunosurgery was performed on the double size chimeras and ICMs were cultured in IVC medium for 72 h as above. Diploid–diploid n = 26 chimeras; n = 1772 EPI cells and diploid–aneuploid n = 30 chimeras; n = 1961 EPI cells. Mann–Whitney test. c Eight-cell diploid–aneuploid and diploid–diploid chimeras were transferred to pseudo-pregnant mothers and recovered 12 h after implantation and then in vitro cultured for 36 h. n = 4 diploid–aneuploid; n = 604 EPI cells and n = 6 diploid–diploid chimeras; n = 737 EPI cells. Mann–Whitney test. For graphs ac, relative number of cells in the EPI were analysed for both types of chimeras (relative to the average of diploid–diploid chimeras) at the end of the peri-implantation culture to investigate the level of size regulation of diploid–aneuploids with respect to diploid–diploids. ns = not significantly different. d Eight-cell diploid (red)–aneuploid and diploid (red)–diploid chimeras were generated. Immunosurgery was performed and ICMs were cultured as above for 48 h. The percentage of the number of pH3-positive red fluorescent EPI cells of the total red fluorescent EPI cells was analysed for each chimera, for both diploid–diploid and diploid–aneuploid ICMs. n = 21 diploid–aneuploid; n = 546 red EPI cells and n = 13 diploid–diploid chimeras; n = 217 red EPI cells. Scale bars, 20 μm. Squares indicate magnified regions. Scale bars, 10 μm. Student’s t test and **p = 0.0084. For all the graphs, all data are mean ± s.e.m. Source data are provided as a Source Data file.
Fig. 4
Fig. 4. Chronic protein misfolding and autophagy upregulation in the aneuploid EPI cells.
a HSP70 immunostaining in diploid and aneuploid embryos at indicated stages. Scale bars, 20 μm. Control diploid embryos: 8-cell n = 12, morula n = 9, early blastocyst n = 9, late blastocyst n = 14. Reversine-treated aneuploid embryos: 8-cell n = 10, morula n = 9, early blastocyst n = 9, late blastocyst n = 18. b Embryos were treated with MG132 (or DMSO) at the late blastocyst stage for 6 h and immunostained for LC3B. Each dot represents the average number of LC3B puncta/cell in an embryo. Mann–Whitney test. Control n = 5, MG132-treated n = 8 embryos. Scale bars, 20 μm. Squares indicate the magnified regions. Scale bars, 10 μm. *p = 0.0295. Analysis of LC3B (c) and p62 (d) immunostaining in diploid and aneuploid late blastocysts’ EPI. Each dot represents the average number of LC3B (c) or p62 (d) puncta/cell in an embryo. Scale bars, 20 μm. Squares indicate magnified regions. Scale bar, 5 μm. For c, diploid n = 16 embryos and aneuploid n = 17 embryos. Student’s t test, **p = 0.0059. For d, diploid n = 18 embryos and aneuploid n = 18 embryos. Student’s t test, **p = 0.0033. e Zygotes were injected with dsGFP (control) or dsMad2 and immunostained for LC3B at the late blastocyst stage. Each dot represents the average number of LC3B puncta/cell in an embryo. Student’s t test with Welch’s correction, *p = 0.0106. dsGFP n = 11, dsMad2 n = 12 embryos. Scale bars, 20 μm. Squares indicate the magnified regions. Scale bars, 10 μm. For graphs be, data are shown as individual data points in a Box and Whiskers graph (bottom: 25%; top: 75%; line: median; whiskers: min to max). Source data are provided as a Source Data file.
Fig. 5
Fig. 5. Autophagy upregulation mediates cell death in the ICM of aneuploid pre-implantation embryos.
a Diploid and aneuploid embryos were imaged with Bafilomycin A1 (BafA1) or DMSO and SYTOX from the early to late blastocyst stage (24 h). The number of dying ICM cells was assessed relative to the average number of dying cells in DMSO-treated diploid ICMs. Diploid n = 26 embryos, aneuploid n = 24 embryos, diploid BafA1 n = 23 embryos, aneuploid BafA1 n = 24 embryos. Kruskal–Wallis test, *p = 0.0435, **p = 0.0050. b Two-cell stage embryos were injected with Atg5 siRNA or control siRNA, treated at the four- to eight-cell stage with reversine or DMSO, and imaged with SYTOX during blastocyst maturation (24 h). The number of dying ICM cells was assessed relative to the average number of dying cells in control siRNA-injected diploid ICMs. Diploid n = 20 embryos, aneuploid n = 21 embryos, diploid Atg5 siRNA n = 21 embryos, aneuploid Atg5 siRNA n = 27 embryos. One-way ANOVA test, *p = 0.0374, **p = 0.0068. c Diploid (DMSO-treated) and aneuploid (reversine-treated) embryos were treated with DMSO or rapamycin (Rapa) from the early to the late blastocyst stage (24 h) and imaged in the presence of SYTOX to label dying cells. Diploid n = 15 embryos, aneuploid n = 12 embryos, diploid rapa n = 15 embryos, aneuploid rapa n = 15 embryos. One-way ANOVA test, *p = 0.0358. For all the graphs, data are shown as individual data points in a Box and Whiskers graph (bottom: 25%; top: 75%; line: median; whiskers: min to max), ns not significantly different. Source data are provided as a Source Data file.
Fig. 6
Fig. 6. Autophagy upregulation mediates cell death in the ICM of aneuploid peri-implantation embryos.
a Embryos were treated at the four- to eight-cell stage with reversine or DMSO. Control (diploid) and reversine-treated (aneuploid). After immunosurgery at the late blastocyst stage, ICMs were embedded in Matrigel and cultured in IVC medium. LC3B immunostaining was analysed in diploid and aneuploid EPIs after 48 h IVC in vitro culture. Each dot represents the average number of LC3B puncta/cell in each EPI. Scale bars, 7 μm. Squares indicate magnified regions. Scale bars, 2 μm. Mann–Whitney test, *p = 0.0409. Diploid n = 25 embryos and aneuploid n = 18 embryos. Data are shown as individual data points in a Box and Whiskers graph (bottom: 25%; top: 75%; line: median; whiskers: min to max). b Embryos were treated at the four- to eight-cell stage with reversine or DMSO. Diploid and aneuploid embryos were cultured in DMSO or BafA1 during blastocyst maturation. Immunosurgery was performed and ICMs were cultured as above for 72 h in DMSO or BafA1. c Diploid and aneuploid ICMs were cultured as shown in (b) for 72 h and analysed for the efficiency of formation of an organised structure comprising an epithelised EPI surrounded by a PE layer with a central lumen. Scale bars, 30 µm. d Relative (to diploids) efficiency of ICMs in forming an organised structure, assessed according to (c), was evaluated. n = 3 independent experimental groups. Diploid n = 34 embryos, aneuploid n = 36 embryos and aneuploid BafA1 = 31 embryos. e Relative (to diploids) number of cells in the EPI was analysed for organised structures obtained in (c) for all three conditions. One-way ANOVA test, *p = 0.0450. For c and e, diploid n = 18 embryos; n = 1246 EPI cells, aneuploid n = 10 embryos; n = 352 EPI cells and Aneuploid BafA1 = 9 embryos; n = 563 EPI cells. For graphs d and e, all data are mean ± s.e.m. For all the graphs, ns not significantly different. Source data are provided as a Source Data file.
Fig. 7
Fig. 7. p53-induced autophagy in the ICM of aneuploid pre-implantation embryos.
a Embryos were treated at the four- to eight-cell stage with DMSO (diploid) or reversine (aneuploid) and mRNA expression for genes involved in p53 pathway were assessed at the late blastocyst stage (relative to diploid embryos) using qRT-PCR. Diploid n = 69 embryos, aneuploid n = 67 embryos. Mann–Whitney test, *p = 0.0286. All data are mean ± s.e.m. b Two-cell stage embryos were injected with p53 siRNA or control siRNA, treated from four- to eight-cell stage with reversine or DMSO, and imaged in the presence of SYTOX during blastocyst maturation (24 h). The number of dying cells in the ICM was assessed relative to the average number of dying cells in the ICM in control siRNA-injected diploids. Diploid n = 20 embryos, aneuploid n = 20 embryos, diploid p53 siRNA n = 19 embryos, aneuploid p53 siRNA n = 18 embryos. One-way ANOVA test, *p = 0.0376 (diploid versus aneuploid), 0.0476 (diploid vs. diploid p53 siRNA), 0.0158 (aneuploid vs. aneuploid p53 siRNA). c Two-cell stage embryos were injected with p53 siRNA or control siRNA, treated at the four- to eight-cell stage with reversine or DMSO. The level of autophagy (average LC3B puncta/cell in an embryo) in the EPI was assessed at the late blastocyst stage using immunostaining. Diploid n = 19 embryos, aneuploid n = 18 embryos, Diploid p53 siRNA n = 11 embryos, aneuploid p53 siRNA n = 12 embryos. Scale bar, 10 μm. One-way ANOVA test, **p = 0.0055, *p = 0.0149. For the graphs b and c, data are shown as individual data points in a Box and Whiskers graph (bottom: 25%; top: 75%; line: median; whiskers: min to max). For all the graphs, ns = not significantly different, *p < 0.05 and **p < 0.01. d Schematic of the events downstream of aneuploidy in mouse embryos, leading to programmed cell death of the cell. Source data are provided as a Source Data file.
Fig. 8
Fig. 8. Model for the elimination of aneuploid cells in the mouse embryo.
a Aneuploid cells generated at the four- to eight-cell stage are progressively depleted from the epiblast of the mosaic embryo from the early blastocyst stage to the early post-implantation via apoptosis. Diploid cells in the same embryo over-proliferate to compensate for the reduction in overall epiblast cell number thereby allowing for successful development. b In a normal (diploid) cell, cellular protein quality control mechanisms, involving the proteasome machinery and autophagy, degrade misfolded/unfolded proteins to prevent cytotoxicity and promote healthy cell survival. We hypothesise that in an aneuploid cell in the epiblast, gene aberrations are translated into protein aberrations. Chronic protein misfolding after several mitotic divisions upregulates autophagy to an extent where instead of protecting the cell, it mediates cell death. This prevents the aneuploid cell from continuing further in the development of the epiblast.

References

    1. Delhanty JDA. Preimplantation genetics: an explanation for poor human fertility? Ann. Hum. Genet. 2001;65:331–338. - PubMed
    1. Macklon NS, Geraedts JPM, Fauser BCJM. Conception to ongoing pregnancy: the ‘black box’ of early pregnancy loss. Hum. Reprod. Update. 2002;8:333–343. - PubMed
    1. Magli MC, et al. Chromosome mosaicism in day 3 aneuploid embryos that develop to morphologically normal blastocysts in vitro. Hum. Reprod. 2000;15:1781–1786. - PubMed
    1. Rubio C, et al. Impact of chromosomal abnormalities on preimplantation embryo development. Prenat. Diagn. 2007;27:748–756. - PubMed
    1. Van Echten-Arends J, et al. Chromosomal mosaicism in human pre-implantation embryos: a systematic review. Hum. Reprod. Update. 2011;17:620–627. - PubMed

Publication types