. 2020 Jun 11;11(1):2968.
doi: 10.1038/s41467-020-16798-1.

Norovirus infection causes acute self-resolving diarrhea in wild-type neonatal mice

Affiliations

Norovirus infection causes acute self-resolving diarrhea in wild-type neonatal mice

Alexa N Roth et al. Nat Commun. .

Abstract

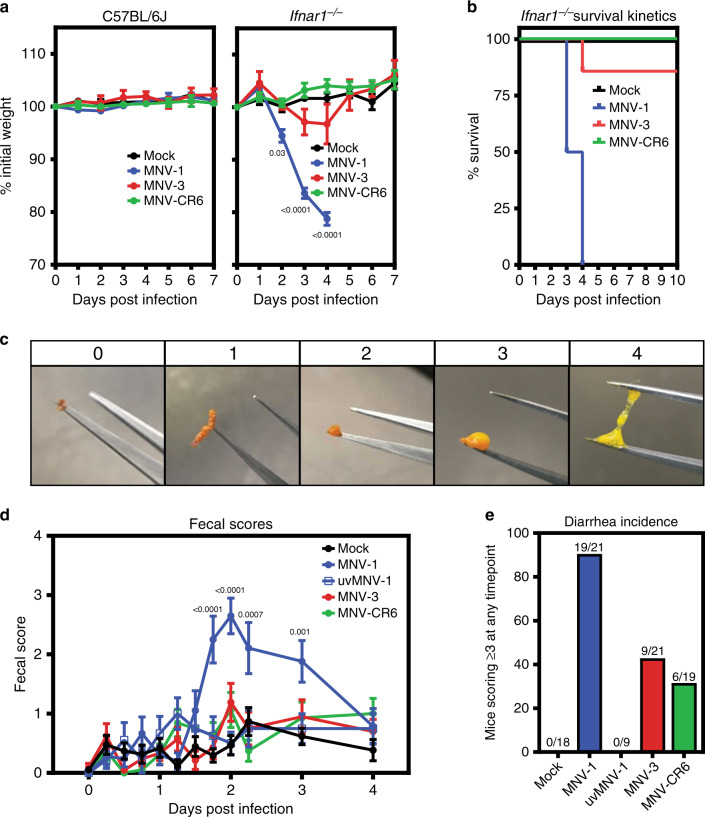
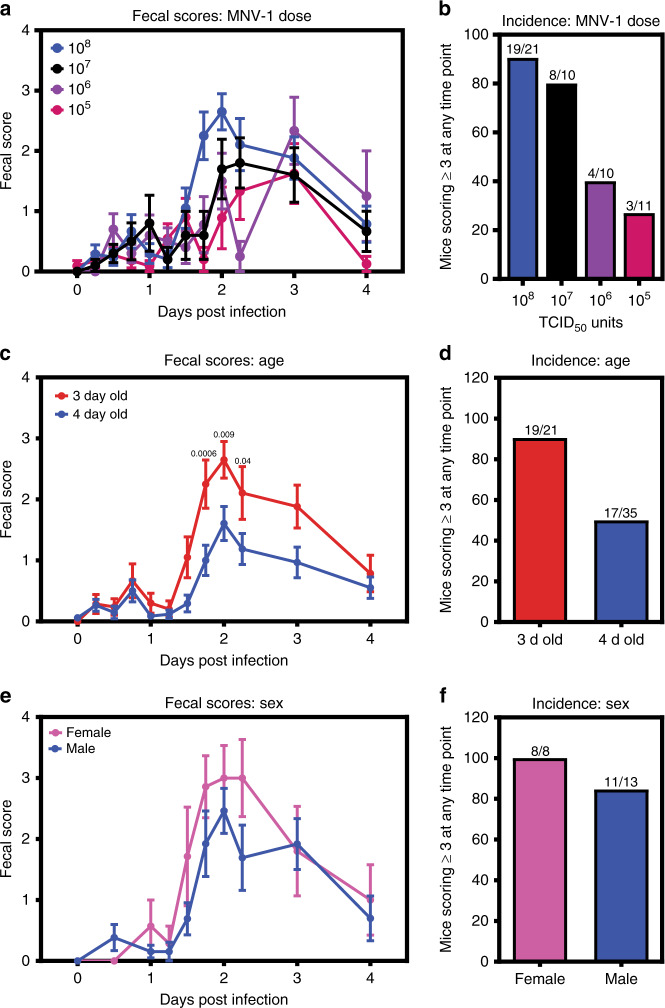
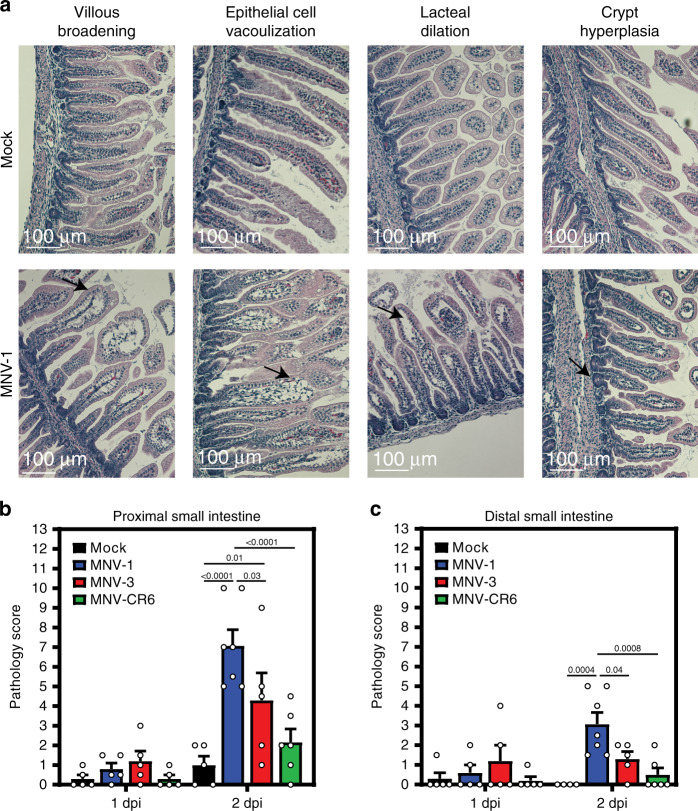
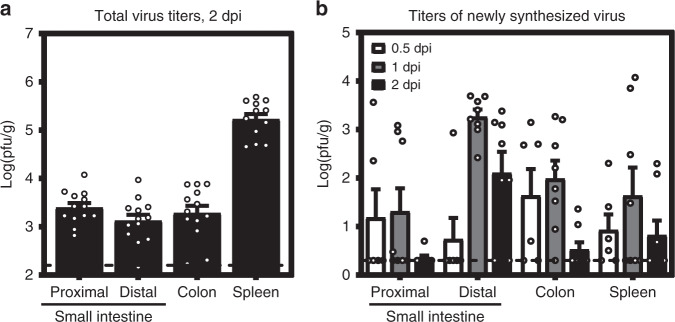
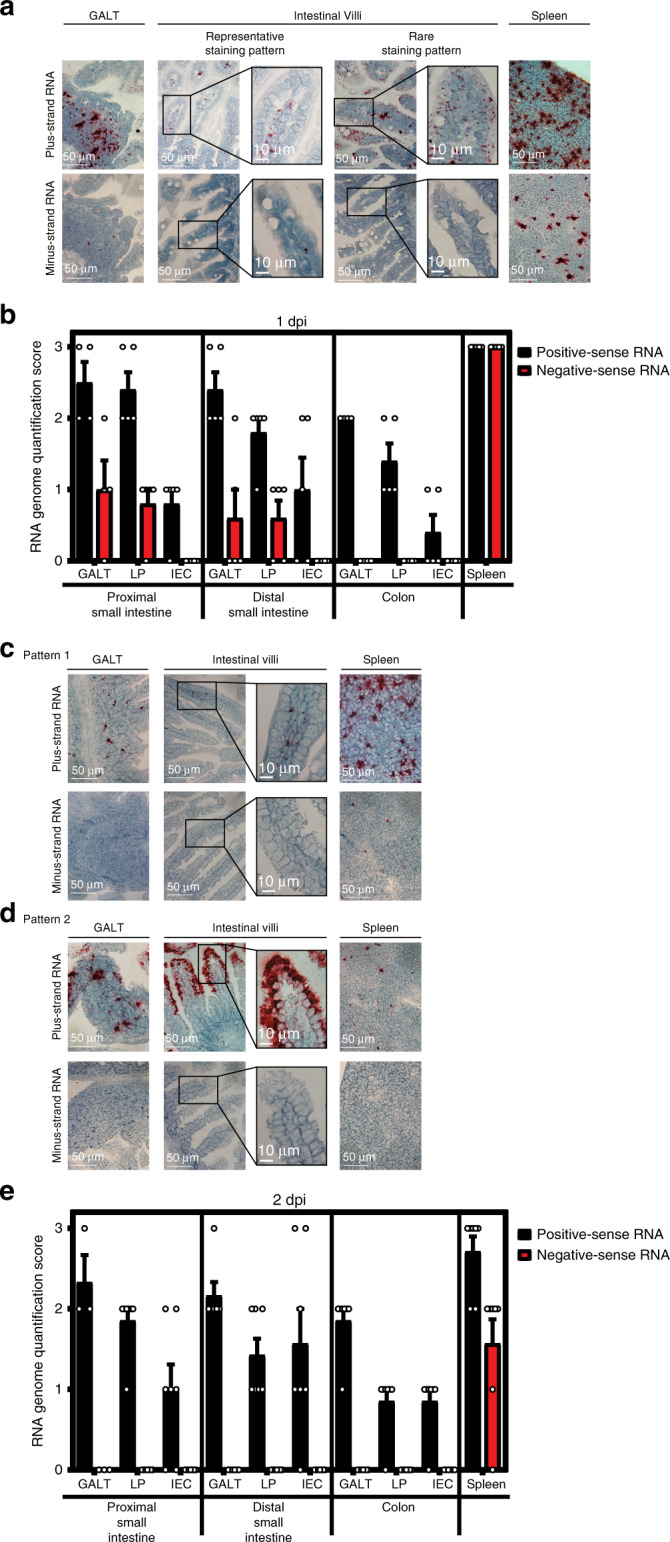
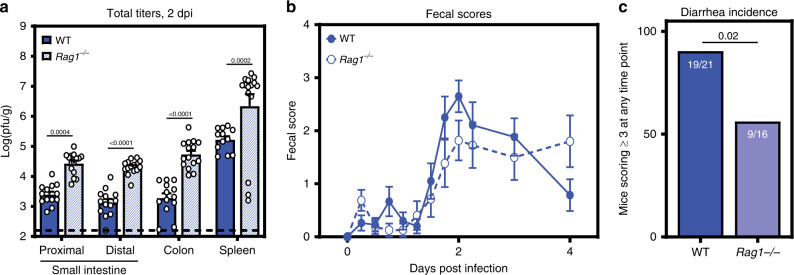
Human noroviruses are the leading cause of severe childhood diarrhea worldwide, yet we know little about their pathogenic mechanisms. Murine noroviruses cause diarrhea in interferon-deficient adult mice but these hosts also develop systemic pathology and lethality, reducing confidence in the translatability of findings to human norovirus disease. Herein we report that a murine norovirus causes self-resolving diarrhea in the absence of systemic disease in wild-type neonatal mice, thus mirroring the key features of human norovirus disease and representing a norovirus small animal disease model in wild-type mice. Intriguingly, lymphocytes are critical for controlling acute norovirus replication while simultaneously contributing to disease severity, likely reflecting their dual role as targets of viral infection and key components of the host response.


Conflict of interest statement

The authors declare no competing interests.

Figures

Fig. 1
Fig. 1. MNV infection causes disease in a virus strain-dependent manner.
a, b Groups of C57BL/6J (n = 6 for mock, n = 8 for MNV-1, n = 6 for MNV-3, n = 8 for MNV-CR6) or C57BL/6J-Ifnar−/− (n = 6 for mock, n = 8 for MNV-1, n = 7 for MNV-3, n = 7 for MNV-CR6) mice were perorally infected with 107 TCID50 units of MNV-1 (blue), MNV-3 (red), MNV-CR6 (green), or mock (black) inoculum and followed for weight loss (a) and survival (b). c Representative images of fecal samples indicating each score used to assess for diarrhea are shown. d, e Groups of 3-day-old BALB/c pups were infected with 108 TCID50 units of MNV-1 (blue), UV-inactivated MNV-1 (white with blue border), MNV-3 (red), MNV-CR6 (green), or mock (black) inoculum by oral gavage. Pups (n = 19 for mock, n = 21 for MNV-1, n = 9 for UV-inactivated MNV-1, n = 21 for MNV-3, n = 19 for MNV-CR6) were monitored for fecal consistency by palpating their abdomens (d). The proportion of mice scoring a 3 or 4 at any time point over the 5 days course of infection is presented as the incidence of diarrhea (e). Error bars denote standard errors of mean in all figures. P values were determined using two-way ANOVA with corrections for multiple comparisons. Source data are provided as a Source data file.
Fig. 2
Fig. 2. Dose, host age, and sex influence MNV disease severity in neonatal mice.
a Groups of 3-day-old BALB/c pups were infected with 108 (n = 21, blue), 107 (n = 10, black), 106 (n = 10, purple), or 105 (n = 11, pink) TCID50 units of MNV-1 by oral gavage and monitored for fecal consistency by palpating their abdomens. b The proportion of mice scoring a 3 or 4 at any time point over the 5 days course of infection is presented as the incidence of diarrhea. c, d Data stratified by age from groups of 3- and 4-day-old BALB/c pups (n = 21 for 3-day old (red); n = 35 for 4-day old (blue)) infected with 108 TCID50 units of MNV-1 by oral gavage and monitored for fecal inconsistency. Data presented as fecal scores over time (c) and incidence (d). e, f Data stratified by sex (n = 8 for female (pink); n = 13 for male (blue)) from groups of 3-day-old BALB/c pups infected with 108 TCID50 units of MNV-1 by oral gavage and monitored for fecal inconsistency. Data presented as fecal scores over time (e) and incidence (f). Error bars denote standard errors of mean in all figures. P values were determined using two-way ANOVA with corrections for multiple comparisons. Source data are provided as a Source data file.
Fig. 3
Fig. 3. Neonatal mice infected with MNV-1 show pathological changes.
Small intestinal sections collected from neonates infected with 108 TCID50 units of MNV-1 (blue), MNV-3 (red), MNV-CR6 (green), or mock (black) inoculum at 1 dpi (n = 5 for mock, n = 5 for MNV-1, n = 5 for MNV-3, n = 5 for MNV-CR6) and 2 dpi (n = 5 for mock, n = 7 for MNV-1, n = 5 for MNV-3, n = 6 for MNV-CR6) were stained with hematoxylin and eosin. Representative images of notable pathology are shown (a). Sections were scored blindly by an animal veterinarian for pathological changes in the proximal small intestine (b) and distal small intestine (c). Scale bars denote 100 µm. Error bars denote standard errors of mean in all figures. P values were determined using two-way ANOVA with corrections for multiple comparisons. Source data are provided as a Source data file.
Fig. 4
Fig. 4. MNV-1 establishes productive infection in neonatal mice.
a Three-day-old BALB/c pups (n = 13) were infected with 108 TCID50 units of MNV-1. At 2 dpi, viral titers were determined in the indicated segments of the intestinal tract and spleen by plaque assay. b Three-day-old BALB/c pups were infected with 2.5 × 104 pfu of neutral red-labeled MNV-1 by oral gavage At 0.5 dpi (n = 5, white), 1 dpi (n = 8, gray), and 2 dpi (n = 8, black), plaque assays were used to measure newly synthesized virus. Error bars denote standard errors of mean in all figures. Source data are provided as a Source data file.
Fig. 5
Fig. 5. MNV-1 replicates in intestinal subepithelial cells and splenocytes.
Tissue sections from mock-inoculated or MNV-1-infected mice collected at 1 dpi (a, b; n = 5 per group) and 2 dpi (ce; n = 7 per group) were probed for viral positive-sense and negative-sense RNA. Representative images of gut-associated lymphoid tissue (GALT), intestinal villi, and splenic tissue are shown for 1 dpi (a) and at 2 dpi for 2 distinct patterns (c, d). The amount of positive-sense (black) and negative-sense (red) viral RNA detected was scored for each pup, as described in the “Methods” at 1 dpi (b) and 2 dpi (e). Scale bars represent 50 µm for all images except for insets where they represent 10 µm. Error bars denote standard errors of mean in all figures. Source data are provided as a Source data file.
Fig. 6
Fig. 6. MNV-1 infected Rag1−/− pups show decreased diarrhea but increased viral titers.
a Groups of 3-day-old BALB/c-Rag1−/− pups (blue stripes) were infected with 108 TCID50 units MNV-1 by oral gavage. At 2 dpi (n = 15), total viral titers were determined in the indicated segments of the intestinal tract and spleen by plaque assay, and compared with those of wild-type BALB/c pups (solid blue). b, c Additional BALB/c-Rag1−/− pups (n = 16, open circles) were infected with 108 TCID50 units MNV-1 by oral gavage and monitored for fecal consistency over a 5-day time course by palpating their abdomens. Fecal scores (b) and diarrhea incidence (c) were compared with those in wild-type BALB/c pups (solid blue). Error bars denote standard errors of mean in all figures. P values were determined using two-way ANOVA with corrections for multiple comparisons for viral titers. For incidence, P values were determined using a Mantel-Cox test. Source data are provided as a Source data file.

References

    1. Koo HL, et al. Noroviruses: the most common pediatric viral enteric pathogen at a large university hospital after introduction of rotavirus vaccination. J. Pediatr. Infect. Dis. Soc. 2013;2:57–60. doi: 10.1093/jpids/pis070. - DOI - PMC - PubMed
    1. Patel MM. Systematic literature review of role of noroviruses in sporadic gastroenteritis. Emerg. Infect. Dis. 2008;14:1224–1231. doi: 10.3201/eid1408.071114. - DOI - PMC - PubMed
    1. Ahmed SM, et al. Global prevalence of norovirus in cases of gastroenteritis: a systematic review and meta-analysis. Lancet Infect. Dis. 2014;14:725–730. doi: 10.1016/S1473-3099(14)70767-4. - DOI - PMC - PubMed
    1. Cheetham S, et al. Pathogenesis of a genogroup II human norovirus in gnotobiotic pigs. J. Virol. 2006;80:10372–10381. doi: 10.1128/JVI.00809-06. - DOI - PMC - PubMed
    1. Seo DJ, et al. Experimental miniature piglet model for the infection of human norovirus GII. J. Med. Virol. 2018;90:655–662. doi: 10.1002/jmv.24991. - DOI - PubMed

Publication types