. 2020 Jun 11;3(1):302.
doi: 10.1038/s42003-020-1036-8.

Diverse panicle architecture results from various combinations of Prl5/GA20ox4 and Pbl6/APO1 alleles

Affiliations

Diverse panicle architecture results from various combinations of Prl5/GA20ox4 and Pbl6/APO1 alleles

Ayumi Agata et al. Commun Biol. .

Abstract

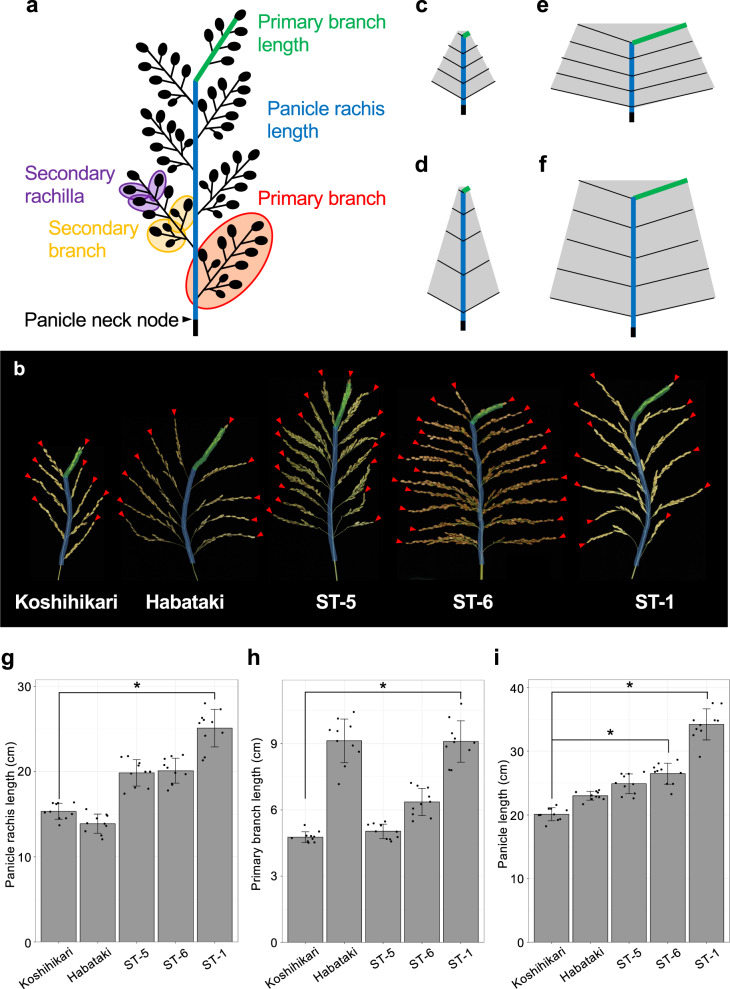
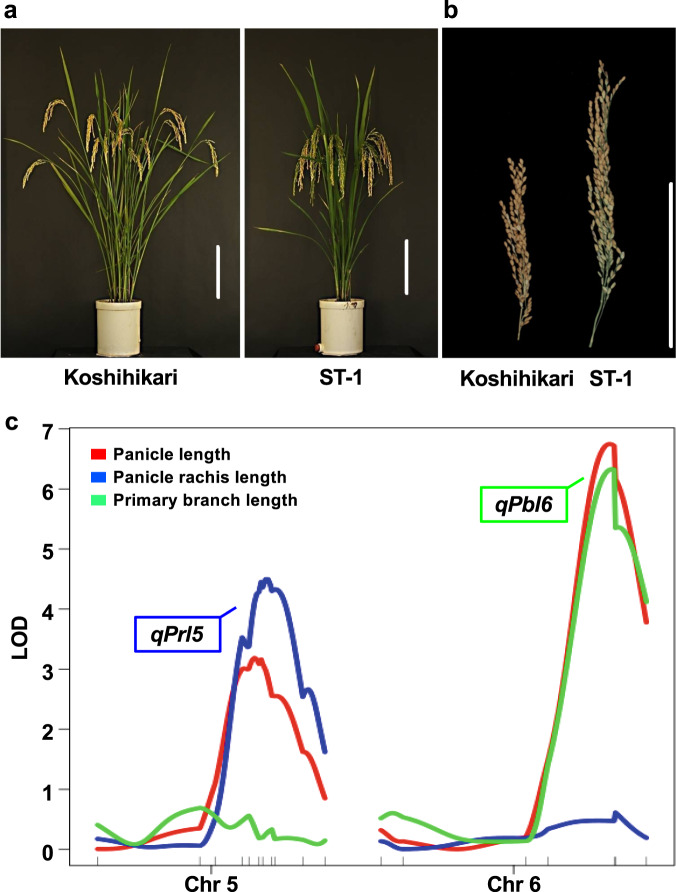
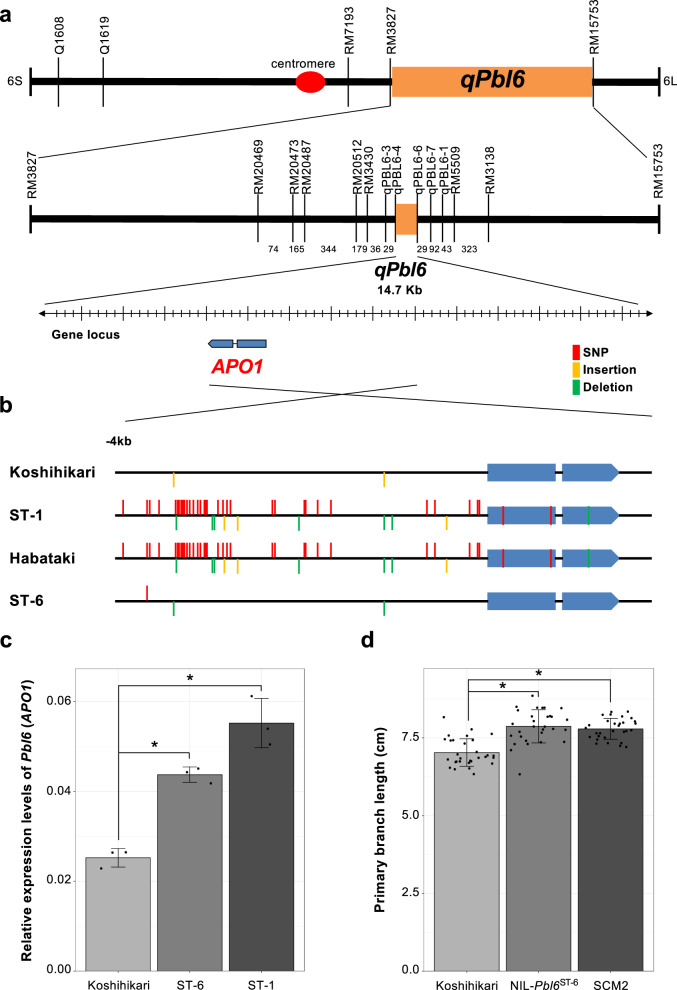
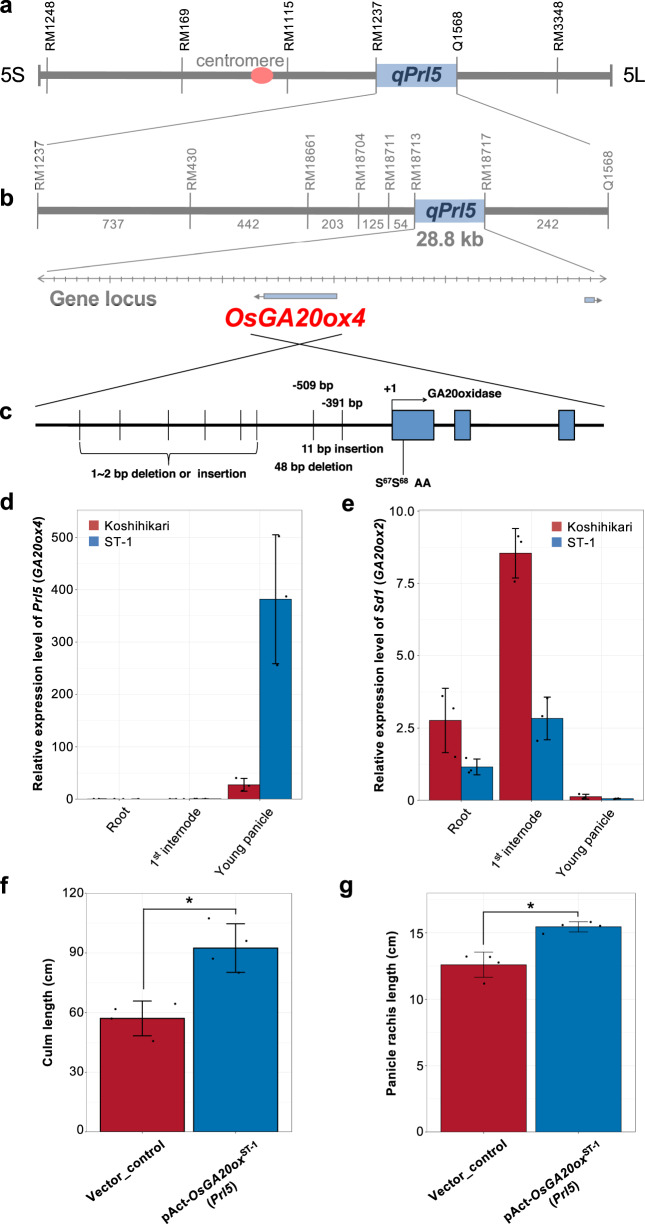
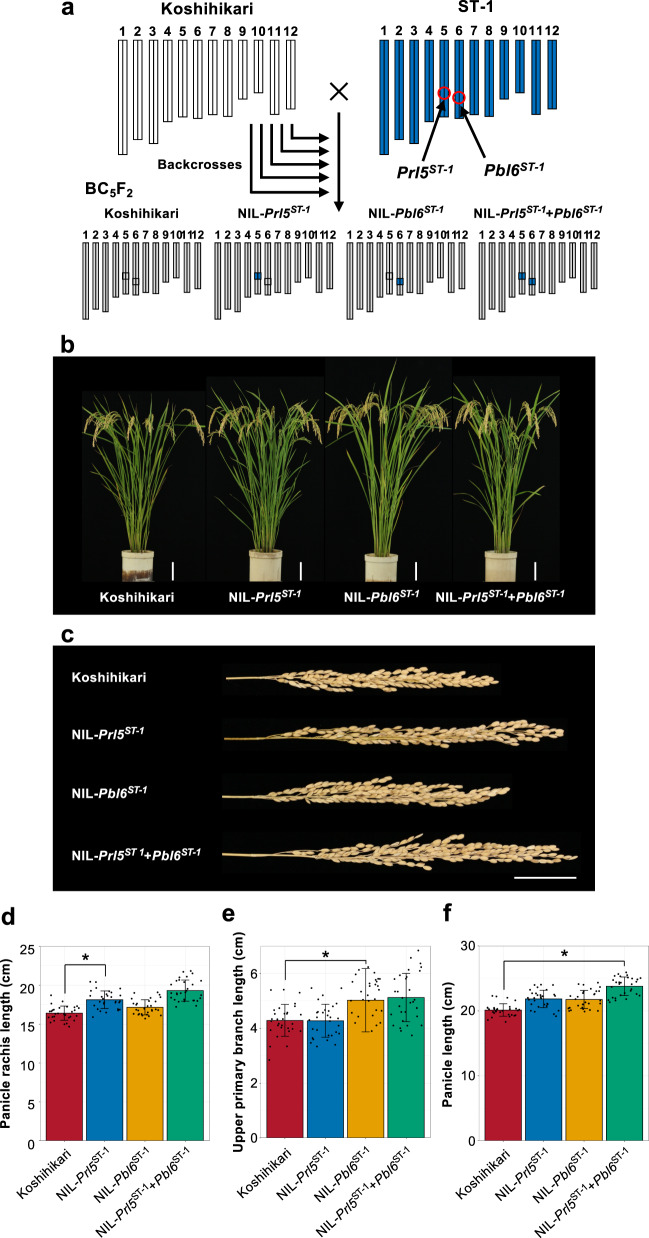
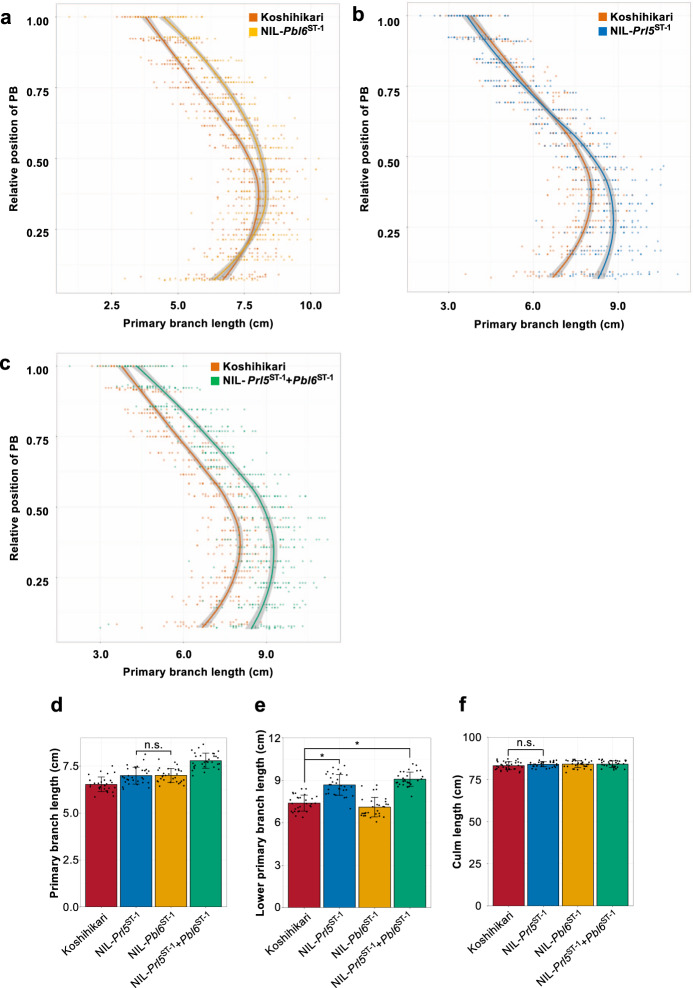
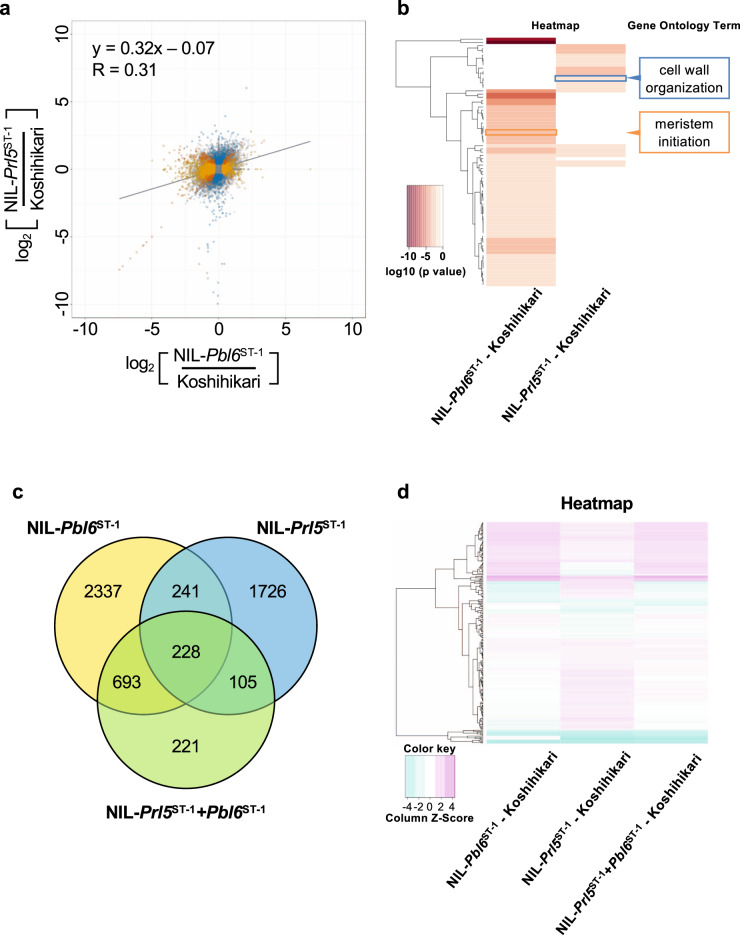
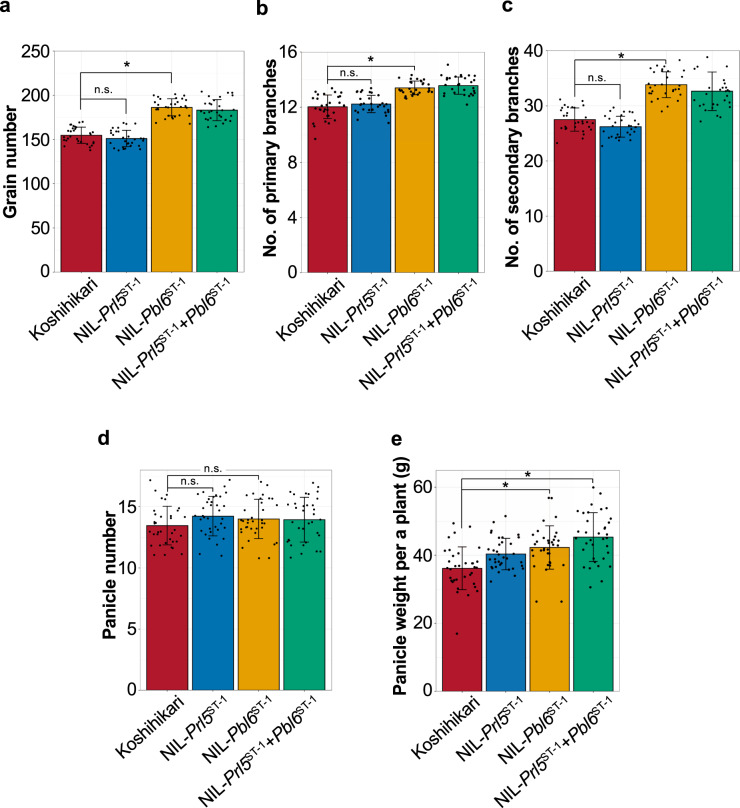
Panicle architecture directly affects crop productivity and is a key target of high-yield rice breeding. Panicle length strongly affects panicle architecture, but the underlying regulatory mechanisms are largely unknown. Here, we show that two quantitative trait loci (QTLs), PANICLE RACHIS LENGTH5 (Prl5) and PRIMARY BRANCH LENGTH6 (Pbl6), independently regulate panicle length in rice. Prl5 encodes a gibberellin biosynthesis enzyme, OsGA20ox4. The expression of Prl5 was higher in young panicles resulting in panicle rachis elongation. Pbl6 is identical to ABERRANT PANICLE ORGANIZATION 1 (APO1), encoding an F-box-containing protein. We found a novel function that higher expression of Pbl6 is responsible for primary branch elongation. RNA-seq analysis revealed that these two genes independently regulate panicle length at the level of gene expression. QTL pyramiding of both genes increased panicle length and productivity. By combining these two genes in various combinations, we designed numerous panicle architecture without trade-off relationship.


Conflict of interest statement

The authors declare no competing interests.

Figures

Fig. 1
Fig. 1. Characterization of rice panicle architecture.
a Schematic diagram of a rice inflorescence. b Panicle phenotypes of five natural rice varieties. Green bars indicate the primary branch tips. Blue bars indicate panicle rachises. Red arrowheads indicate primary branches. Scale bar: 5 cm. cf Diagram of four types of panicle architecture with different panicle lengths. Panel d has a longer panicle rachis than c. Panel e has longer primary branches than c. Panel f has a longer panicle rachis and primary branches than c. gi Comparison of panicle traits. g Panicle rachis length. h Primary branch length. i Panicle length. Error bars represent means ± SD (n = 10 plants). *Significant at the 5% level (Tukey’s significant difference test).
Fig. 2
Fig. 2. QTL analysis.
a Gross morphologies of Koshihikari and ST-1. Scale bar: 20 cm. b Panicle morphologies of Koshihikari and ST-1. Scale bar: 20 cm. c QTL locations for panicle length, panicle rachis length, and primary branch length. Red bars indicate results for panicle length. Blue bars indicate results for panicle rachis length. Green bars indicate results for primary branch length, respectively. QTLs for panicle length and panicle rachis length were detected at the same position on chromosome 5. QTLs for panicle length and primary branch length were detected at the same position on chromosome 6.
Fig. 3
Fig. 3. Isolation and characterization of Pbl6.
a The qPbl6 locus was detected between RM3827 and RM15753 on Chromosome 6. Numbers on the map indicate the number of recombinants. Positional cloning narrowed the qPbl6 locus to a 14.7-kb region between qPBL6-4 and qPBL6-6 using 2475 plants. Only one gene was predicted to be located in this region by RAP-DB. b Sequence differences between Koshihikari, ST-1, Habataki, and ST-6 around the APO1 region. c Relative expression of Pbl6 (APO1) during the primary branch initiation stage by quantitative RT-PCR. Relative expression levels were calibrated based on Ubiquitin expression. d Comparison of primary branch length between Koshihikari, NIL-Pbl6ST-6 and SCM2. n = 3 in c. n = 30 plants in d. Error bars represent means ± SD. *Significant at the 5% level (Tukey’s significant difference test).
Fig. 4
Fig. 4. Isolation and characterization of Prl5.
a The qPrl5 locus was detected between RM1237 and Q1568 on chromosome 5. b Numbers on the map indicate the number of recombinants. Positional cloning narrowed the qPrl5 locus to a 28.8-kb region between RM18713 and RM18717 using 1900 plants. Two genes were predicted to be located in this region by RAP-DB. c Sequence differences between Koshihikari and ST-1 around the OsGA20ox4 region. d, e Expression analysis of Prl5 (GA20ox4) (d) and Sd1 (GA20ox2) (e) in roots, first internodes, and young panicles. Relative expression levels were calibrated based on Ubiquitin expression. Error bars represent means ± SD (n = 3). f, g Comparison of culm length (f) and panicle rachis length (g) between plants transformed with an empty vector (vector control) and expression vector for OsGA20ox4ST-1 under the control of the Actin promoter. Error bars represent means ± SD (n = 4 plants). *Significant at the 5% level (Student’s t-test).
Fig. 5
Fig. 5. Expression analysis of Prl5 and Pbl6.
a, b Expression analysis of Prl5 (a) and Pbl6 (b) in inflorescence tissue at various developmental stages. PB primary branch initiation stage, SBE secondary branch initiation earlier stage, SBL secondary branch initiation later stage, YP3.0: 3 mm stage of young panicles. Relative expression levels were calibrated based on Ubiquitin expression (a, b). Error bars represent means ± SD (n = 3). *Significant at the 5% level (Student’s t-test). cj In situ hybridization of Prl5 (cf) and Pbl6 (gj) during panicle development in Koshihikari. Panels c and g are at the stage of primary branch differentiation. Panels d and h are at the earlier stage of secondary branch differentiation. Panels e and i are at the later stage of secondary branch differentiation. Panels f and j are close-up views of vascular bundles at the later stage of secondary branch differentiation. Scale bars: 100 μm.
Fig. 6
Fig. 6. Effects of the two genes on panicle architecture under field conditions.
a Graphical genotypes of BC5F2 plants derived from a cross between Koshihikari and ST-1. White and blue bars indicate Koshihikari and ST-1 chromosomes, respectively. Red circles on ST-1 indicate the positions of Prl5ST-1 and Pbl6ST-1. b Gross morphologies of the NILs. Scale bar: 10 cm. c Panicle morphologies of the NILs. Scale bar: 5 cm. df Comparison of panicle traits. d Panicle rachis length. e Lengths of the three upper primary branches. f Panicle length. Error bars represent means ± SD (n = 30 plants). *Significant at the 5% level (Tukey’s significant difference test).
Fig. 7
Fig. 7. Effects of the two genes on primary branch elongation.
ac Comparison of every primary branch length. Solid lines show regression curves. Orange line and dots indicate Koshihikari. Yellow line and dots indicate NIL-Pbl6ST-1 (a). Blue line and dots indicate NIL-Prl5ST-1 (b). Green line and dots indicate NIL-Prl5ST-1 + Pbl6ST-1 (c). n = 42 plants. df Comparison of panicle traits and culm length. d every primary branch length. e Lower three primary branch length. f Culm length. Error bars represent means ± SD (n = 30 plants in d and e, n = 35 plants in f). *Significant at the 5% level (Tukey’s significant difference test).
Fig. 8
Fig. 8. Comparison of the gene expression patterns of the NILs.
a RNA was extracted from 2-mm stage young panicles of Koshihikari, NIL-Prl5ST-1, NIL-Pbl6ST-1, and NIL-Prl5ST-1 + Pbl6ST-1 and used for RNA sequencing. The y axis shows the log2 ratios of the changes in gene expression between Koshihikari and NIL-Prl5ST-1, whereas the x axis shows the log2 ratios of the changes in gene expression between Koshihikari and NIL-Pbl6ST-1. The solid line represents the regression line. y = 0.32 X −0.07, R = 0.31. Yellow dots indicate genes whose expression levels changed in NIL-Pbl6ST-1 compared with Koshihikari. Blue dots represent genes whose expression levels changed in NIL-Prl5ST-1 compared with Koshihikari. Orange dots represent common genes whose expression levels changed in both NIL-Prl5ST-1 and NIL-Pbl6ST-1. Gray dots represent other genes. b Heatmap show the P-value (P < 0.05 cutoff) significance of GO terms for Prl5 and Pbl6 target genes. The GO terms listed are the characteristic enriched biological process GO terms for each Prl5 (blue) and Pbl6 (orange). The complete GO term lists and their significance levels are given in Supplementary Data 3. c Venn diagram of genes upregulated or downregulated in NIL-Prl5ST-1 (shown in the blue circle), NIL-Pbl6ST-1 (shown in the yellow circle), and NIL-Prl5ST-1 + Pbl6ST-1 (shown in the green circle). d Heatmap of the expression patterns of the 228 common genes. The expression levels of these 228 genes changed in all three NILs compared with Koshihikari. The expression level of each gene compared with expression in Koshihikari is shown on the map. Red and blue indicate higher and lower expression, respectively. A color scale is shown at the bottom.
Fig. 9
Fig. 9. Effects of two genes on yield performance under field conditions.
ae Comparison of yield traits. a Grain number. b Number of primary branches. c Number of secondary branches. d Panicle number. e Panicle weight per plant. n = 30 plants in ac; n = 35 plants in d, e. Error bars represent means ± SD. *Significant at the 5% level (Tukey’s significant difference test).
Fig. 10
Fig. 10. Various panicle architectures are generated by Prl5 and Pbl6.
Blue lines indicate the effects of Prl5 and green lines indicate the effects of Pbl6.

References

    1. Ikeda M, et al. Analysis of rice panicle traits and detection of QTLs using an image analyzing method. Breed. Sci. 2010;60:55–64. doi: 10.1270/jsbbs.60.55. - DOI
    1. Ashikari M, et al. Cytokinin oxidase regulates rice grain production. Science. 2005;309:741–745. doi: 10.1126/science.1113373. - DOI - PubMed
    1. Miura K, et al. OsSPL14 promotes panicle branching and higher grain productivity in rice. Nat. Genet. 2010;42:545–549. doi: 10.1038/ng.592. - DOI - PubMed
    1. Ookawa T, et al. New approach for rice improvement using a pleiotropic QTL gene for lodging resistance and yield. Nat. Commun. 2010;1:132. doi: 10.1038/ncomms1132. - DOI - PMC - PubMed
    1. Ikeda-Kawakatsu K, et al. Expression level of ABERRANT PANICLE ORGANIZATION1 determines rice inflorescence form through control of cell proliferation in the meristem. Plant Physiol. 2009;150:736–747. doi: 10.1104/pp.109.136739. - DOI - PMC - PubMed

Publication types