. 2020 Jun 11;11(1):2954.
doi: 10.1038/s41467-020-16774-9.

Transfer functions linking neural calcium to single voxel functional ultrasound signal

Affiliations

Transfer functions linking neural calcium to single voxel functional ultrasound signal

Ali-Kemal Aydin et al. Nat Commun. .

Abstract

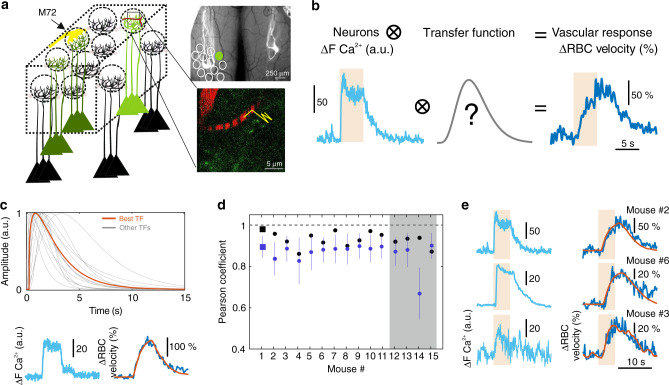
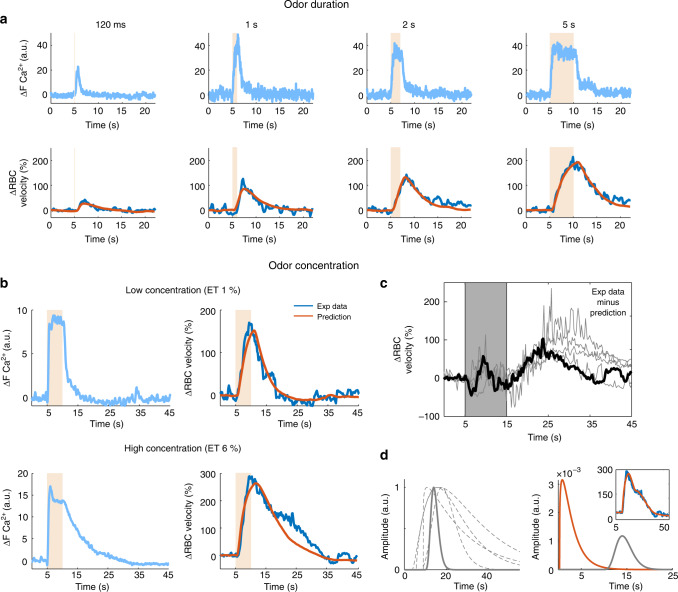
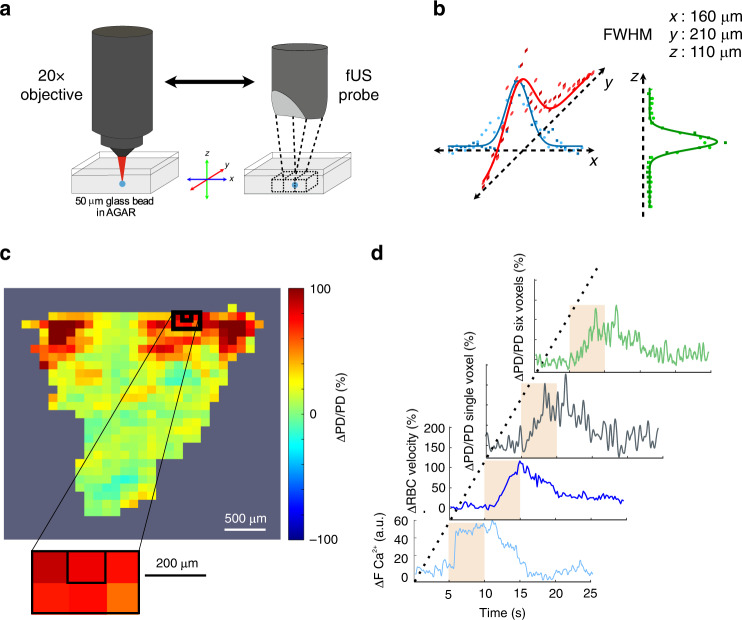
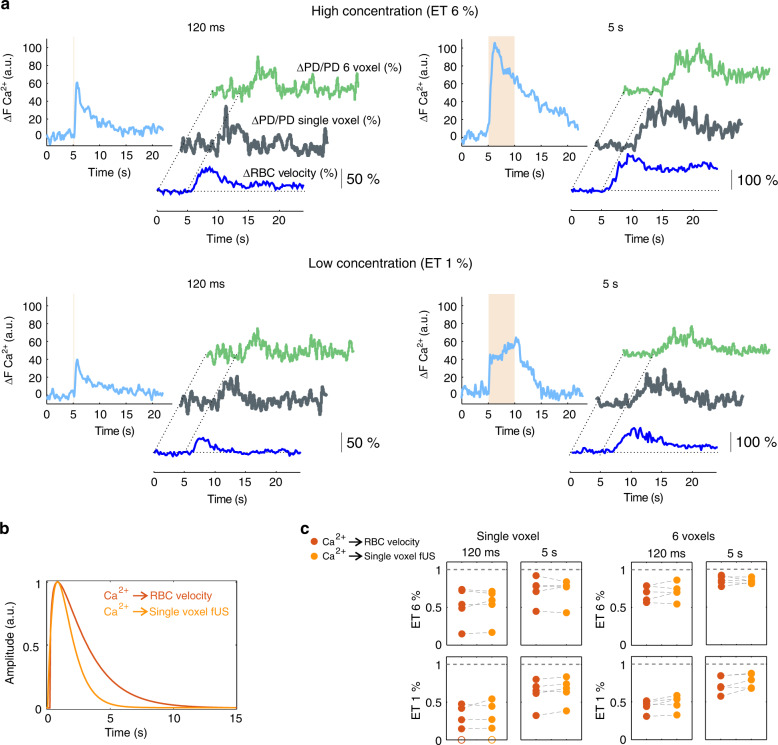
Functional ultrasound imaging (fUS) is an emerging technique that detects changes of cerebral blood volume triggered by brain activation. Here, we investigate the extent to which fUS faithfully reports local neuronal activation by combining fUS and two-photon microscopy (2PM) in a co-registered single voxel brain volume. Using a machine-learning approach, we compute and validate transfer functions between dendritic calcium signals of specific neurons and vascular signals measured at both microscopic (2PM) and mesoscopic (fUS) levels. We find that transfer functions are robust across a wide range of stimulation paradigms and animals, and reveal a second vascular component of neurovascular coupling upon very strong stimulation. We propose that transfer functions can be considered as reliable quantitative reporters to follow neurovascular coupling dynamics.


Conflict of interest statement

M.T. is co-founder and shareholder in the ICONEUS company. The remaining authors declare no competing interests.

Figures

Fig. 1
Fig. 1. The transfer function between neuronal and vascular responses within a single glomerulus: computation and robustness across mice.
a Left, schematics of the dorsal olfactory bulb (OB) of a mouse expressing YFP and GCaMP6f under the control of M72 and Thy1 promoters, respectively. Depending on the odor concentration, ethyl tiglate (ET) activates several glomeruli or only the most responsive one, which is in close vicinity to the M72 glomerulus. Right top, axons converging in the two M72 glomeruli are imaged with a stereoscope through a chronically implanted PMP window (photographs were taken for all mice). Right bottom, an image showing a capillary labeled with Texas red. A broken line is used in the linescan acquisition mode to monitor Ca2+ in the neuropil (dendritic GCaMP6f) and RBC velocity in the capillary. b For each mouse, a microscopic transfer function (μTF) is convolved with Ca2+ signals, the μTF being optimized to predict RBC velocity changes in response to odor 1% ET (5 s). c Top, μTFs optimized for each mouse (n = 15). The orange curve is the μTF optimized from Ca2+ and RBC velocity responses illustrated in bottom, which gives the prediction curve overlaid in orange on the RBC response. d Quantification (mean ± SD, n = 15 mice) of prediction robustness for each μTFs optimized using either the TF derived from the same mouse (black symbols, single self prediction) or data from other mice (blue symbols, mean cross-validation). The μTF from mouse #1 (square symbols) gives the best ‘self’ vascular prediction (see c) and good predictions across mice. It was selected as the standard μTF to predict vascular responses from Ca2+ responses. Gray shadow (#12–15) for Pearson coefficients obtained with data acquired in mice from Boido et al, 2019. e Examples of vascular response predictions from three mice using the standard microscopic TF and optimized for the amplitude (see Methods). Source data are provided as a Source Data file.
Fig. 2
Fig. 2. Robustness of TFs with respect to stimulation duration and intensity.
a Ca2+ (top) and RBC velocity (bottom) responses to single sniff (120 ms), 1 s, 2 s, and 5 s odor stimulations. Using the standard μTF (optimized with ET 1%, 5 s), vascular response predictions (orange traces) are robust for all durations. b Increasing the odor concentration from 1% (top traces, average of two trials) to 6% ET (bottom traces, average of three trials) reveals a delayed secondary vascular response, which is not correctly predicted (orange trace) with the standard TF (1% ET, 5 s). c Vascular responses after subtraction of their prediction using the standard TF (n = 5 mice, data from b in black). Note that trace fluctuations between 5 and 15 s (gray background) result from slight differences of onset, slope, and response peak between real and predicted responses. The second vascular component is clearly delayed by ∼10 s. d Left, novel TFs optimized on vascular responses after subtraction (the thick trace is the TF from the data in b and c). Note the heterogeneity in peak jitter and shape. Right, combination of the two μTFs (standard μTF in orange, second component μTF in gray) can predict correctly the entire vascular response (see inset, same trace as in b) after adjustment of their corresponding amplitude.
Fig. 3
Fig. 3. Co-registration of fUS (single voxel) and two-photon imaging.
a Schematics of the two imaging systems. The ultrasonic probe is attached to the ×20 microscope objective by means of a 3D-printed holding system. A 50-μm glass bead, embedded in agar, is first localized with 2P imaging. The ultrasonic probe is then translated over the bead and placed at a position where the fUS signal maxima in x, y, and z are centered in a given voxel. The fUS and 2P imaging systems can then be displaced back and forth to the same co-registered location with a micrometric resolution. b Intensity profiles of fUS signals in x, y, z. FWHM for full width at half maxima. Square and circle points were acquired during back and forth acquisitions. c ΔPD/PD fUS activation map of an olfactory bulb coronal section in response to 1%, 5 s ET. The enlarged area shows the voxel centered on the most responsive glomerulus (first imaged with 2P) plus its five neighboring voxels. d From bottom to top, Ca2+ and RBC velocity glomerular responses (2P imaging), ΔPD/PD fUS responses from the co-registered voxel and the six voxels.
Fig. 4
Fig. 4. Co-registration of microscopic and mesoscopic vascular responses to odor.
a Microscopic responses were acquired in a glomerulus located in the center of a fUS voxel. The four panels illustrate Ca2+, RBC velocity, and the three types of fUS responses (from the specific co-registered single voxel and the group of six voxels) to four odor stimulation protocols (120 ms and 5 s stimulations at two concentrations). All responses increased with time and odor concentration. The ΔPD/PD fUS traces from single voxels are in bold. b Comparison of the μTF and the mesoscopic TF (MTF) optimized between ΔCa2+ (ET 1%, 5 s) and the co-registered single fUS voxel signal. c Prediction quality (Pearson coefficients) of single and six voxels fUS responses using either the μTF (red), the neuron-derived MTF (orange) (n = 5 mice). Note that in one mouse (bottom left plot), the single voxel signal ∼0 (open circles). Source data are provided as a Source Data file.
Fig. 5
Fig. 5. Spatial resolution of fUS responses.
a Quantification of fUS responses (area under the curve, ET 1%, 5 s) in the voxel containing the most sensitive glomerulus (outlined with a blue frame) and the five neighboring voxels (A–E, n = 5 mice, GL glomerular layer, EPL external plexiform layer). The color map shows that only in one case, the largest response was located in the blue voxel. The color bar was scaled with respect to the highest AUC value across the six voxels. b Statistical analysis (GLM) of fUS responses in the corresponding voxels using the RBC velocity response (CBV flowing at 0.5–1.5 mm s−1) as a regressor. The t value for the voxel containing the most sensitive glomerulus was not systematically the highest one. The applied statistical threshold was p < 0.01 + FWE correction. NS for not significant. c Quantification of fUS responses (AUC) for four stimulation conditions. For the five mice, the voxel containing the most sensitive glomerulus and the other five voxels were ranked with the 1st place assigned to the voxel with the highest AUC value. d Statistical quantification of fUS responses with ranking based on t values. The 1st place was assigned to the highest t value. Source data are provided as a Source Data file.

References

    1. Iadecola C. The neurovascular unit coming of age: a journey through neurovascular coupling in health and disease. Neuron. 2017;96:17–42. - PMC - PubMed
    1. Iadecola C, Yang G, Ebner TJ, Chen G. Local and propagated vascular responses evoked by focal synaptic activity in cerebellar cortex. J. Neurophysiol. 1997;78:651–659. - PubMed
    1. Chen BR, Kozberg MG, Bouchard MB, Shaik MA, Hillman EM. A critical role for the vascular endothelium in functional neurovascular coupling in the brain. J. Am. Heart Assoc. 2014;3:e000787. - PMC - PubMed
    1. Longden TA, et al. Capillary K+-sensing initiates retrograde hyperpolarization to increase local cerebral blood flow. Nat. Neurosci. 2017;20:717–726. - PMC - PubMed
    1. Rungta RL, Chaigneau E, Osmanski BF, Charpak S. Vascular compartmentalization of functional hyperemia from the synapse to the pia. Neuron. 2018;99:362–375. - PMC - PubMed

Publication types