. 2020 Jul;583(7814):115-121.
doi: 10.1038/s41586-020-2387-5. Epub 2020 Jun 11.

Neurons that regulate mouse torpor

Affiliations

Neurons that regulate mouse torpor

Sinisa Hrvatin et al. Nature. 2020 Jul.

Abstract

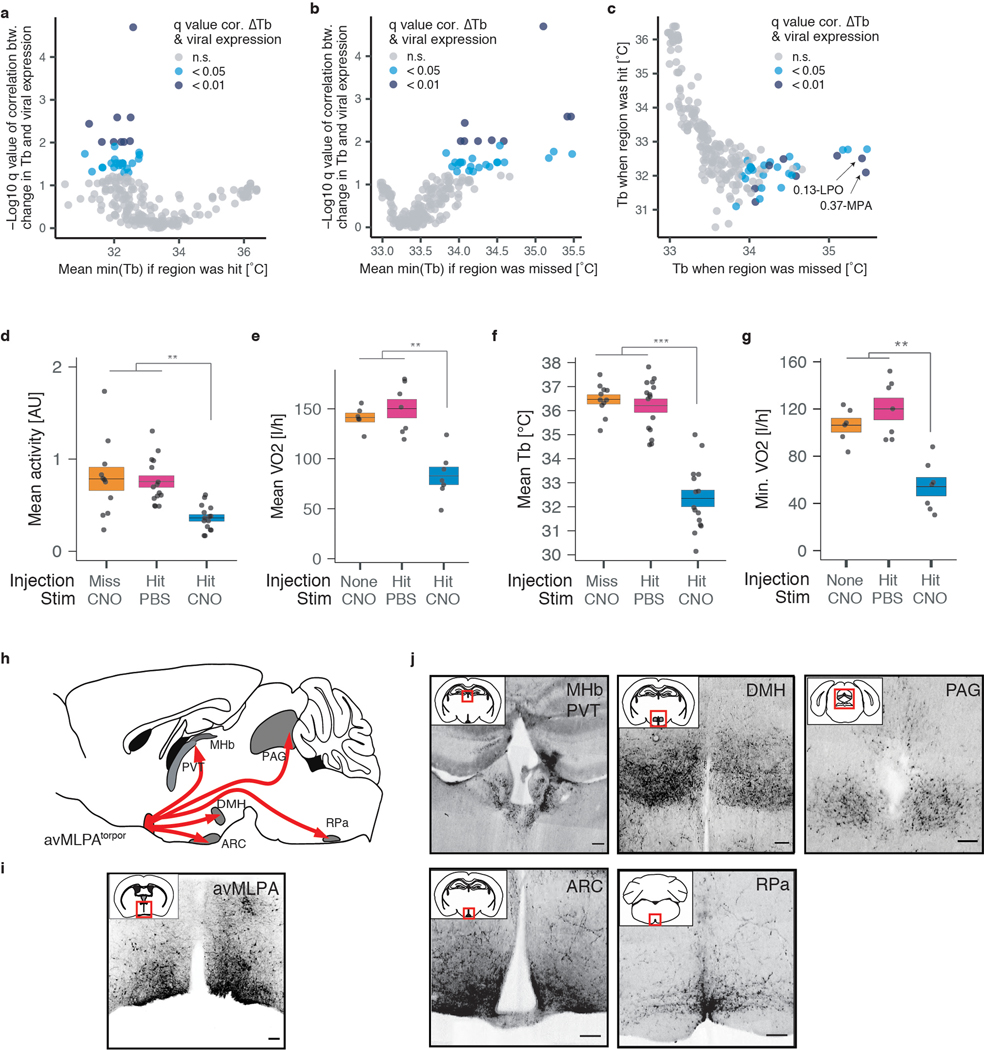
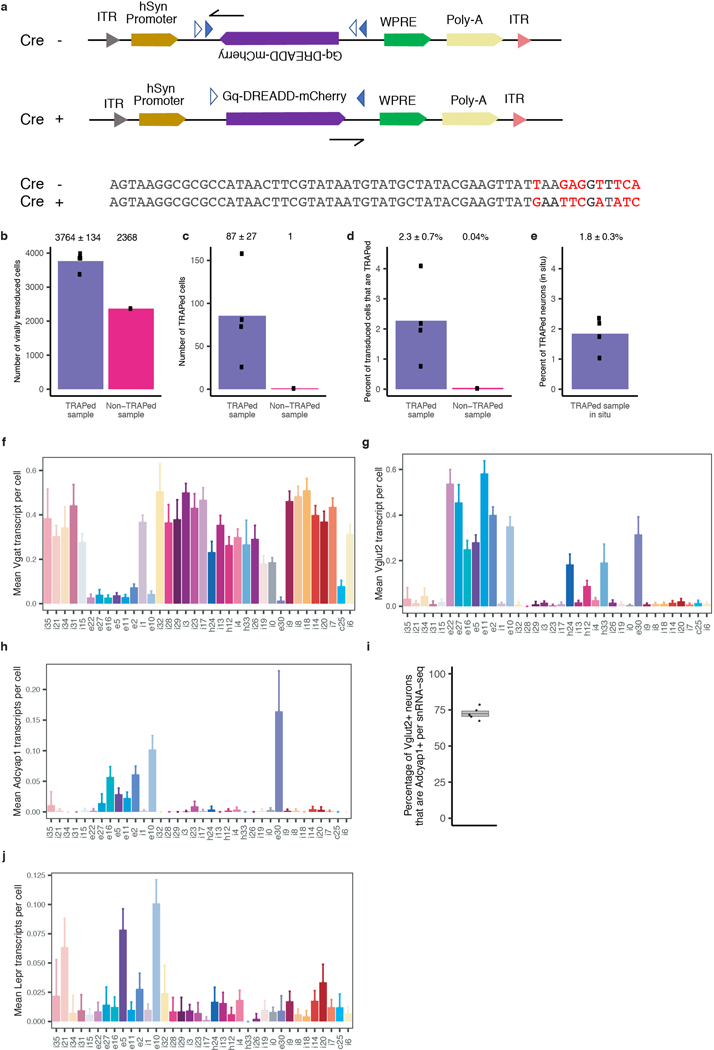
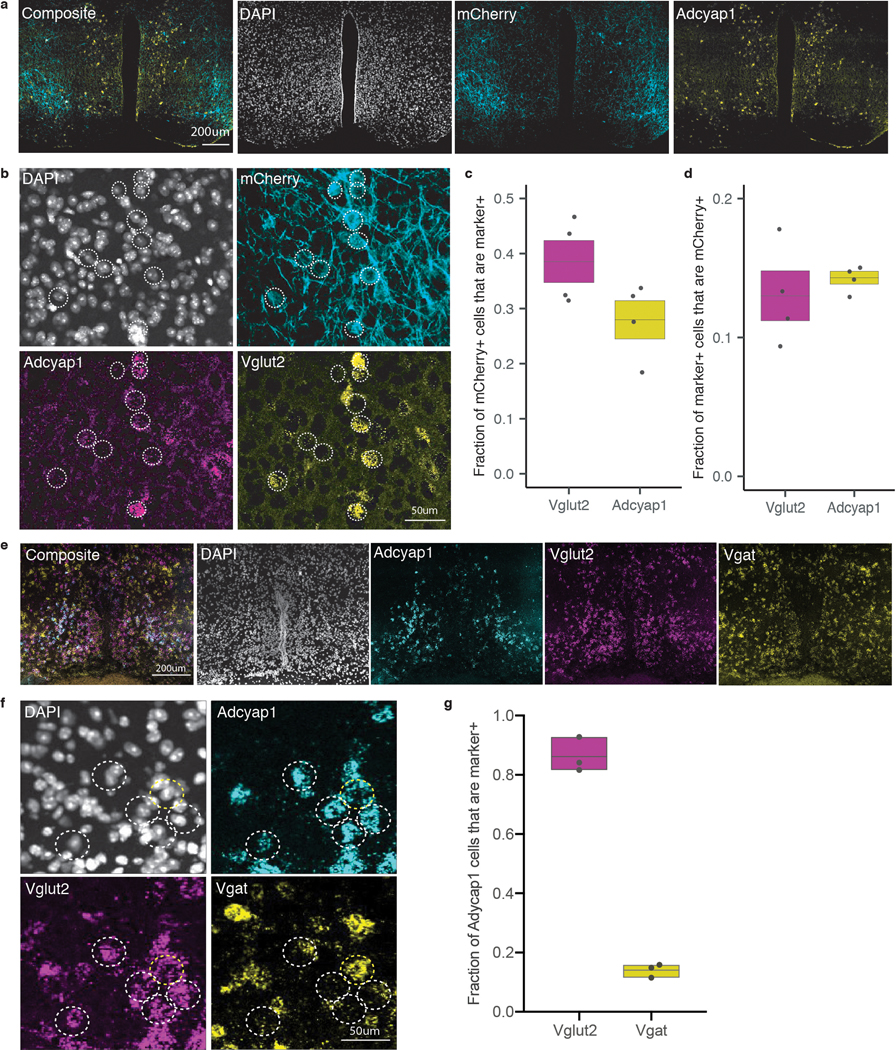
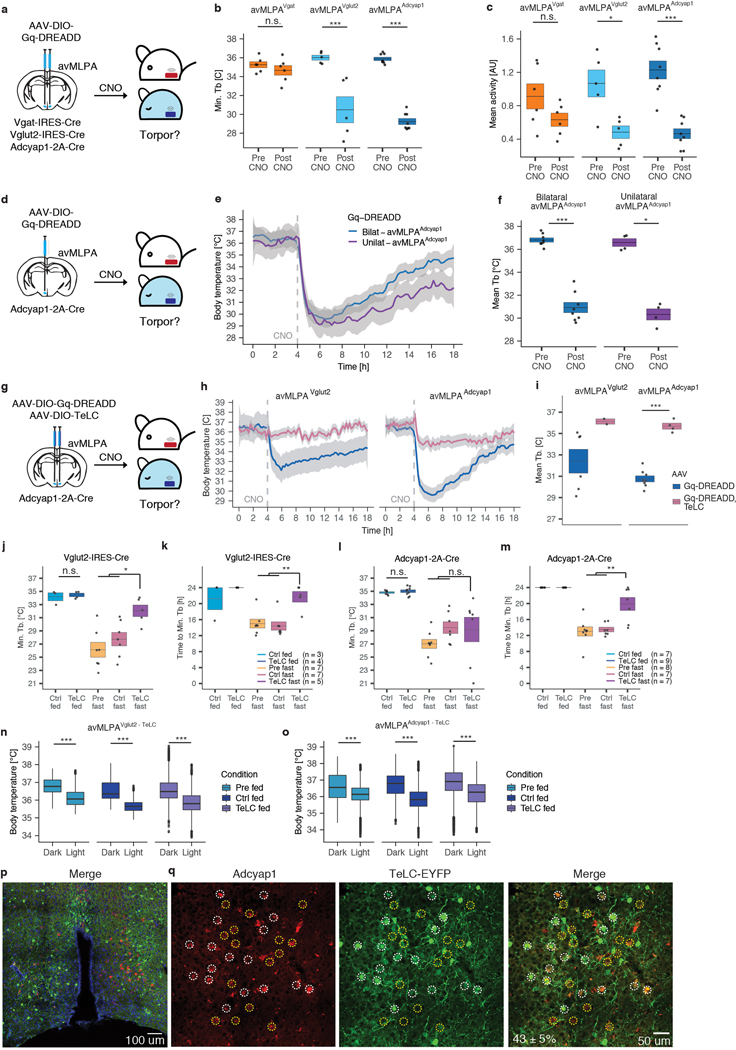
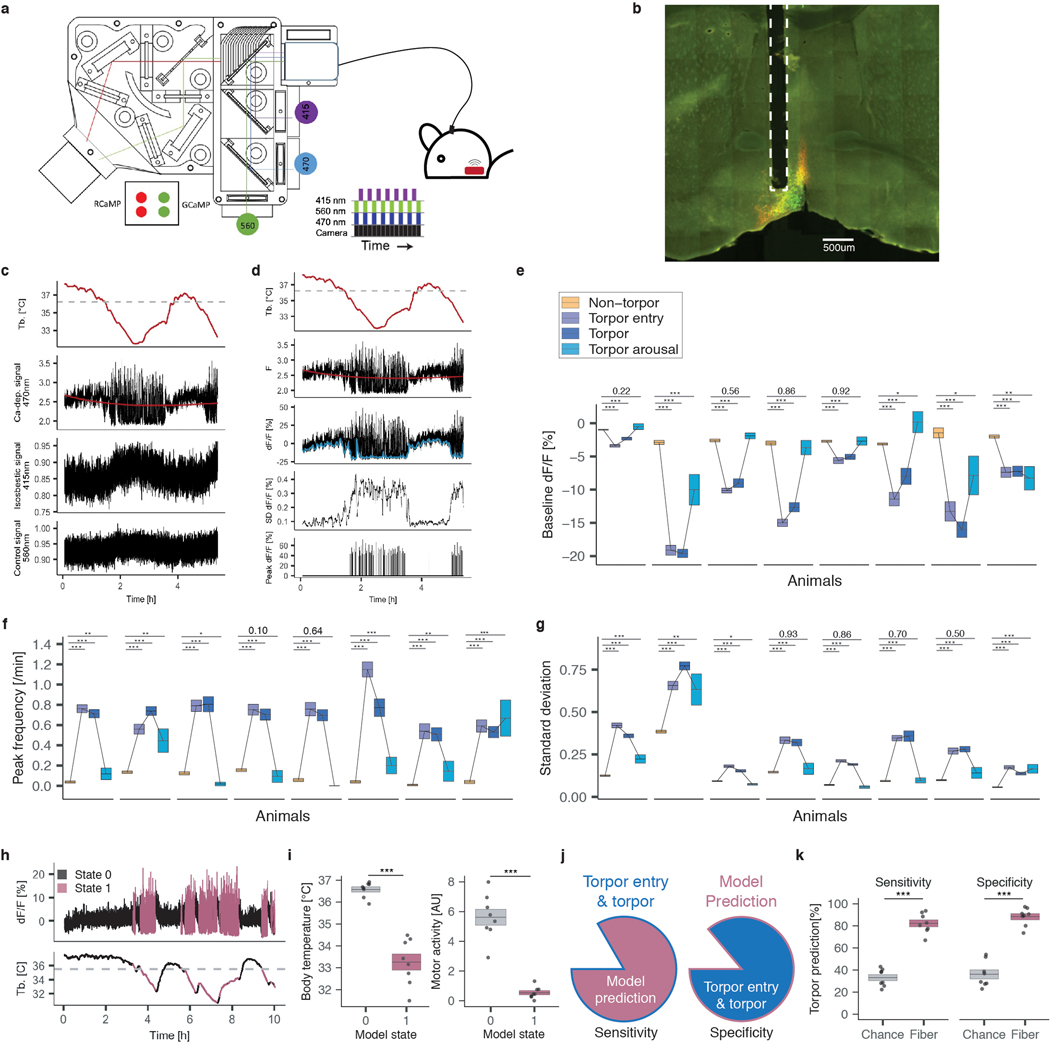
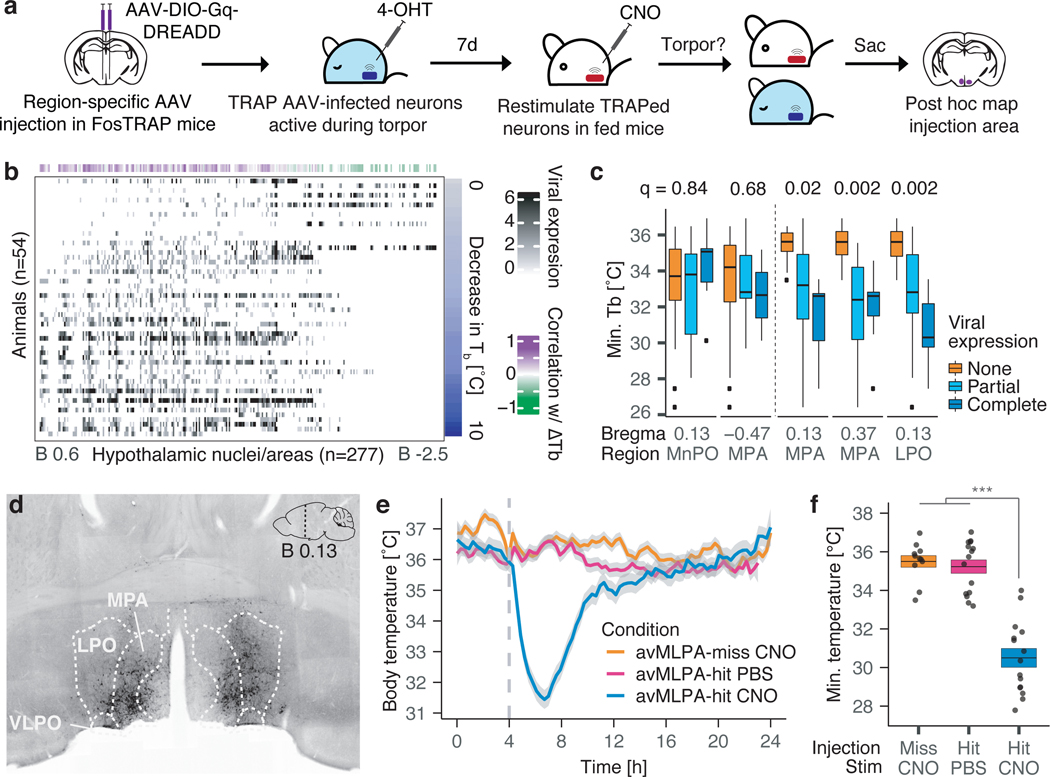
The advent of endothermy, which is achieved through the continuous homeostatic regulation of body temperature and metabolism1,2, is a defining feature of mammalian and avian evolution. However, when challenged by food deprivation or harsh environmental conditions, many mammalian species initiate adaptive energy-conserving survival strategies-including torpor and hibernation-during which their body temperature decreases far below its homeostatic set-point3-5. How homeothermic mammals initiate and regulate these hypothermic states remains largely unknown. Here we show that entry into mouse torpor, a fasting-induced state with a greatly decreased metabolic rate and a body temperature as low as 20 °C6, is regulated by neurons in the medial and lateral preoptic area of the hypothalamus. We show that restimulation of neurons that were activated during a previous bout of torpor is sufficient to initiate the key features of torpor, even in mice that are not calorically restricted. Among these neurons we identify a population of glutamatergic Adcyap1-positive cells, the activity of which accurately determines when mice naturally initiate and exit torpor, and the inhibition of which disrupts the natural process of torpor entry, maintenance and arousal. Taken together, our results reveal a specific neuronal population in the mouse hypothalamus that serves as a core regulator of torpor. This work forms a basis for the future exploration of mechanisms and circuitry that regulate extreme hypothermic and hypometabolic states, and enables genetic access to monitor, initiate, manipulate and study these ancient adaptations of homeotherm biology.


Figures

Extended Data Fig. 1:
Extended Data Fig. 1:. Torpor metabolic rate, brain-wide search for torpor-regulating cells and chemogenetic reactivation of FosTRAP-Gq mice
a) Mean metabolic rate (VO2), body temperature (Tb), and gross motor activity (Act) of mice in torpor compared to mice that are fed or fasted yet not in torpor (n = 7, p-values indicated on graph). b) Schema for whole-brain reconstruction of c-Fos staining. c) Example brain slice of c-Fos staining in a fasted torpid mouse (n = 3 animals). d) 3D-reconstructed c-Fos-stained brain slices from a fasted torpid mouse. e) Average density of c-Fos-positive cells (number of cells divided by the volume of the region, n = 3 animals, Methods) across 179 brain regions that had on average at least 100 c-Fos+ cells. Paraventricular hypothalamus (PVH), a subregion of the preoptic area (POA), arcuate nucleus (ARC), dorsomedial hypothalamus (DMH), and paraventricular thalamus (PVT) are indicated. f) c-Fos staining of the PVH, xiphoid nucleus (Xi), POA, ARC, DMH, and PVT of fasted torpid mice (n = 3 animals). g) Mean core body temperature (Tb) over 4 hours following CNO administration is significantly lower in torpor-TRAP (n = 14 animals) compared to non-TRAP (n = 6 animals, p = 5.2e-5) and fed-TRAP (n = 9 animals, p = 2.9e-5) mice and compared to torpor-TRAP mice injected with PBS (n = 8 animals, p = 2.5e-5). h) Mean activity over 4 hours following CNO administration is significantly lower in torpor-TRAP (n = 14 animals) compared to non-TRAP (n = 6 animals, p = 5.2e-5) and fed-TRAP (n = 9 animals, p = 9.8e-3) mice and compared to torpor-TRAP mice injected with PBS (n = 8 animals, p = 2.5e-5). i) Coronal brain sections from FosTRAP, LSL-Gq-DREADD-HA mice TRAPed during fasting-induced torpor (fast-TRAP, n = 2 animals) or fed state (fed-TRAP, n = 4 animals) and immunostained for HA. Staining in selected brain areas (PVH, POA, ARC, DMH, and PVT) is shown. j) Volume-normalized signal intensity of HA staining across different hypothalamic nuclei in four fed-TRAP and two fast-TRAP mice. k) Brain-wide quantification of HA staining from four fed-TRAP and two fast-TRAP mice. Numerous (190/316) brain regions, including 32 hypothalamic areas, show increased Gq-DREADD-HA expression (> 2-fold) in fast-TRAP animals compared to fed-TRAP mice. Solid line indicates line of unity, dashed lines indicate two-fold differences. l) Correlation across brain regions between the number of c-Fos+ cells in torpid mice and the levels of Gq-DREADD expression in fast-TRAP mice (R = 0.83, p = 2.2e-16, Pearson correlation test, n = 316 regions). All box plots indicate mean ± s.e.m. All p-values represent two-tailed Mann-Whitney U tests, ** p < 0.01, *** p < 0.001.
Extended Data Fig. 2:
Extended Data Fig. 2:. Chemogenetic reactivation of torpor-TRAPed neurons in different hypothalamic regions and anterograde projections of torpor-TRAPed avMLPA neurons.
a-c) AAV-DIO-Gq-mCherry was injected into different hypothalamic regions of FosTRAP mice (n = 54 animals). Following TRAPing during torpor, we administered CNO and measured the effect of the re-activation of torpor-TRAPed neurons within the virally injected region on core body temperature. All animals were sacrificed, and the expression of the virally derived Gq-DREADD-mCherry was evaluated in each animal across 277 hypothalamic nuclei. a, b) Each circle represents one of the 277 hypothalamic nuclei, and the y-axis represents the -Log10 FDR-corrected q-value of the Pearson correlation (across 54 animals, q-values displayed in Table S3) between the viral expression in that nucleus and the decrease in Tb that was observed following CNO stimulation. Next, for each nucleus, 54 animals were grouped into those in which the nucleus was hit vs. missed. For each of the two groups of animals, the minimum body temperature following CNO administration was averaged and plotted. The minimum body temperature averaged across all animals in which the nucleus was hit is shown in (a) while the minimum body temperature averaged across all animals in which the nucleus was missed is shown in (b). c) For each nucleus and the corresponding two groups of animals, the minimum body temperature following CNO administration was plotted (“hit” group – y-axis, “missed” group – x-axis). Arrows indicate anterior MPA and LPO regions. When these regions were hit with the virus and the TRAPed neurons chemogenetically re-activated, the body temperature of the animal decreased, whereas when these regions were missed with the virus the body temperature did not decrease. d) Mean activity over 4 hours following CNO administration is significantly lower in avMLPA-hit (n = 15 animals) vs. avMLPA-missed mice (n = 11 animals, p = 1.4e-3), and compared to avMLPA-hit mice injected with PBS (n = 15 animals, p = 4.8e-6). e) Mean metabolic rate (VO2) over 4 hours following CNO administration is significantly lower in avMLPA-hit (n = 7 animals) compared to non-injected mice (n = 6 animals, p = 2.3e-3) or avMLPA-hit mice injected with PBS (n = 6 animals, p = 1.2e-3). f) Mean core body temperature (Tb) over 4 hours following CNO administration is significantly lower in avMLPA-hit (n = 15 animals) compared to avMLPA-missed mice (n = 11 animals, p = 2.6e-7) or avMLPA-hit mice injected with PBS (n = 15 animals, p = 9.0e-8). g) Minimum metabolic rate (VO2) over 4 hours following CNO administration is significantly lower in avMLPA-hit (n = 7 animals) compared to non-injected mice (n = 6 animals, p = 2.3e-3) or avMLPA-hit mice injected with PBS (n = 6 animals, p = 1.2e-3). h) Schematic showing projections of TRAPed avMLPAtorpor neurons. i, j) Gq-DREADD-mCherry fusion protein expression was used to visualize the projection of TRAPed avMLPAtorpor neurons across the brain (n = 4 animals). i) mCherry expression near the injection site (avMLPA). j) Representative images of projections to the MHb, medial habenula; PVT, paraventricular thalamus; DMH, dorsomedial hypothalamus; PAG, periaqueductal gray; ARC, arcuate nucleus; and RPa, raphe pallidus. Scale bars, 50 μm. All box plots indicate mean ± s.e.m. All p-values represent two-tailed Mann-Whitney U tests, ** p < 0.01, *** p < 0.001.
Extended Data Fig. 3:
Extended Data Fig. 3:. snRNA-seq metrics
a, b) UMAP plot of 39,562 nuclei from the avMLPA of five animals. a) Colors denote cells derived from each animal. b) Colors denote number of unique transcripts (UMI) per nucleus. c) Relative contribution of each sample (n = 5 animals) towards the total cell population making up each main cell class. d) Violin plot of the distribution of UMIs/cell for each main cell class (Glutamatergic neurons n = 11,275 cells, GABAergic neurons n = 16,307 cells, Cholinergic neurons n = 521 cells, Astrocytes n = 3,479 cells, Endothelial cells n = 421 cells, Microglia n = 1,247 cells, Oligodendrocytes n = 4,718 cells and OPCs n = 1,594). e) Violin plot of the distribution of genes/cell for each main cell class. f) Number of neuronal clusters formed when different fractions (25%, 50%, 75%, 90%) of total neurons (n = 7,025, 14,051, 21,077, 25,292, respectively) are used for clustering. For each fraction a random subset of neurons was used and the analysis repeated ten times. Box plot indicates mean ± s.e.m. Violin plot indicates distribution from the lowest to the largest value.
Extended Data Fig. 4:
Extended Data Fig. 4:. Marker gene expression across neuronal cell types
Color denotes mean expression across all nuclei normalized to the highest mean across cell types. Size represents the fraction of nuclei in which the marker gene was detected. Cell types are organized on the basis of hierarchical clustering across all variable genes. The five most unique makers are identified and plotted for each cell type unless a marker was identified across multiple cell types, in which case it was plotted only once.
Extended Data Fig. 5:
Extended Data Fig. 5:. Strategy for identifying TRAPed torpor-regulating neurons via snRNA-seq and gene expression of marker genes in the avMLPA
a) Schema for identifying Cre-dependent AAV-DIO-Gq-DREADD-mCherry mRNA with or without recombination. Top: AAV-DIO-Gq-DREADD-mCherry vector map before (Cre-) and after Cre-mediated recombination (Cre+). Blue and white triangles surrounding the Gq-GREADD-mCherry indicate loxP sites. Black arrows indicate the binding site of the sequencing primer. ITR, inverted terminal repeats; WPRE, Woodchuck Hepatitis Virus post-transcriptional regulatory element; Poly-A, polyadenylation signal. Bottom: Due to the Cre-mediated inversion in the AAV-DIO-Gq-DREADD-mCherry vector, the mRNA transcript sequence 3’ of the sequencing primer is different after Cre-mediated recombination, allowing us to identify TRAPed cells during snRNA-sequencing as those cells in which the viral mRNA contains the recombined (Cre+) sequence. b) Quantification of the number of virally transduced cells in TRAPed (n = 4 animals) and non-TRAPed (n = 1 animal) samples. c) Quantification of the number of TRAPed cells in TRAPed (86 ± 27 cells) and non-TRAPed samples (1 cell). d) Quantification of percent of transduced cells that are TRAPed in TRAPed (2.3 ± 0.7%, n = 4 animals) and non-TRAPed samples (0.04%, n = 1 animal) based on snRNA-seq. e) Quantification of percent of TRAPed neurons in TRAPed samples (1.8 ± 0.3%, n = 4 animals) based on fluorescence in situ hybridization. f-h) Mean transcripts per cell across all neuronal cell types identified in snRNA-seq for f) Vgat (Slc32a1, marker of GABAergic neurons), g) Vglut2 (Slc17a6, marker of glutamatergic neurons), and h) Adcyap1 (adenylate cyclase-activating peptide 1). i) snRNA-seq indicates that e2, e5, e10, e11, 16 and e30 represent Vglut2+ Adcyap1+ cell types, while e22, e27, h33, h12 and h24 are Vglut2+ and Adcyap1−. Based on this categorization, 72.4 ± 2.2% of Vglut2+ neurons are Adcyap1+ (n = 5 animals). Box plot indicates mean ± s.e.m. j) Mean transcripts per cell across all neuronal cell types identified in snRNA-seq for Lepr. Adcyap1+ clusters e5 and e10 express Lepr. Bar graphs indicate mean, error-bars 2* s.e.m.
Extended Data Fig. 6:
Extended Data Fig. 6:. In situ hybridization analysis of torpor-regulating avMLPA neurons
a) Coronal sections showing the avMLPA of FosTRAP mice (n = 4 animals) injected with AAV-DIO-Gq-DREADD-mCherry and torpor-TRAPed. Immunofluorescent staining against mCherry indicates the location of avMLPATRAP neurons (cyan), whereas in situ hybridization indicates the expression of the marker gene Adcyap1. b) High magnification images of staining shown in a) indicate the location of mCherry+ avMLPATRAP neurons (cyan), whereas in situ hybridization indicates the expression of marker genes Adcyap1 and Vglut2. Example avMLPATRAP mCherry+ cells are circled. Several mCherry+ cells express Adcyap1 and/or Vglut2. c) Quantification of the fraction of avMLPATRAP neurons that express Adcyap1 (28.8 ± 3.5%, n = 4 animals) and Vglut2 (38.5 ± 3.8%, n = 4 animals). d) Quantification of the fraction of avMLPAAdcyap1+ (14.3 ± 0.5%, n = 4 animals) and avMLPAVglut2+ (13.0 ± 1.8%, n = 4 animals) neurons that are torpor-TRAPed. e) Coronal section showing the avMLPA of FosTRAP mice. In situ hybridization shows cells that are positive for Adcyap1 (cyan), Vgat (yellow), and Vglut2 (purple). Composite image indicates co-expression of multiple markers. f) High magnification image with example Adcyap1+ cells circled. White circles indicate Adcyap1+ cells that are positive for Vglut2 and negative for Vgat, whereas yellow circles indicate all Adcyap1+ cells that are positive for Vgat (even if co-positive with Vglut2). g) The fraction of Adcyap1+ cells that are positive for Vglut2 or Vgat (82 ± 3% and 14 ± 1%, respectively, n = 3 animals). Scale bars are displayed. All box plots indicate mean ± s.e.m.
Extended Data Fig. 7:
Extended Data Fig. 7:. Expression pattern of Vgat, Vglut2, and Adcyap1 in the anterior POA.
Coronal sections adapted from Allen Mouse Brain Atlas (available from https://mouse.brain-map.org/). Anterior-posterior coordinates relative to Bregma are indicated for each set of images. Scale bars are displayed.
Extended Data Fig. 8:
Extended Data Fig. 8:. Chemogenetic stimulation and silencing of avMLPAVgat, avMLPAVglut2, or avMLPAAdcyap1 neurons
a–c) Stereotaxic viral injection of AAV-DIO-Gq-DREADD and subsequent chemogenetic stimulation of avMLPAVgat (n = 6 animals), avMLPAVglut2 (n = 5 animals), or avMLPAAdcyap1 (n = 8 animals) neurons. a) Experimental schema. b) Minimum core body temperature of avMLPAVgat mice (orange p = 0.48), avMLPAVglut2 mice (light-blue, p = 8e-3), and avMLPAAdcyap1 mice (dark blue, p = 1.6e-4) before and after chemogenetic stimulation with CNO. c) Mean activity of the same avMLPAVgat mice (p = 0.24), avMLPAVglut2 mice (p = 0.032), and avMLPAAdcyap1 mice (p = 1.6e-4), before and after chemogenetic stimulation with CNO. d) Schema for unilateral stereotaxic viral injection of AAV-DIO-Gq-DREADD and subsequent chemogenetic stimulation of avMLPAAdcyap1 neurons. e, f) Changes in mean core body temperature following bilateral (n = 8 animals) and unilateral (n = 4 animals) chemogenetic stimulation of avMLPAAdcyap1 neurons. e) Dashed line indicates CNO administration. Colored lines indicate the mean core body temperature across animals; gray shading indicates the 95% confidence interval. f) Mean core body temperature of mice before and after bilateral (p = 1.6e-4) or unilateral (p = 0.03) chemogenetic stimulation of avMLPAAdcyap1 neurons. g) Schema for stereotaxic viral co-injection of AAV-DIO-TeLC and AAV-DIO-Gq-DREADD and subsequent chemogenetic stimulation of avMLPAVglut2 and avMLPAAdcyap1 neurons. h, i) Changes in mean core body temperature following chemogenetic stimulation of avMLPAVglut2 and avMLPAAdcyap1 neurons that either express the excitatory Gq-DREADD receptor (n = 6, n = 8 animals, respectively) or co-express the Gq-DREADD receptor and the tetanus toxin light chain construct that inhibits synaptic transmission (TeLC, n = 2, n = 4 animals, respectively). h) Dashed line indicates CNO administration. Colored lines indicate the mean core body temperature across animals; gray shading indicates the 95% confidence interval. i) Quantification of mean core body temperature over 4 hours following chemogenetic stimulation in avMLPAVglut2 and avMLPAAdcyap1 (p = 1e-6) neurons that either solely express the excitatory Gq-DREADD receptor or co-express the Gq-DREADD and the TeLC. j-o) Stereotactic injection of AAV-DIO-TeLC to inhibit synaptic transmission in avMLPAVglut2 and avMLPAAdcyap1 neurons. j, k) Core body temperature of fed and fasted Vglut2-IRES-Cre mice from Fig. 3e (animal numbers indicated on graph). j) Minimum Tb is not significantly different between Ctrl-fed and TeLC-fed (p = 0.72) mice. Minimum Tb is significantly lower in Ctrl-fast (p = 0.018), and Pre-fast (p = 0.01) compared to TeLC-fast mice, suggesting that avMLPAVglut2 activity is necessary for torpor. k) Time needed to reach the minimum body temperature in Fig. 3e is significantly longer in TeLC-fast compared to either Pre-fast or Ctrl-fast mice (p = 9.2e-3 for both sets). l, m) Body temperature of fed and fasted Adcyap1-2A-Cre mice from Fig. 3f (animal numbers indicated on graph). l) Minimum Tb is not significantly different between Ctrl-fed and TeLC-fed (p = 0.41) mice. Minimum Tb was not significantly different in TeLC-fast compared to Ctrl-fast (p = 0.71), and Pre-fast (p=0.19) mice. m) Time needed to reach the minimum body temperature in Fig 3f is significantly longer in TeLC-fast compared to Pre-fast (p = 2e-3) and Ctrl-fast mice (p = 5e-4). n, o) Core body temperature (measured in 1-minute intervals) of fed mice during the 12 h light and 12 h dark cycle in which avMLPAAdcyap1 (n) or avMLPAVglut2 (o) neurons were injected with either AAV-DIO-TeLC (TeLC), a control AAV (Ctrl), or remained un-injected (Pre). Core body temperature is significantly different between the dark and light cycle across n) Pre fed (n = 3 animals, n = 3,960 temperature data points, p = 2e-16), Ctrl fed (n = 2 animals, n = 2,640 temperature data points, p = 2e-16) and TeLC fed (n = 5 animal, n = 6,600 temperature data points, p = 2e-16) Vglut2-IRES-Cre mice as well as o), Pre fed (n = 4 animals, n = 5,280 temperature data points, p = 2e-16), Ctrl fed (n = 7 animals, n = 9,240 temperature data points, p = 2e-16) and TeLC fed (n = 8 animals, n = 10,560 temperature data points, p = 2e-16) Adcyap-2A-Cre mice. Box plot displays median, inter-quartile range (IQR), whiskers up to 1.5*IQR and any datapoints outside this range. p, q) Coronal section showing the avMLPA of Adcyap1-2A-Cre mice (n = 2 animals) injected with AAV-DIO-TeLC-EYFP. Immunofluorescent staining against EYFP indicates the location of silenced TeLC+ neurons (green), whereas in situ hybridization indicates the expression of the Adcyap1 mRNA. q) High magnification image with example Adcyap1+ cells circled. White circles indicate Adcyap1+ cells that co-express TeLC-EYFP (43 ± 5%, n = 2 animals), yellow circles indicate Adcyap1+ that do not co-express TeLC-EYFP. Scale bars are displayed. All p-values represent two-tailed Mann-Whitney U test. n.s. represents non-statistically significant, *p < 0.05, ** p < 0.01, *** p < 0.001. b–m) Box plots indicate mean ± s.e.m.
Extended Data Fig. 9:
Extended Data Fig. 9:. Fiber photometry setup, recordings, and torpor model
a) Schema for fiber photometry setup. Three LED lights (415 nm, 470 nm, and 560 nm) were used as excitation light sources. For all recordings, 470 nm and 560 nm light sources were driven in phase, with 415 nm driven out of phase (Methods). The emitted signals were detected by a digital camera at the end of a patch cord. b) Example coronal brain slice from an Adcyap1-2A-Cre mouse co-injected with AAV-DIO-Gg-DREADD-mCherry and AAV-DIO-GCaMP6s and used for fiber photometry (n = 8 animals). The white dashed lines indicate the location of the optical fiber. Cells co-expressing GCaMP6s (green) and mCherry (red) appear yellow. c) Example fiber photometry recording (from mouse shown in b) displays the core body temperature (top) followed by three different signals (470 nm, 415 nm, and 560 nm). Here, the 470 nm signal represents calcium-dependent GCaMP6s signal, the 415nm represents the Ca2+-independent isosbestic GCaMP6s signal, and the 560 nm channel represents mCherry signal. The red line indicates the scaled fit of the Ca2+-independent 415 nm signal used to normalize the Ca2+-dependent 470 nm signal for Ca2+-independent changes in signal intensity. Both the 415 nm and 560 nm channels serve as controls for heat-mediated LED decay, bleaching of GCaMP6s, and movement artifacts. d) Recordings of a representative fasting session. (Top) core body temperature of mice during each recording session (dashed line indicates the threshold body temperature below which the animal is considered torpid); (second from top) raw Ca2+-dependent 470 nm GCaMP6s signal (red line indicates the scaled fit of the Ca2+-independent 415 nm signal used to normalize for bleaching or other Ca2+-independent changes in signal intensity); (third from the top) dF/F value relative to the Ca2+-independent scaled fit (blue line indicates the local baseline, which is determined as the 10th percentile of the dF/F value within a sliding three-minute interval); (fourth from the top) the standard deviation of the dF/F value calculated within a sliding three-minute interval; and (bottom) the dF/F values of the most prominent peaks identified (top 1% of all peaks in the session). e-g) Quantification of baseline dF/F [%] (e), standard deviation (f), and peak frequency [/min] (g) for non-torpid (yellow), torpor entry (light-blue), torpor (blue), and torpor arousal (teal) in eight individual animals across all three-minute intervals (left to right: n = 251, 62, 97, 17, 321, 46, 57, 15, 203, 52, 39, 19, 269, 44, 66, 18, 141, 30, 59, 2, 250, 57, 42, 5, 43, 31, 23, 7, 80, 44, 51, 8). All box plots indicate mean ± s.e.m. P-values greater than 0.05 are indicated. h) Example fiber photometry signal (top) clustered into two states and colored by state. State 0 corresponds to the animal being out of torpor or exiting torpor while state 1 corresponds to the animal entering or maintaining torpor. i) Core body temperature and motor activity are significantly lower during state 1 versus state 0 of the photometry-based model (n = 8 animals, p = 1.6e-4). j) The time that an animal spent in torpor (entry or maintenance) was accurately calculated by the photometry data-based model 82.3 ± 3.2% of the time (model sensitivity). Conversely, whenever the model determined that the animal was entering or maintaining torpor, its estimation was 88.4 ± 2.8% accurate (specificity). k) Model sensitivity and specificity were significantly lower (p = 1.6e-4, n = 8 animals) when the temporal relationship between the temperature and fiber photometry data was removed. All box plots indicate mean ± s.e.m. All p-values represent two-tailed Mann-Whitney U test. *p < 0.05, ** p < 0.01, *** p < 0.001.
Extended Data Fig. 10:
Extended Data Fig. 10:. Fiber photometry recordings of avMLPAAdcyap1 neurons in fed freely moving mice with CHA-induced hypothermia and changes in ambient temperature
a) Fiber photometry recording data displayed as in Extended Data Fig. 8d. Dashed line indicates the time of CHA administration. b–d) Baseline (b), peak frequency (c), and standard deviation (d) of each animal before and after CHA administration across all recorded three-minute intervals (left to right: n = 69, 17, 63, 23, 140, 24, 161, and 37 time intervals). P-values indicated. e) Mean baseline is decreased following CHA treatment (p = 0.03, n = 4 animals). f) Schema for fiber photometry recording of avMLPAAdcyap1 neurons when mice are exposed to different environmental temperatures with food provided in the chamber. g) Mean GCaMP6s signal (n = 6 animals) of avMLPAAdcyap1 neurons as environmental temperature changes along a programmed sequence: 25°C → 37°C → 25°C → 10°C → 25°C. Gray shading indicates the 95% confidence interval. h) Example fiber photometry recording displays the ambient (chamber) temperature (top) followed by three different signals (470 nm, 415 nm, and 560 nm). Signals from 415 nm and 560 nm are used as controls for potential temperature effects on the photometry signal. i) Mean neuronal responses at different ambient temperatures. avMLPAAdcyap1 neurons are not sensitive to increases in the ambient temperature to 37°C (p = 0.59), and instead appear to be sensitive to a decrease in environmental temperature (n = 6 animals, p = 0.0021). All box plots indicate mean ± s.e.m. All p-values represent two-tailed Mann-Whitney U test. n.s. represents non-statistically significant, *p < 0.05, ** p < 0.01, *** p < 0.001.
Figure 1:
Figure 1:. Neuronal activity induces key features of torpor
a) Core body temperature (Tb) and gross motor activity [arbitrary units] of a representative non-fasted or fasted mouse over 24 hours. Fasted mice enter torpor, while non-fasted mice do not. Gray/white indicate 12 hours of darkness/light. Dashed line indicates minimum Tb observed in non-fasted mice. b, c) Minimum Tb and metabolic rate (VO2 – volume of oxygen consumed [l/h]) in non-fasted (fed) and fasted mice (n = 7 animals, p = 6e-4, p = 1e-5, respectively). d) Schema for gaining genetic control over torpor-regulating neurons. Neurons active during torpor in FosTRAP; LSL-Gq-DREADD mice are TRAPed by 4-OHT administration and chemogenetically re-stimulated 7 days later in non-fasted mice by CNO treatment. e, f) CNO-induced reactivation of 4-OHT-TRAPed neurons active during torpor entry triggers a decrease in Tb characteristic of mouse torpor (fast-TRAP, n = 14 animals). The same mice injected with PBS (fast-PBS, n = 8 animals), or control mice in which neurons were not TRAPed (no-TRAP, n = 6 animals) or were TRAPed during a non-torpid state (fed-TRAP, n = 9 animals), did not decrease Tb upon CNO administration. e) Dashed line indicates the onset of CNO or PBS administration, shading indicates 95% confidence interval of Tb. f) Minimum Tb following CNO administration is lower in fast-TRAP (n = 14) animals compared to no-TRAP (n = 6, p = 6.2e-4), fed-TRAP (p = 2.4e-6) or fast-PBS (p = 2.5e-5) animals. All box plots indicate mean ± s.e.m. P-values calculated by two-tailed Mann-Whitney U test, *** p < 0.001.
Figure 2:
Figure 2:. Identification of brain regions regulating torpor
a) Schema for identifying which hypothalamic regions contain torpor-regulating neurons. b) Quantification of AAV-DIO-Gq-DREADD-mCherry expression in mice TRAPed during fasting-induced torpor. 277 hypothalamic nuclei are plotted based on their AP coordinates relative to bregma (B). Fifty-four animals are ranked based on decrease in core body temperature (ΔTb) observed following chemogenetic stimulation of TRAPed neurons. ΔTb is correlated with viral expression in each region (Pearson correlation). c) Two regions in which viral expression did not, and three regions in which viral expression showed significant correlation to ΔTb (FDR-corrected q-value, Pearson correlation test, n = 54 animals). Minimum Tb was calculated across all animals grouped based on degree of viral expression into None, Partial or Complete. Box plot displays median, inter-quartile range (IQR), whiskers up to 1.5*IQR. d) Coronal section from an avMLPA-injected mouse (n = 15 animals). e, f) Chemogenetic re-stimulation of avMLPA TRAPed neurons (avMLPA-hit CNO, n = 15 animals), the same animals (n = 15) injected with PBS or control mice in which the avMLPA was missed (avMLPA-miss, n = 11 animals). e) Dashed line indicates CNO or PBS administration, gray shading indicates 95% confidence interval of Tb. f) Minimum Tb following CNO administration is lower in avMLPA-hit compared to avMLPA-miss (p = 1.8e-6) or avMLPA-hit mice injected with PBS (p = 5.8e-7). Two-tailed Mann-Whitney U test, *** p < 0.001. Box plot indicates mean ± s.e.m.
Figure 3:
Figure 3:. Molecular characterization of torpor-associated avMLPA neurons
a) Schema for molecular characterization of avMLPATRAP cells. AAV-DIO-Gq-DREADD is injected into the avMLPA (n = 5 mice). Following TRAPing, the avMLPA is microdissected and snRNA-sequenced. b) UMAP plot of 39,562 nuclei from the avMLPA of five animals. Colors denote main cell types (names indicated). c) Marker gene expression across cell types (names abbreviated to first few letters). d) UMAP plot of 28,103 neuronal nuclei. Colors denote 36 neuronal subtypes. e) Marker gene expression across neuronal cell types. Cell types are organized on the basis of hierarchical clustering. Acronym comprises neuronal class (e - excitatory, i - inhibitory, h - hybrid, c - cholinergic) and cluster number, followed by select marker genes. f) UMAP plot of 17,424 neuronal nuclei that were transduced by the AAV (gray) and 342 neuronal nuclei that were TRAPed during torpor (red). g) Distribution of TRAPed neurons across all neuronal cell types. Box plots indicate mean ± s.e.m. (n = 4 animals). Yellow shading indicates cell types expressing Adcyap1 and Vglut2. Acronym comprises neuronal class and cluster number. c, e) Color denotes mean expression across all nuclei normalized to the highest mean across cell types. Size represents the fraction of nuclei in which the marker gene was detected.
Figure 4:
Figure 4:. Sufficiency, necessity, and natural activity of avMLPA neuronal subpopulations during torpor
a–c) Injection of AAV-DIO-Gq-DREADD and subsequent chemogenetic stimulation of avMLPAVgat, avMLPAVglut2, and avMLPAAdcyap1 neurons (n = 6, 5, 8 animals, respectively). a) Experimental schema. b) Mean core body temperature (Tb) following chemogenetic stimulation (dashed line). c) Mean Tb before and after chemogenetic stimulation of avMLPAVgat (p = 0.48), avMLPAVglut2 neurons (p = 7.9e-3), and avMLPAAdcyap1 (p = 1.6e-4). d) Schema for injection of AAV-DIO-TeLC to inhibit synaptic transmission. e, f) Tb of fed and fasted mice in which e) avMLPAVglut2 or f) avMLPAAdcyap1 neurons remained un-injected (Pre), were injected with a control AAV (Ctrl), or were injected with AAV-DIO-TeLC (TeLC). Colored lines indicate the mean across animals; gray shading indicates 95% confidence interval. Number of animals indicated in parenthesis. g) Schema for injection of AAV-DIO-GCaMP6s and fiber photometry recording from avMLPAAdcyap1 neurons. h–j) Example recording sessions in fasted mice showing Tb and normalized GCaMP6s signal. Example 20-minute trace spanning torpor entry (i) and torpor arousal (j). Colored bars indicate states (based on Tb); legend displayed in (h). Dashed line indicates transition between non-torpor and torpor states (Methods). k, l) Example photometry signal in non-torpor (k) and torpor (l). Baseline indicated in blue. m) Mean baseline (left) and peak frequency (right) of fiber photometry signal in one animal across states (legend displayed in (n), p-values indicated above plot). n) Difference in average baseline (left) and Log2 fold-change in average peak frequency (right) of fiber photometry signal between torpor states and non-torpor (n = 8 animals, p-values indicated above plots). All box plots indicate mean ± s.e.m. All p-values calculated by Mann-Whitney U test, two-tailed. n.s. represents non-statistically significant, *p < 0.05, ** p < 0.01, *** p < 0.001.

Comment in

  • Flipping the switch on the body's thermoregulatory system.
    Saper CB, Machado NLS. Saper CB, et al. Nature. 2020 Jul;583(7814):34-35. doi: 10.1038/d41586-020-01600-5. Nature. 2020. PMID: 32601488 No abstract available.
  • Chill out.
    Bray N. Bray N. Nat Rev Neurosci. 2020 Aug;21(8):397. doi: 10.1038/s41583-020-0337-8. Nat Rev Neurosci. 2020. PMID: 32612215 No abstract available.

References

    1. Tan CL & Knight ZA Regulation of Body Temperature by the Nervous System. Neuron 98, 31–48 (2018). - PMC - PubMed
    1. Morrison SF & Nakamura K. Central Mechanisms for Thermoregulation. Annu. Rev. Physiol 81, 285–308 (2019). - PubMed
    1. Heller HC & Hammel HT CNS control of body temperature during hibernation. Comp. Biochem. Physiol. A Physiol. 41, 349–359 (1972). - PubMed
    1. Sunagawa GA & Takahashi M. Hypometabolism during Daily Torpor in Mice is Dominated by Reduction in the Sensitivity of the Thermoregulatory System. Sci. Rep 6, 1–14 (2016). - PMC - PubMed
    1. Geiser F. Metabolic Rate and Body Temperature Reduction During Hibernation and Daily Torpor. Annu. Rev. Physiol 66, 239–274 (2004). - PubMed

Publication types

Substances