. 2019 Oct;15(10):1086-1094.
doi: 10.1038/s41567-019-0598-1. Epub 2019 Aug 5.

Low-dimensional Dynamics of Two Coupled Biological Oscillators

Affiliations

Low-dimensional Dynamics of Two Coupled Biological Oscillators

Colas Droin et al. Nat Phys. 2019 Oct.

Abstract

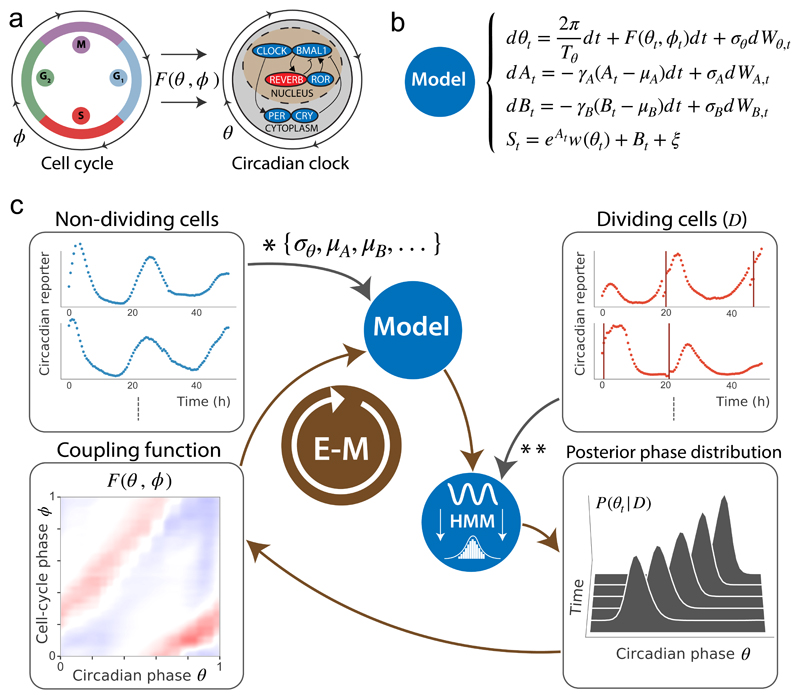
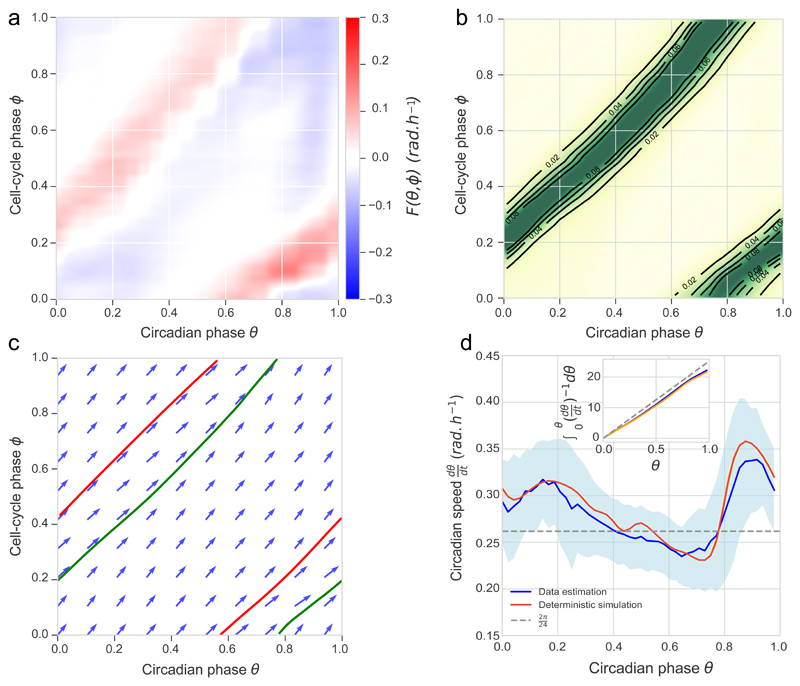
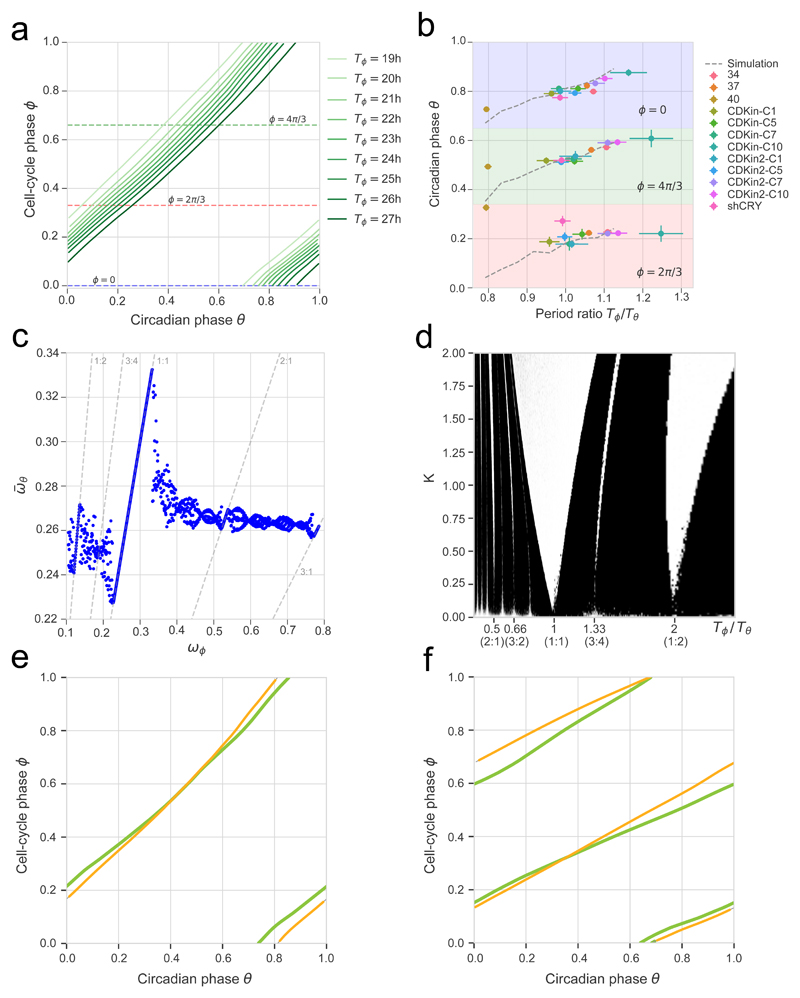
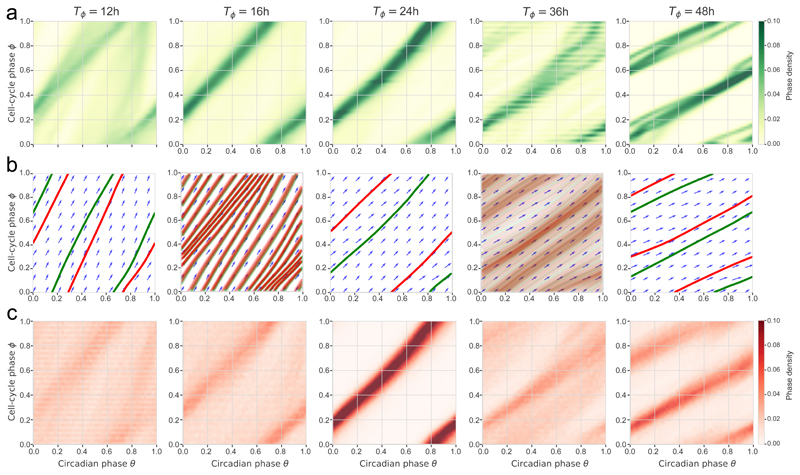
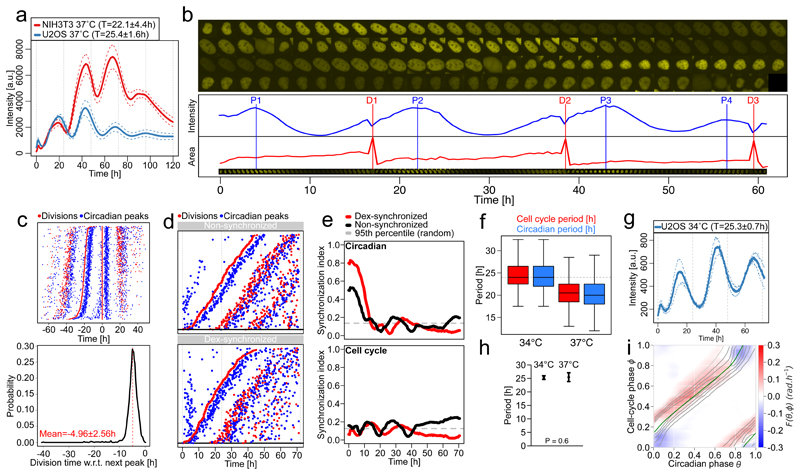
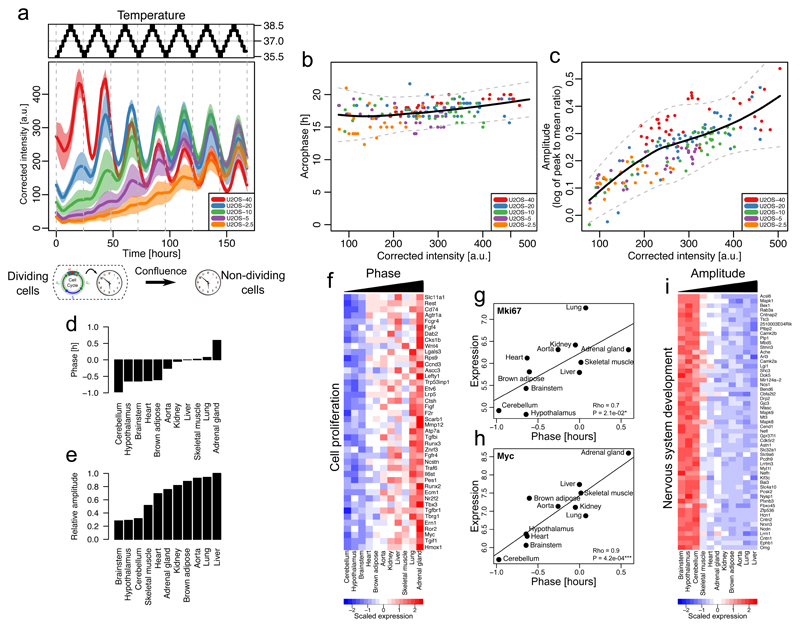
The circadian clock and the cell cycle are two biological oscillatory processes that coexist within individual cells. These two oscillators were found to interact, which can lead to their synchronization. Here, we develop a method to identify a low-dimensional stochastic model of the coupled system directly from time-lapse imaging in single cells. In particular, we infer the coupling and non-linear dynamics of the two oscillators from thousands of mouse and human single-cell fluorescence microscopy traces. This coupling predicts multiple phase-locked states showing different degrees of robustness against molecular fluctuations inherent to cellular-scale biological oscillators. For the 1:1 state, the predicted phase-shifts upon period perturbations were validated experimentally. Moreover, the phase-locked states are temperature-independent and evolutionarily conserved from mouse to human, hinting at a common underlying dynamical mechanism. Finally, we detect a signature of the coupled dynamics in a physiological context, explaining why tissues with different proliferation states exhibited shifted circadian clock phases.

Keywords: cell cycle; circadian clock; coupled oscillators; phase-locking; stochastic dynamics; synchronization.


Figures

Figure 1
Figure 1. Reconstructing the phase dynamics and coupling of two biological oscillators.
(a) In mouse fibroblasts, the cell cycle (left) can influence the circadian oscillator (right) according to a coupling function F(θ, ϕ), where ϕ denotes the cell cycle and θ the circadian oscillator phases. (b) Stochastic model for the signal St using diffusion-drift SODEs for the circadian phase θt, amplitude At and background Bt fluctuations, as well as a function W(θ) linking the phase θt to the measured observations, and F(θ, ϕ) (c) Fluorescence microscopy traces (Rev-erbα-YFP circadian reporter) are recorded for non-dividing and dividing cells (top left and top right boxes). Coupling-independent parameters (*) are estimated from non-dividing cells while dividing cells are necessary to infer F(θ, ϕ) (**). The optimization problem is solved by converting the model to a HMM in which θt, At and Bt are latent variables. The HMM is used on traces to compute posterior probabilities of circadian phases (bottom right box), while the cell-cycle phase is retrieved using linear interpolation between successive divisions (top right box, vertical orange lines). An iterative EM algorithm then yields the converged F(θ, ϕ) (bottom left box).
Figure 2
Figure 2. Influence of the cell cycle on the circadian phase enables 1:1 phase-locking.
(a) Coupling F(θ, ϕ) optimized on dividing single-cell traces. Due to similar results (Supplementary Fig. 2) traces from the three temperatures (n=154, 271, 302 traces at 34°C, 37°C, 40°C, resp.) are pooled. (b) Density of inferred phase traces from all the dividing traces with 22±1h cell-cycle intervals indicates a 1:1 phase-locked state. (c) Numerical integration of phase velocity field (arrows, deterministic model) yields 1:1 attractor (green line) and repeller (red line). Here, the cell-cycle period was set to 22 h. (d) Circadian phase velocity is not constant along the attractor, here for cells with 22±1h cell-cycle intervals. Data (blue line, standard deviation in light-blue shading) and deterministic simulation (orange line). Inset: integrated time along the attractor. The gray line shows constant bare phase velocity ωθ=2π24h.
Figure 3
Figure 3. The coupling between the cell cycle and the circadian oscillator predicts phase shifts and phase-locking attractors in perturbation experiments.
(a) Simulated (deterministic) attractors for cell-cycle periods ranging from 19h to 27h show that the dephasing of the cell cycle and the circadian oscillator changes within the 1:1 state. Periods just outside of this range yield quasiperiodic orbits. The horizontal dashed lines indicate three different cell-cycle phases ϕ=0,ϕ=13×2π,ϕ=23×2π used in panel (b). (b) Predictions from a) (dashed grey lines) against independent experimental data collected from 12 perturbation experiments (colored symbols, see legend, notation explained in Methods). (c) Multiple phased-locked states are predicted, recognizable by rational relationships between the frequencies of the entraining cell cycle and the entrained circadian oscillator, interspersed by quasiperiodic intervals. (d) Arnold tongues showing multiple phase-locked states in function of cell-cycle periods and coupling strength (K=1 corresponds to the experimentally found coupling). Stable zones (white tongues) reveal attractors interspersed by quasi-periodicity. Although there are only two wider phased-locked state (1:1 and 1:2), several other p:q states are found. (e-f) Representative single-cell traces (data in yellow) evolving near predicted attractors (green lines). A cell with Tϕ = 24h (e) and one with Tϕ = 48h (f) near the 1:1 and 1:2 orbits, respectively.
Figure 4
Figure 4. Single-cell data and stochastic simulations reveal robust 1:1 and 1:2 phase-locked states.
(a) Phase-space densities from the experimental traces stratified by cell-cycle periods (±1h for each reference period); n=16, 223, 303, 54, 4 cell traces in the T=12, 16, 24, 36, 48 h panels, resp. (b) Vector fields and simulated (deterministic) trajectories for the different cell-cycle periods. Attractors are shown in green (forward time integration) and repellers (backward integration) in red (see also Movie 2). (c) Phase-space densities obtained from stochastic simulations of the model match better with the data compared to b).
Figure 5
Figure 5. Conserved influence of the cell cycle on the circadian clock in human U2OS osteosarcoma cell.
(a) Mean luminescence intensities (±SD, n=3) from non-dividing NIH3T3 and U2OS cells grown at 37°C expressing a Bmal1-Luc reporter. Values in the legend correspond to the mean periods ±SD. (b) Semi-automated segmentation and tracking of U2OS cell lines expressing the Rev-erbα-YFP circadian fluorescent reporter. Red vertical lines represent cell divisions (cytokinesis) and blue vertical lines show Rev-erbα-YFP signal peaks. (c) Top: stack of divisions (red) and Rev-erbα-YFP peaks (blue) for single U2OS traces centered on divisions. Bottom: distribution of the time of division relative to the next Rev-erbα-YFP peaks (in read mean±SD, n=1298). (d) Divisions and Rev-erbα-YFP peaks from single non-synchronized (top), and dexamethasone (dex)-synchronized (bottom) U2OS traces ordered on the first division. (e) Synchronization index (SI) from non-synchronized (black) and dex-synchronized (red) traces for the circadian phase (top) and cell-cycle phase (bottom) estimated as in Bieler et al. . The circadian SI from non-synchronized cells is relatively high due to plating. Dashed gray lines show 95th percentiles of the SI for randomly shuffled traces. (f) Cell-cycle and circadian periods for U2OS cells grown at 34°C and 37°C (n > 90 for all distributions). (g) Mean luminescence intensities (±SD, n=3) for non-dividing U2OS cells grown at 34°C expressing a Bmal1-Luc reporter. Values in the legend correspond to the mean periods ±SD. (h) Mean and standard deviation of the circadian period for non-dividing U2OS cells grown at 34°C and 37°C (n=8 at 34 and n=9 at 37, two-sided Wilcoxon’s test). (i) Coupling function F(θ, ϕ) optimized on n=551 dividing U2OS traces grown at 37°C, superimposed with the attractor (Tϕ = 22h) obtained from deterministic simulations (green line).
Figure 6
Figure 6. Temperature cycles do not entrain circadian oscillators in dividing cells and proliferation genes are associated with tissue-specific circadian phases.
(a) Corrected and averaged Bmal1-Luc intensities and 95% confidence intervals (n=6) from U2OS-Dual cells plated at different initial densities and subjected to a temperature entrainment (top). (b) Acrophases (times of the local peaks in luminescence) of the Bmal1-Luc signal in function of the reporter intensity for the cells in a). Loess fit (black) and 95% confidence intervals (gray). (c) Amplitude (log of peak to mean ratio) of the Bmal1-Luc oscillations in function of the reporter intensity for the cells in a). Loess fit (black) and 95% confidence intervals (gray). (d-e) Circadian phases (d) and amplitudes (e) of different mouse tissues obtained in ref, relative to liver. (f) Expression levels of genes positively associated with phases from d) and linked to cell proliferation. (g-h) Correlations between Mki67(g) and Myc (h) mRNA expression and circadian phases across mouse tissues (Pearson’s correlation, two-sided P-values from t-distribution with n-2 degrees of freedom). (i) Expression levels of genes negatively associated with amplitudes and linked to nervous system development.

References

    1. Nagoshi E, et al. Circadian gene expression in individual fibroblasts: cell-autonomous and self-sustained oscillators pass time to daughter cells. Cell. 2004;119:693–705. doi: 10.1016/j.cell.2004.11.015. - DOI - PubMed
    1. Mermet J, Yeung J, Naef F. Systems Chronobiology: Global Analysis of Gene Regulation in a 24-Hour Periodic World. Cold Spring Harbor perspectives in biology. 2017;9 doi: 10.1101/cshperspect.a028720. - DOI - PMC - PubMed
    1. Hahn AT, Jones JT, Meyer T. Quantitative analysis of cell cycle phase durations and PC12 differentiation using fluorescent biosensors. Cell cycle. 2009;8:1044–1052. doi: 10.4161/cc.8.7.8042. - DOI - PMC - PubMed
    1. Spencer SL, et al. The proliferation-quiescence decision is controlled by a bifurcation in CDK2 activity at mitotic exit. Cell. 2013;155:369–383. doi: 10.1016/j.cell.2013.08.062. - DOI - PMC - PubMed
    1. Bieler J, et al. Robust synchronization of coupled circadian and cell cycle oscillators in single mammalian cells. Molecular systems biology. 2014;10:739. doi: 10.15252/msb.20145218. - DOI - PMC - PubMed