. 2020 May 29:3:80.
doi: 10.1038/s41746-020-0286-7. eCollection 2020.

A data-driven framework for selecting and validating digital health metrics: use-case in neurological sensorimotor impairments

Affiliations

A data-driven framework for selecting and validating digital health metrics: use-case in neurological sensorimotor impairments

Christoph M Kanzler et al. NPJ Digit Med. .

Abstract

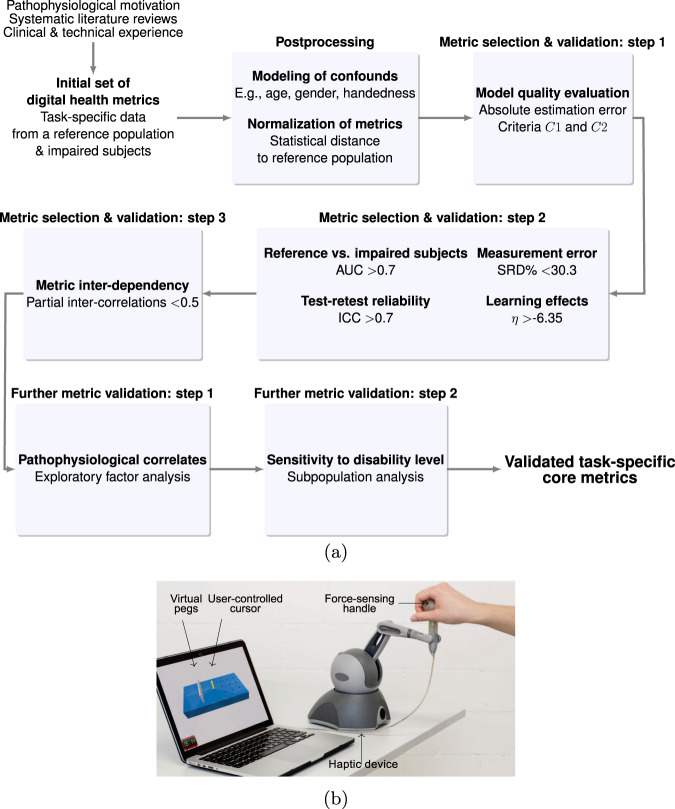
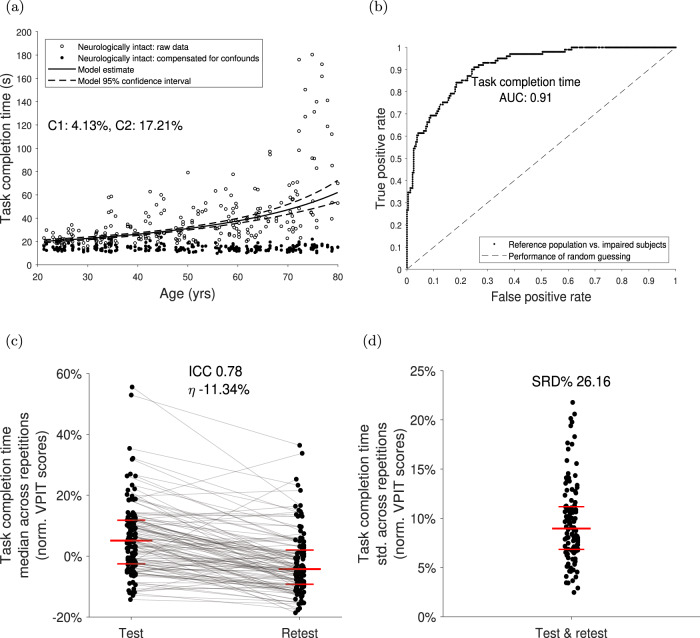
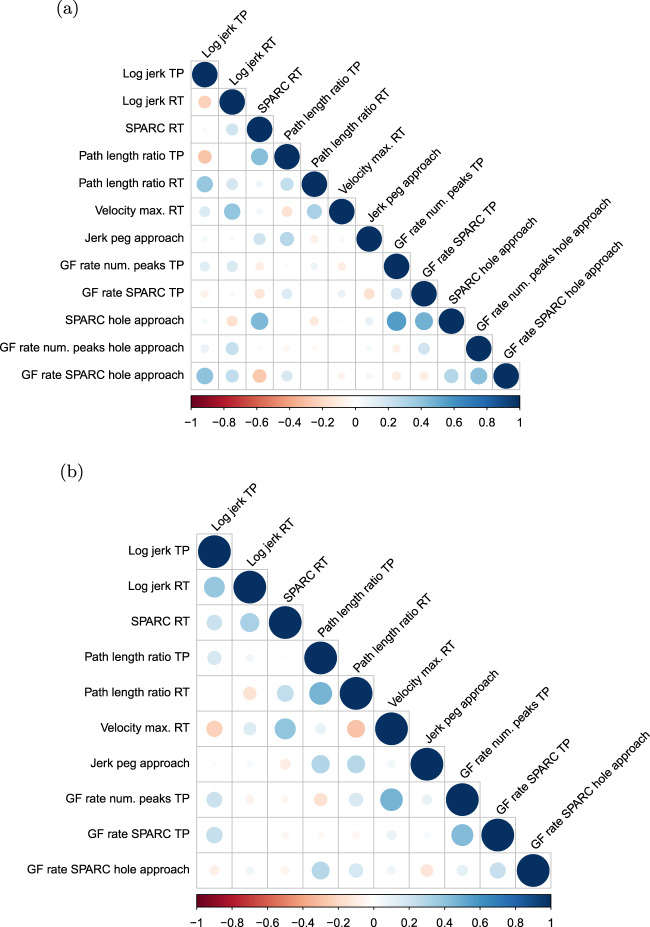
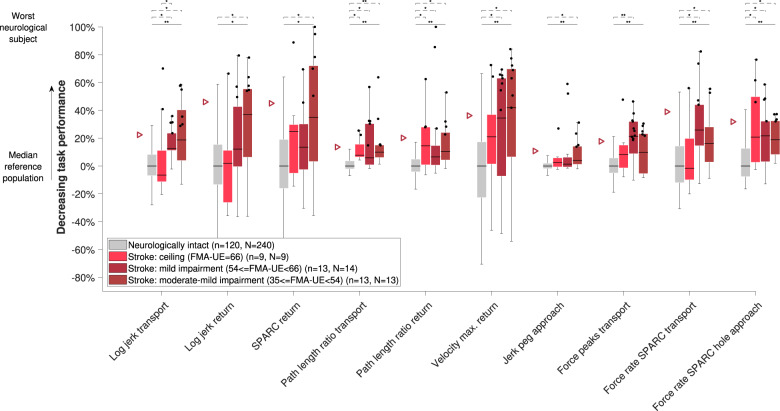
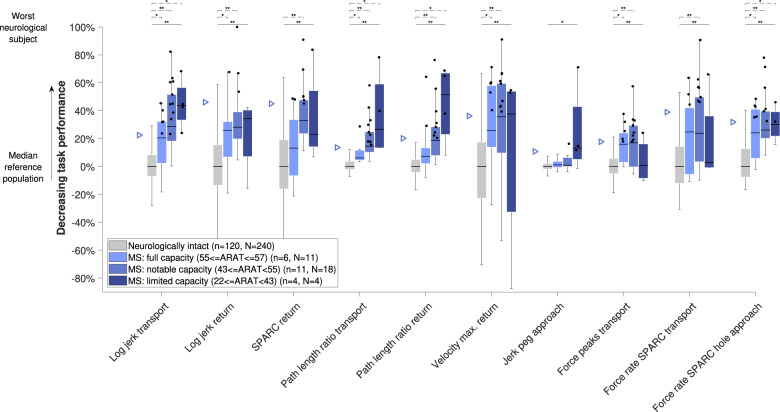
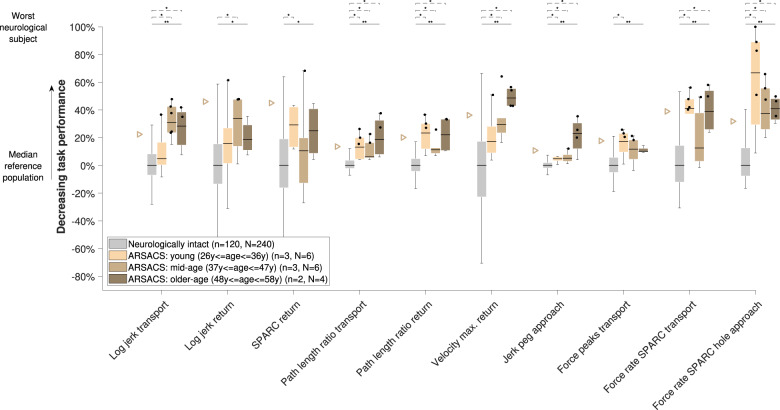
Digital health metrics promise to advance the understanding of impaired body functions, for example in neurological disorders. However, their clinical integration is challenged by an insufficient validation of the many existing and often abstract metrics. Here, we propose a data-driven framework to select and validate a clinically relevant core set of digital health metrics extracted from a technology-aided assessment. As an exemplary use-case, the framework is applied to the Virtual Peg Insertion Test (VPIT), a technology-aided assessment of upper limb sensorimotor impairments. The framework builds on a use-case-specific pathophysiological motivation of metrics, models demographic confounds, and evaluates the most important clinimetric properties (discriminant validity, structural validity, reliability, measurement error, learning effects). Applied to 77 metrics of the VPIT collected from 120 neurologically intact and 89 affected individuals, the framework allowed selecting 10 clinically relevant core metrics. These assessed the severity of multiple sensorimotor impairments in a valid, reliable, and informative manner. These metrics provided added clinical value by detecting impairments in neurological subjects that did not show any deficits according to conventional scales, and by covering sensorimotor impairments of the arm and hand with a single assessment. The proposed framework provides a transparent, step-by-step selection procedure based on clinically relevant evidence. This creates an interesting alternative to established selection algorithms that optimize mathematical loss functions and are not always intuitive to retrace. This could help addressing the insufficient clinical integration of digital health metrics. For the VPIT, it allowed establishing validated core metrics, paving the way for their integration into neurorehabilitation trials.

Keywords: Diagnostic markers; Multiple sclerosis; Neurological disorders; Predictive markers; Prognostic markers.


Conflict of interest statement

Competing interestsThe authors declare no competing interests.

Figures

Fig. 1
Fig. 1. Overview of the metric selection framework and the Virtual Peg Insertion Test (VPIT).
a The frameworks allows to select a core set of validated digital health metrics through a transparent step-by-step selection procedure. Model quality criteria C1 and C2; ROC receiver operating characteristics, AUC area under curve, ICC intra-class correlation, SRD% smallest real difference; η strength of learning effects. b The framework was applied to data recorded with the VPIT, a sensor-based upper limb sensorimotor assessment requiring the coordination of arm and hand movements as well as grip forces.
Fig. 2
Fig. 2. Data-driven selection and validation of metrics: example of task completion time.
a The influence of age, sex, tested body side, handedness, and stereo vision deficits on each digital health metrics was removed using data from neurologically intact subjects and mixed effect models (model quality criteria C1 and C2). Models were fitted in a Box–Cox-transformed space and back-transformed for visualization. Metrics with low model quality (C1 > 15% or C2 > 25%) were removed. b The ability of a metric to discriminate between neurologically intact and affected subjects (discriminant validity) was evaluated using the area under the curve value (AUC). Metrics with AUC < 0.7 were removed. c Test–retest reliability was evaluated using the intra-class correlation coefficient (ICC) indicating the ability of a metric to discriminate between subjects across testing days. Metrics with ICC < 0.7 were removed. Additionally, metrics with strong learning effects (η > −6.35) were removed. The long horizontal red line indicates the median, whereas the short ones represent the 25th and 75th percentile. d Measurement error was defined using the smallest real difference (SRD%), indicating a range of values for that the assessment cannot discriminate between measurement error and physiological changes. The distribution of the intra-subject variability was visualized, as it strongly influences the SRD. Metrics with SRD% > 30.3 were removed.
Fig. 3
Fig. 3. Partial correlation analysis.
The objective was to remove redundant information. Therefore, partial Spearman correlations were calculated between all combination of metrics while controlling for the potential influence of all other metrics. Pairs of metrics were considered for removal if the correlation was equal or above 0.5 The process was done in an iterative manner and the first a and the last b iterations are presented.
Fig. 4
Fig. 4. Sensitivity of metrics to disability severity in stroke subjects.
Subjects were grouped according to the clinical disability level. The vertical axis indicates task performance based on the distance to the reference population. The population median is visualized through the black horizontal line, the interquartile range (IQR) through the boxes, and the min and max value within 1.5 IQR of the lower and upper quartiles, respectively, through the whiskers. Data points above the 95th-percentile (triangles) of neurologically intact subjects are showing abnormal behavior (black dots). Solid and dashed horizontal black lines above the box plots indicate results of the omnibus and post-hoc statistical tests, respectively. *Indicates p < 0.05 and **p < 0.001. n refers to the number of subjects in that group and N to the number of data points. Only subjects with available clinical scores were included. For the jerk peg approach, one outlier was not visualized to maintain a meaningful representation. FMA-UE Fugl-Meyer upper extremity, SPARC spectral arc length.
Fig. 5
Fig. 5. Sensitivity of metrics to disability severity in MS subjects.
See Fig. 4 for a detailed description. ARAT action research arm test.
Fig. 6
Fig. 6. Sensitivity of metrics to disability severity in ARSACS subjects.
See Fig. 4 for a detailed description.

Similar articles

Cited by

References

    1. World Health Organization. International Classification of Functioning, Disability and Health: ICF. Geneva: World Health Organization; 2001.
    1. Lawrence ES, et al. Estimates of the prevalence of acute stroke impairments and disability in a multiethnic population. Stroke. 2001;32:1279–1284. - PubMed
    1. Kister I, et al. Natural history of multiple sclerosis symptoms. Int. J. MS Care. 2003;15:146–158. - PMC - PubMed
    1. Gagnon C, Desrosiers J, Mathieu J. Autosomal recessive spastic ataxia of charlevoix-saguenay: upper extremity aptitudes, functional independence and social participation. Int. J. Rehabilit. Res. 2004;27:253–256. - PubMed
    1. Yozbatiran N, Baskurt F, Baskurt Z, Ozakbas S, Idiman E. Motor assessment of upper extremity function and its relation with fatigue, cognitive function and quality of life in multiple sclerosis patients. J. Neurol. Sci. 2006;246:117–122. - PubMed