. 2020 Jun;87(1):e107.
doi: 10.1002/cpcb.107.

Kymolyzer, a Semi-Autonomous Kymography Tool to Analyze Intracellular Motility

Affiliations

Kymolyzer, a Semi-Autonomous Kymography Tool to Analyze Intracellular Motility

Himanish Basu et al. Curr Protoc Cell Biol. 2020 Jun.

Abstract

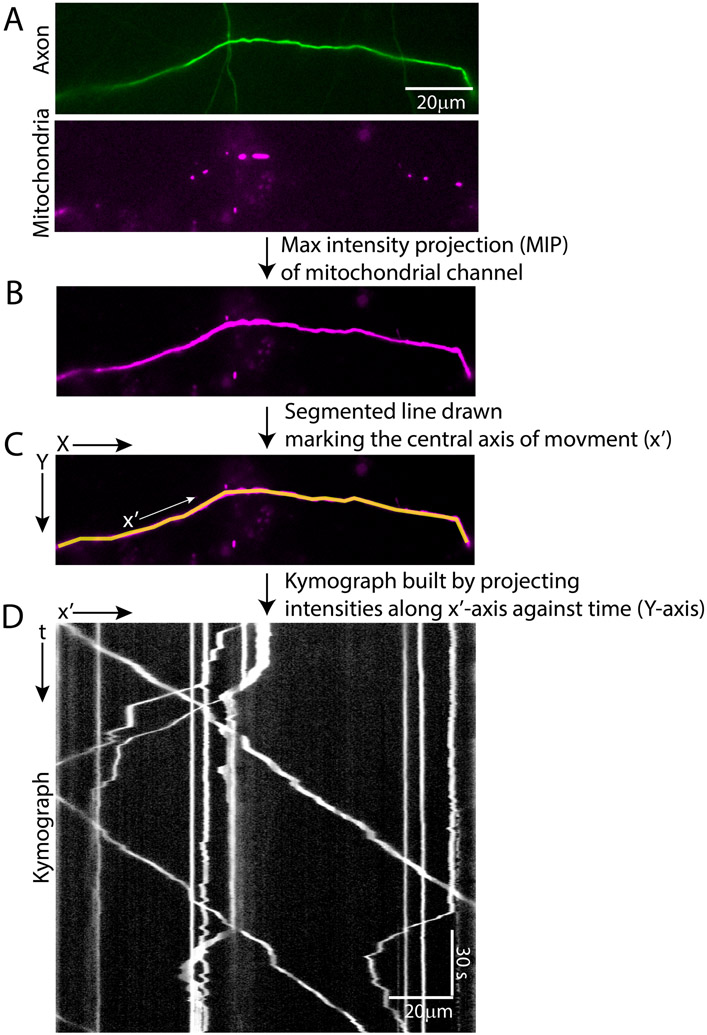
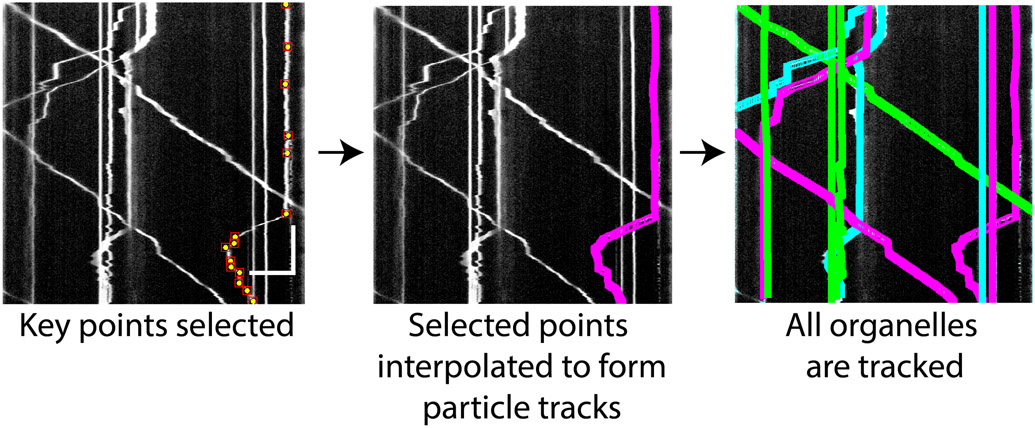
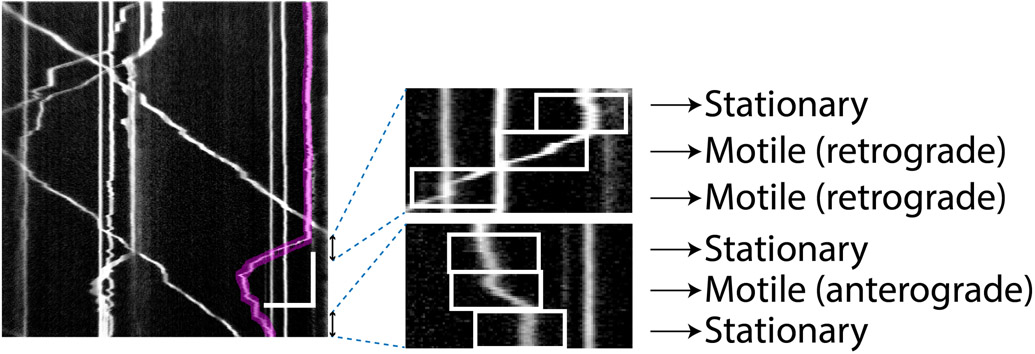
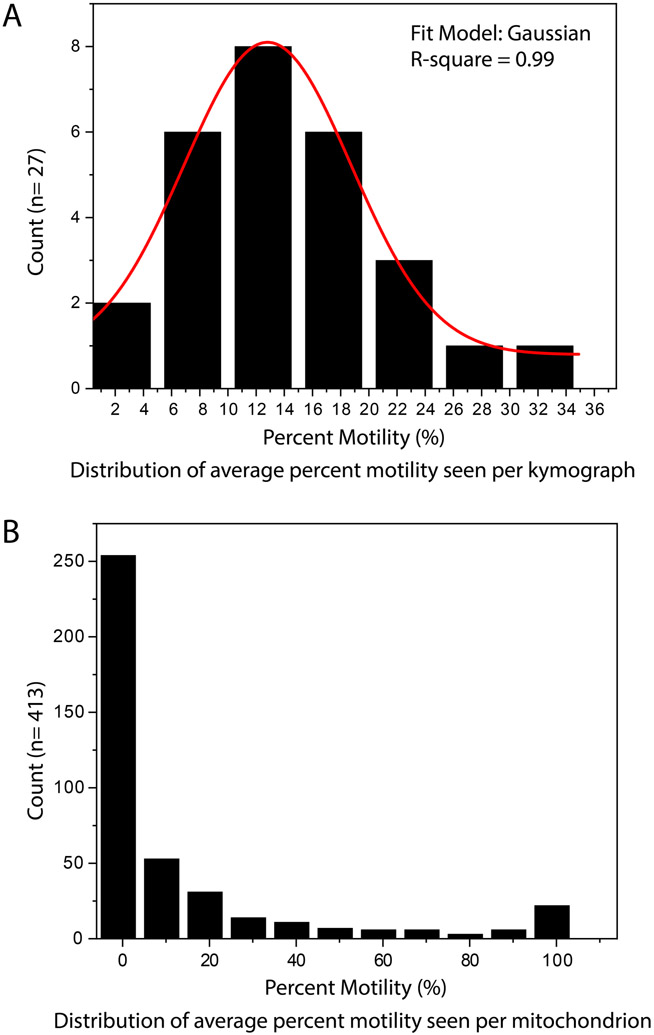
The movement of intracellular cargo, such as transcripts, proteins, and organelles, is fundamental to cellular function. Neurons, due to their long axons and dendrites, are particularly dependent on proper intracellular trafficking and vulnerable to defects in the movement of intracellular cargo that are noted in neurodegenerative and neurodevelopmental disorders. Accurate quantification of intracellular transport is therefore needed for studying the mechanisms of cargo trafficking, the influence of mutations, and the effects of potentially therapeutic pharmaceuticals. In this article, we introduce an algorithm called "Kymolyzer." The algorithm can quantify intracellular trafficking along a defined path, such as that formed by the aligned microtubules of axons and dendrites. Kymolyzer works as a semi-autonomous kymography software application. It constructs and analyzes kymographs to measure the movement and distribution of fluorescently tagged objects along a user-defined path. The algorithm can be used under a wide variety of experimental conditions and can extract a diverse array of motility parameters describing intracellular movement, including time spent in motion, percentage of objects in motion, percentage of objects that are stationary, and velocities of motile objects. This article serves as a user manual describing the design of Kymolyzer, providing a stepwise protocol for its use and illustrating its functions with common examples. © 2020 Wiley Periodicals LLC Basic Protocol: Kymolyzer, a semi-autonomous kymography tool to analyze intracellular motility.

Keywords: intracellular trafficking; kymography; neuron; semi-autonomous software.


Figures

Figure 1.
Figure 1.. Example of fluorescently tagged mitochondrial movement in a distal axon segment, illustrating step 1 of Kymolyzer.
A distal axon segment expressing GFP (addgene: 54767) to mark the cytosol and having dsRED tagged mitochondria (addgene: 55838) is shown (A). A new image is made from the mitochondrial channel depicting maximum intensity projection (MIP) in time (B). As the density of mitochondria is relatively low in the distal axon, any single time frame of the mitochondrial channel cannot be used to visualize the entire axon segment. However, as the mitochondria are highly motile along the entire axon segment, the MIP of the mitochondrial channel allows the visualization of the whole segment. The MIP is then used to draw a segmented line along the axis of movement (x’) (C). Alternatively, the GFP channel can also be utilized to draw the axis of movement. The x’axis is drawn from left to right representing an orientation that starts nearer to the cell body and progresses away from it. The kymograph is built by plotting the intensities along the defined x’ axis against time (represented in the Y-axis) (D).
Figure 2.
Figure 2.. Example kymograph illustrating step 2 of Kymolyzer.
The user selects key points on the kymograph marking the movements of an object. These are shown as yellow dots on the kymograph (left panel). The key points indicate changes in the object’s speed and directionality. Kymolyzer then interpolates the selected points to effectively track the object in each frame (middle panel). After the user confirms the fidelity of tracking, the algorithm loops back to the previous step to mark another track. All marked tracks are displayed as colored paths on the kymograph. Through this re-iterative process, the user marks all the object tracks on the kymograph (right panel). Horizontal scale bar on kymograph depicts 10μm and vertical scale bar depicts 30s.
Figure 3.
Figure 3.. Example kymograph illustrating step 3 of Kymolyzer.
In step 3 of Kymolyzer, each object track is broken down into a defined number of temporal segments which are classified according to direction and speed. The motility parameters for each object are then derived from analyzing the velocities of the temporal segments that make up the object track. In this example, one such object track (marked in red) is shown on the kymograph (left panel). To quantify its motility, Kymolyzer breaks down the movement of the object into five-second segments, each of which is analyzed for speed and directionality and classified accordingly. Two sets of three consecutive segments of the track depicted in red are magnified and shown (right panels). The individual segments are boxed in white and their classifications are indicated. Horizontal scale bar on kymograph depicts 10μm and vertical scale bar depicts 30s.
Figure 4.
Figure 4.. Examples of distributions of data got after tracking objects in Kymolyzer.
Histograms of motility data obtained by analyzing and collating data from 27 axons with a total of 413 discrete mitochondria are shown. During data collation, when the average motility per kymograph is considered, the data generally follows a Gaussian trend (A). Data samples showing normal or close to normal distribution can be analyzed with traditional t-tests and summarized by their mean or median. However, when plotted per mitochondrion (object-wise collation), the data does not follow a normal distribution (B). Data that are not normally distributed should be analyzed with non-parametric statistical tests.
Figure 5.
Figure 5.. Choosing optimal temporal resolution for reliable quantification by Kymolyzer.
Kymographs depicting movement of mitochondria in a neuronal axon (top panels, same example as that used in figure 1) with different temporal resolutions. When mitochondrial movement is imaged at a high temporal resolution (3.3Hz), the object tracks appear as un-broken lines in the kymograph and object tracks that cross can be easily differentiated (lower-left panel). To simulate the effects of a low temporal resolution, the same kymograph was plotted with only a subset of frames from the original movie to reduce the temporal resolution to 0.3Hz (lower-right panel). In this case, the motile objects form broken lines. At areas where multiple objects cross (arrow), the tracks cannot be assigned confidently to their proper objects. Thus, while a temporal resolution of 3.33 Hz is enough to track neuronal mitochondria reliably, a temporal resolution of 0.3 Hz is not optimal. Horizontal scale bars on both kymographs depict 10μm and vertical scale bars depict 30s.
Figure 6.
Figure 6.. Impact of temporal segment length on motility quantifications.
The track of a single mitochondrion (marked in red, A, left panel) from a kymograph of axonal mitochondria is analyzed with Kymolyzer using different temporal segmentations. A magnified portion of the object track is shown (A, right panel). An example of a processive movement is marked (arrowhead) along with a small non-processive movement, also referred to as a jitter or jiggle (arrow) (A). The movement is analyzed by breaking down the object track into temporal segments that are 5s, 15s, or 0.6s (B). Kymolyzer records the position of the object every 5s, 15s or 0.6s. With 5s temporal segmentation (B, left panel), movement due to small jitters is eliminated, while processive movement is retained and quantified. When the temporal segmentation is too large (B, middle panel), the net movement and speed are artificially reduced. Conversely, the 0.6s segmentation (B, right panel) results in a higher net movement and speed, as transient changes in behavior and small jitters in the object track are now included. Horizontal scale bar on kymograph depicts 10μm and vertical scale bar depicts 30s.

References

    1. Alieva NO, Efremov AK, Hu S, Oh D, Chen Z, Natarajan M, … Bershadsky AD (2019). Myosin IIA and formin dependent mechanosensitivity of filopodia adhesion. Nat Commun, 10(1), 3593. doi:10.1038/s41467-019-10964-w - DOI - PMC - PubMed
    1. Baloh RH, Schmidt RE, Pestronk A, & Milbrandt J (2007). Altered axonal mitochondrial transport in the pathogenesis of Charcot-Marie-Tooth disease from mitofusin 2 mutations. J Neurosci, 27(2), 422–430. doi:10.1523/JNEUROSCI.4798-06.2007 - DOI - PMC - PubMed
    1. Bielska E, Higuchi Y, Schuster M, Steinberg N, Kilaru S, Talbot NJ, & Steinberg G (2014). Long-distance endosome trafficking drives fungal effector production during plant infection. Nat Commun, 5, 5097. doi:10.1038/ncomms6097 - DOI - PMC - PubMed
    1. Brangwynne CP, Koenderink GH, MacKintosh FC, & Weitz DA (2009). Intracellular transport by active diffusion. Trends Cell Biol, 19(9), 423–427. doi:10.1016/j.tcb.2009.04.004 - DOI - PubMed
    1. Chaphalkar AR, Jain K, Gangan MS, & Athale CA (2016). Automated Multi-Peak Tracking Kymography (AMTraK): A Tool to Quantify Sub-Cellular Dynamics with Sub-Pixel Accuracy. PLoS One, 11(12), e0167620. doi:10.1371/journal.pone.0167620 - DOI - PMC - PubMed

Publication types

LinkOut - more resources