. 2020 Jul 14;15(1):125-139.
doi: 10.1016/j.stemcr.2020.05.008. Epub 2020 Jun 11.

Hedgehog Activation Regulates Human Osteoblastogenesis

Affiliations

Hedgehog Activation Regulates Human Osteoblastogenesis

Shoko Onodera et al. Stem Cell Reports. .

Abstract

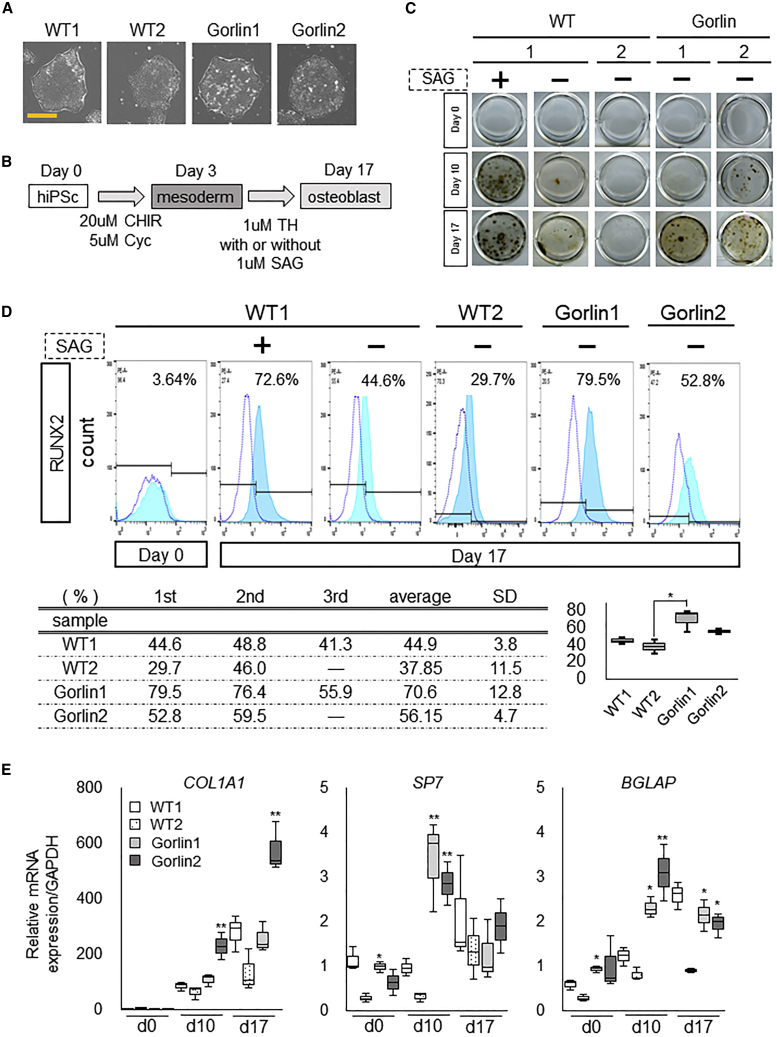
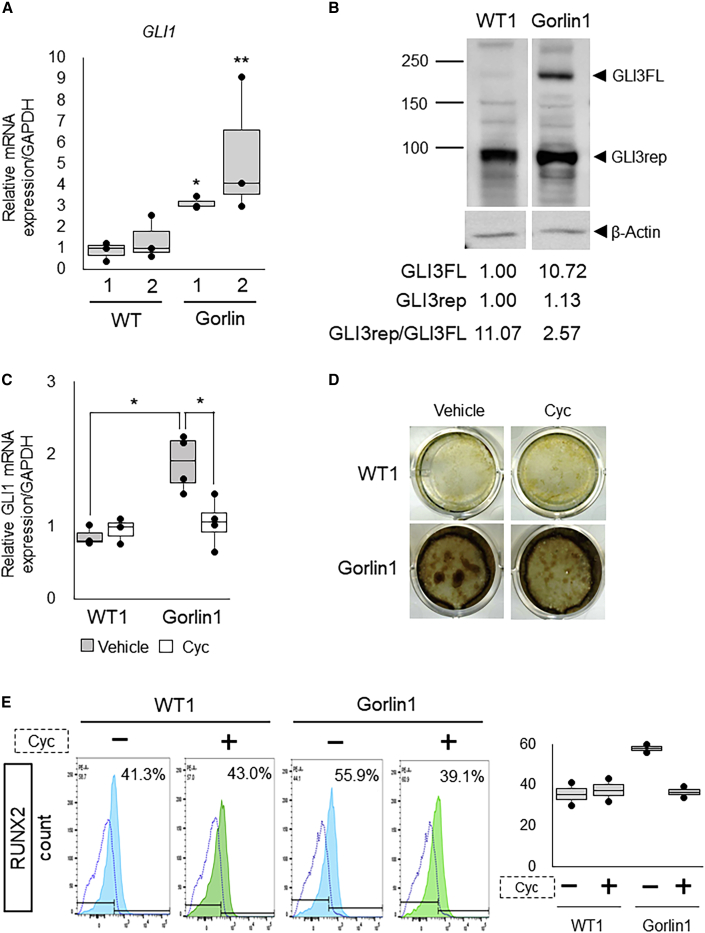
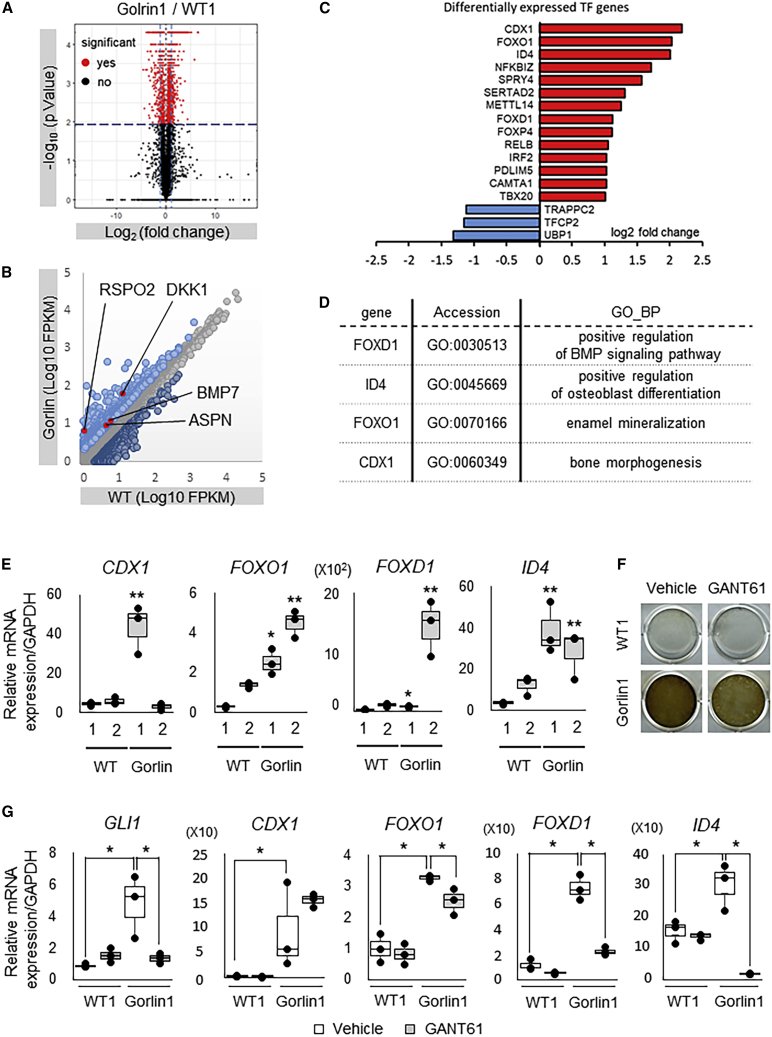
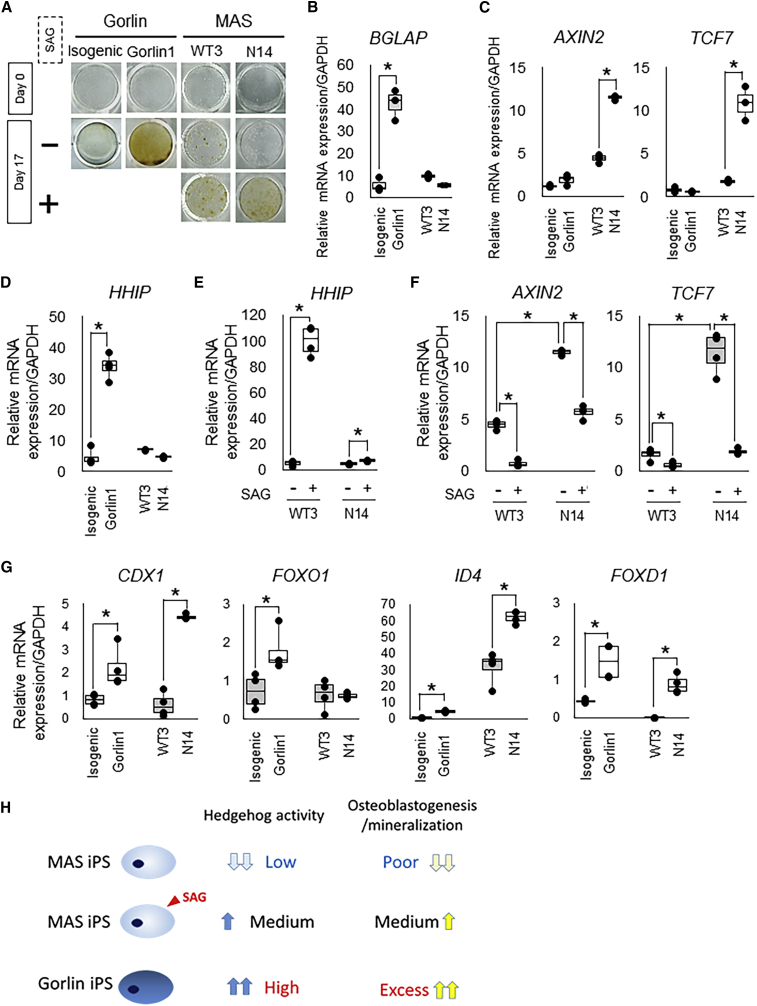
Two genetic diseases, Gorlin syndrome and McCune-Albright syndrome (MAS), show completely opposite symptoms in terms of bone mineral density and hedgehog (Hh) activity. In this study, we utilized human induced pluripotent stem cell (iPSC)-based models of the two diseases to understand the roles of Hh signaling in osteogenesis. Gorlin syndrome-derived iPSCs showed increased osteoblastogenesis and mineralization with Hh signaling activation and upregulation of a set of transcription factors in an osteogenic culture, compared with the isogenic control. MAS-specific iPSCs showed poor mineralization with low Hh signaling activity in the osteogenic culture; impaired osteoblastogenesis was restored to the normal level by treatment with an Hh signaling-activating small molecule. These data suggest that Hh signaling is a key controller for differentiation of osteoblasts from precursors. This study may pave a path to new drug therapies for genetic abnormalities in calcification caused by dysregulation of Hh signaling.

Keywords: Gorlin syndrome; McCune-Albright syndrome; calcification; fibrous dysplasia; hedgehog pathway; osteogenesis; patient-specific iPSC.


Figures

Figure 1
Figure 1
Osteogenic Capacities of Gorlin iPSCs in the Osteoblast Induction Culture (A) The morphology of colonies of WT and Gorlin iPSCs adapted to Essential 8 medium. Data of two lines (1 and 2) are shown for each type of iPSC. Scale bar, 100 μm. (B) A schematic of the protocol of the osteoblast induction culture. (C) Calcification in the osteoblast induction culture of WT and Gorlin iPSCs with or without SAG treatment. von Kossa staining was performed at days 0, 10, and 17 of the culture. Mineral deposition was detected as black staining. Data of two lines (1 and 2) are shown for each type of iPSC. (D) Quantification of RUNX2-positive cells in the osteoblast induction culture of WT and mutant (MT) iPSCs by flow cytometry (FCM). The cells were cultured under a condition with or without SAG as indicated. FCM analysis was performed for RUNX2 at days 0 and 17 of the culture. Blue dotted lines show signal intensities from staining with the immunoglobulin G (IgG) isotype control. Light blue lines show signal intensities from the staining with an anti-RUNX2 antibody. The positive gate was set to the area where the isotype control was present at around 8%. The FCM analyses were performed in two or three independent experiments using two lines (1 and 2) for each type of iPSC; a representative histogram is shown. (E) The mRNA expression of osteoblast marker genes in the osteoblast induction culture of WT and MT iPSCs without SAG. qRT-PCR analysis was performed at the indicated days of the cultures. Data are the means ± SD from three independent experiments using two lines (1 and 2) for each type of iPSC. p < 0.05 versus WT2 iPSCs at the indicated day of the culture. ∗∗p < 0.05 versus both WT1 and WT2 iPSCs at the indicated day of the culture.
Figure 2
Figure 2
Expression of GLI in the Gorlin iPSC-Derived Osteogenic Population (A) The mRNA expression of GLI1 in the osteoblast induction culture of WT and MT iPSCs without SAG. qRT-PCR analysis was performed at day 17 of the culture. Data are the means ± SD from three independent experiments using two lines (1 and 2) for each type of iPSC. p < 0.05 versus WT1 iPSCs. ∗∗p < 0.05 versus both WT1 and WT2 iPSCs. The normalized expressions are shown relative to those of calibrator samples (WT1 iPSCs on day 17). (B) Protein expression of endogenous GLI3 in the osteoblast induction culture of WT1 and Gorlin-1 iPSCs. The GLI3 expression was analyzed by immunoblotting using specific antibodies at day 17 of the culture. Band intensities were quantified by normalization to those of β-actin in each group. GLI3FL and GLI3rep indicate their relative intensity levels to WT1; GLI3rep/GLI3FL indicates the ratio of intensity levels of GLI3rep to those of GLI3FL in each group. (C) The mRNA expression of GLI1 in the osteoblast induction culture of WT1 and Gorlin-1 iPSCs with or without cyclopamine (Cyc). qRT-PCR analysis was performed at day 17 of the culture. Data are the means ± SD from three independent experiments. p < 0.05. The normalized expressions are shown relative to those of WT1 iPSCs on day 17. (D) Calcification in the osteoblast induction culture of WT1 and Gorlin-1 iPSCs with or without cyclopamine (Cyc). von Kossa staining was performed at day 17 of the culture. (E) Quantification of RUNX2-positive cells in the osteoblast induction culture of WT1 and Gorlin-1 iPSCs without SAG, in the presence or absence Cyc. FCM analysis was performed for RUNX2 at day 17 of the culture. Blue dotted lines show signal intensities from the staining with the IgG isotype control. Light blue and green lines show signal intensities from the staining with an anti-RUNX2 antibody.
Figure 3
Figure 3
Transcriptome Analyses in the Gorlin iPSC-Derived Osteogenic Population (A) The volcano plot of gene expression between WT1 and Golrin-1 cells differentiated from iPSCs in RNA-seq analysis. Statistical significance genes that were calculated by Cuffdiff with red dots. Dark blue line and light blue line were the criteria indicated in Figure S4B. (B) Scatterplot indicating the ratio of gene expressions between WT1 and Gorlin-1 cells differentiated from iPSCs in RNA-seq analysis. Upregulated genes and downregulated genes that were passed through the criteria indicated in Figure S4B are highlighted with light blue dots and dark blue dots, respectively. (C) Fold change expression of transcription factors in WT1 and Gorlin-1 cells identified as the differentially expressed genes. Fold change expressions of Gorlin-1 cells compared with WT1 cells are shown in log2 ratio. (D) A list of transcription factors that were upregulated in Gorlin-1 iPSCs compared with WT1 iPSCs and related with bones, mineralization, and osteoblast differentiation in GO analysis. (E) The mRNA expression of CDX1, FOXO1, FOXD1, and ID4 in the osteoblast induction culture of WT1, WT2, Gorlin-1, and Gorlin-2 iPSCs. qRT-PCR analysis was performed at day 17 of the culture. Data are the means ± SD from three independent experiments. p < 0.05 versus WT1 iPSCs. ∗∗p < 0.05 versus both WT1 and WT2 iPSCs. (F) Calcification in the osteoblast induction culture of WT1 and Gorlin-1 iPSCs with or without GANT61. von Kossa staining was performed at day 17 of the culture. (G) The mRNA expression of GLI1, CDX1, FOXO1, FOXD1, and ID4 in the osteoblast induction culture of WT1 and Gorlin-1 iPSCs with or without GANT61. qRT-PCR analysis was performed at day 17 of the culture. Data are the means ± SD from three independent experiments. When ANOVA indicated differences among the groups, multiple comparisons among each experimental group were performed using Danette t test. Statistical significance was defined at p < 0.05. Only GLI1 mRNA, the normalized expressions are shown relative to those of WT1 iPSCs on day 17.
Figure 4
Figure 4
Comparison of Osteogenic Capacities between Gorlin iPSCs and Their Isogenic Control iPSCs in the Osteoblast Induction Culture (A) The mRNA expression of WT and mutated PTCH1 alleles under a serum starvation condition (DMEM supplemented with 0.5% fetal bovine serum) in Gorlin-1, their isogenic control iPSCs, and WT3. qRT-PCR analysis was performed at day 2 of the culture. Data are the means ± SD from three independent experiments. p < 0.05. (B) The mRNA expression of GLI1 and HHIP under the serum starvation condition in Gorlin-1 and their isogenic control iPSCs. qRT-PCR analysis was performed at day 2 of the culture. Data are the means ± SD from three independent experiments. p < 0.05. (C) The mRNA expression of GLI1 and HHIP in the osteoblast induction culture of Gorlin-1 and their isogenic control iPSCs. qRT-PCR analysis was performed at day 17 of the culture. Data are the means ± SD from three independent experiments. p < 0.05. The normalized expressions are shown relative to those of isogenic control iPSCs on day 17. (D) Quantification of RUNX2-positive cells in the osteoblast induction culture of Gorlin-1 and their isogenic control iPSCs. FCM analysis was performed for RUNX2 at days 10 and 17 of the culture. Blue dotted lines show signal intensities from the staining with the IgG isotype control. Light blue and green lines show signal intensities from the staining with an anti-RUNX2 antibody. (E) The mRNA expression of osteoblast marker genes in the osteoblast induction culture of Gorlin-1 and their isogenic control iPSCs. qRT-PCR analysis was performed at the indicated days of the cultures. Data are the means ± SD from three independent experiments. p < 0.05. (F) Calcification in the osteoblast induction culture of Gorlin-1 and their isogenic control iPSCs. von Kossa staining was performed at day 17 of the culture. (G) The mRNA expression of CDX1, FOXO1, ID4, and FOXD1 in the osteoblast induction culture of Gorin 1 and their isogenic control iPSCs. qRT-PCR analysis was performed at day 17 of the culture. Data are the means ± SD from three independent experiments. p < 0.05.
Figure 5
Figure 5
Hedgehog Activation Rescued a Calcification of GNAS-Mutated MAS iPSC-Derived Osteoblasts (A) Calcification in the osteoblast induction culture of Gorlin-1 iPSCs, their isogenic control iPSCs, MAS iPSCs (N14), and their parental cells (WT3) with or without SAG treatment. von Kossa staining was performed at days 0 and 17 of the osteoblast induction culture. Mineral deposition was detected as black staining. (B) The mRNA expression of BGLAP in the osteoblast induction culture of Gorlin-1 iPSCs, their isogenic control iPSCs, MAS iPSCs (N14), and their parental cells (WT3). qRT-PCR analysis was performed at day 17 of the culture. Data are the means ± SD from three independent experiments. p < 0.05. (C) The mRNA expression of AXIN2 and TCF7 in the osteoblast induction culture of Gorlin-1 iPSCs, their isogenic control iPSCs, MAS iPSCs (N14), and their parental cells (WT3). qRT-PCR analysis was performed at day 17 of the culture. Data are the means ± SD from three independent experiments. p < 0.05. (D) The mRNA expression of HHIP in the osteoblast induction culture of Gorlin-1 iPSCs, their isogenic control iPSCs, MAS iPSCs (N14), and their parental cells (WT3). qRT-PCR analysis was performed at day 17 of the culture. Data are the means ± SD from three independent experiments. p < 0.05. (E) The mRNA expression of HHIP in the osteoblast induction culture treated with or without SAG of MAS iPSCs (N14) and their parental cells (WT3). qRT-PCR analysis was performed at day 17 of the culture. Data are the means ± SD from three independent experiments. p < 0.05. (F) The mRNA expression of AXIN2 and TCF7 in the osteoblast induction culture treated with or without SAG of MAS iPSCs (N14) and their parental cells (WT3). qRT-PCR analysis was performed at day 17 of the culture. Data are the means ± SD from three independent experiments. p < 0.05. (G) The mRNA expression of CDX1, FOXO1, ID4, and FOXD1 in the osteoblast induction culture of Gorlin-1 iPSCs, their isogenic control iPSCs, MAS iPSCs (N14), and their parental cells (WT3). qRT-PCR analysis was performed at day 17 of the culture. Data are the means ± SD from three independent experiments. p < 0.05. (H) Schematic illustration of possible molecular mechanisms underlying phenotypes of osteoblasts derived from MAS iPSCs (top), MAS iPSCs with Hh activators (middle), and Gorlin iPSCs (bottom).

References

    1. Albright F., Butler A.M., Hampton A.O., Smith P., Butler A., Hampton A., Smith P., Mastorakos G., Mitsiades N., Doufas A. Syndrome characterized by osteitis fibrosa disseminata, areas of pigmentation and endocrine dysfunction, with precocious puberty in females. N. Engl. J. Med. 1937;216:727–746.
    1. Alman B.A. The role of hedgehog signalling in skeletal health and disease. Nat. Rev. Rheumatol. 2015;11:552–560. - PubMed
    1. Alvarez-Medina R., Cayuso J., Okubo T., Takada S., Martí E. Wnt canonical pathway restricts graded Shh/Gli patterning activity through the regulation of Gli3 expression. Development. 2008;135:237–247. - PubMed
    1. Ambrogini E., Almeida M., Martin-Millan M., Paik J.H., DePinho R.A., Han L., Goellner J., Weinstein R.S., Jilka R.L., O’Brien C.A. FoxO-mediated defense against oxidative stress in osteoblasts is indispensable for skeletal homeostasis in mice. Cell Metab. 2010;11:136–146. - PMC - PubMed
    1. Bodine P.V.N., Zhao W., Kharode Y.P., Bex F.J., Lambert A.-J., Goad M.B., Gaur T., Stein G.S., Lian J.B., Komm B.S. The Wnt antagonist secreted frizzled-related protein-1 is a negative regulator of trabecular bone formation in adult mice. Mol. Endocrinol. 2004;18:1222–1237. - PubMed

Publication types

MeSH terms

LinkOut - more resources