. 2020 Jul 9;182(1):189-199.e15.
doi: 10.1016/j.cell.2020.05.024. Epub 2020 Jun 11.

Population Structure, Stratification, and Introgression of Human Structural Variation

Affiliations

Population Structure, Stratification, and Introgression of Human Structural Variation

Mohamed A Almarri et al. Cell. .

Abstract

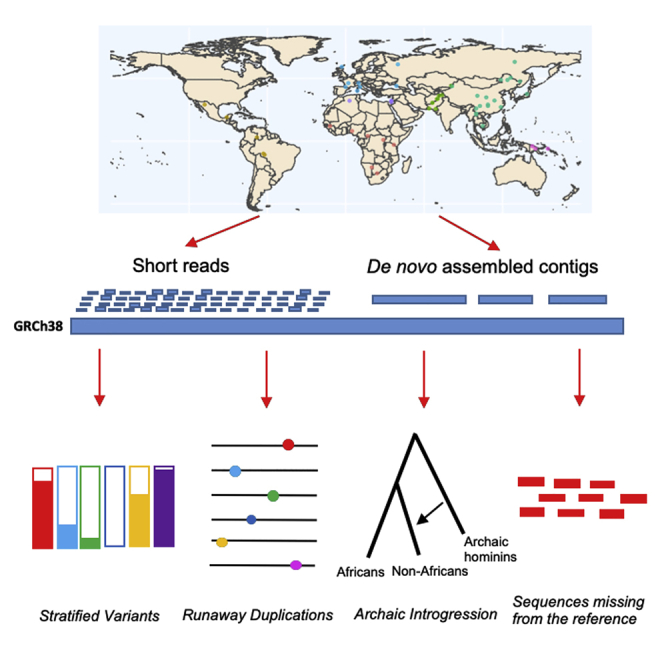
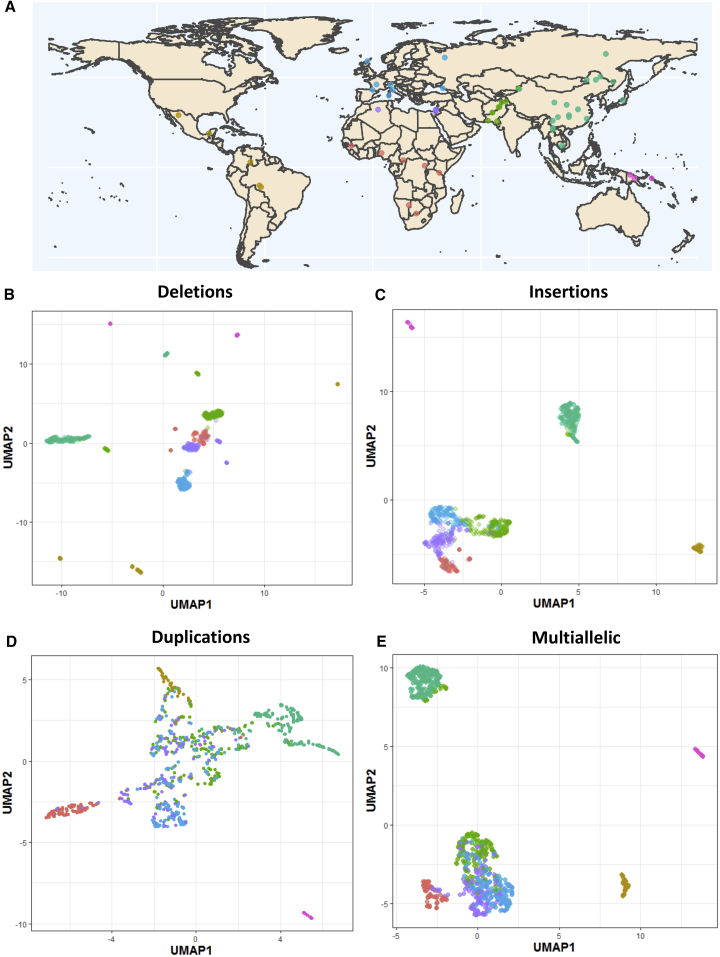
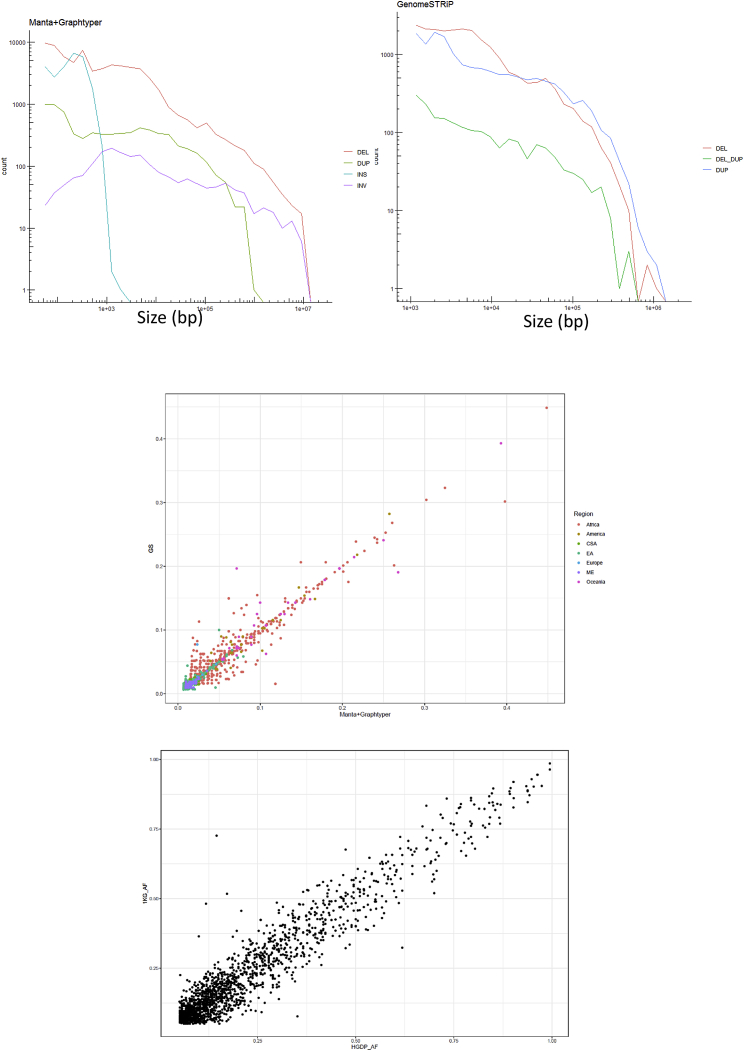
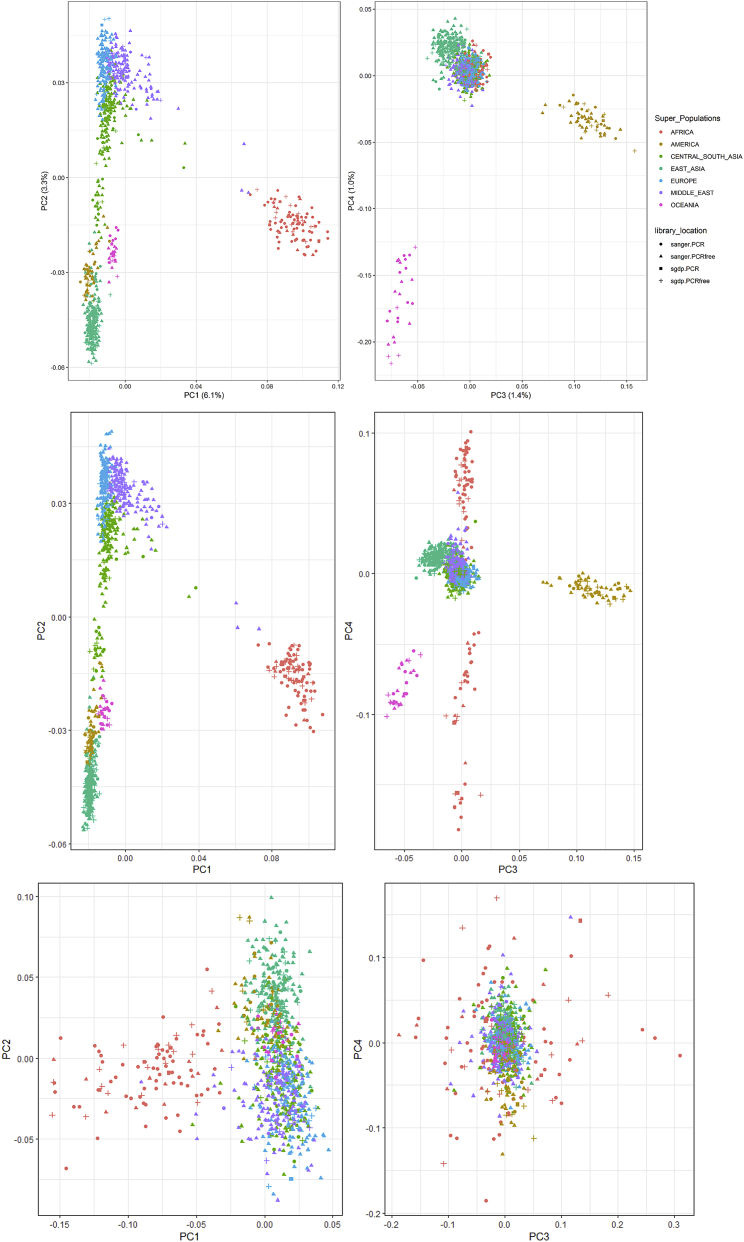
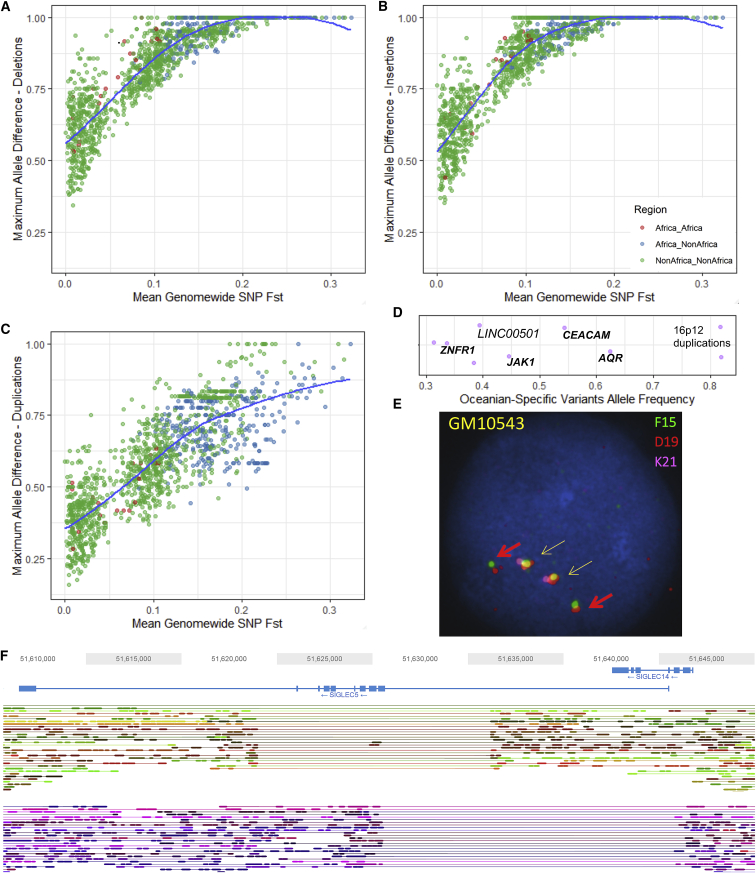
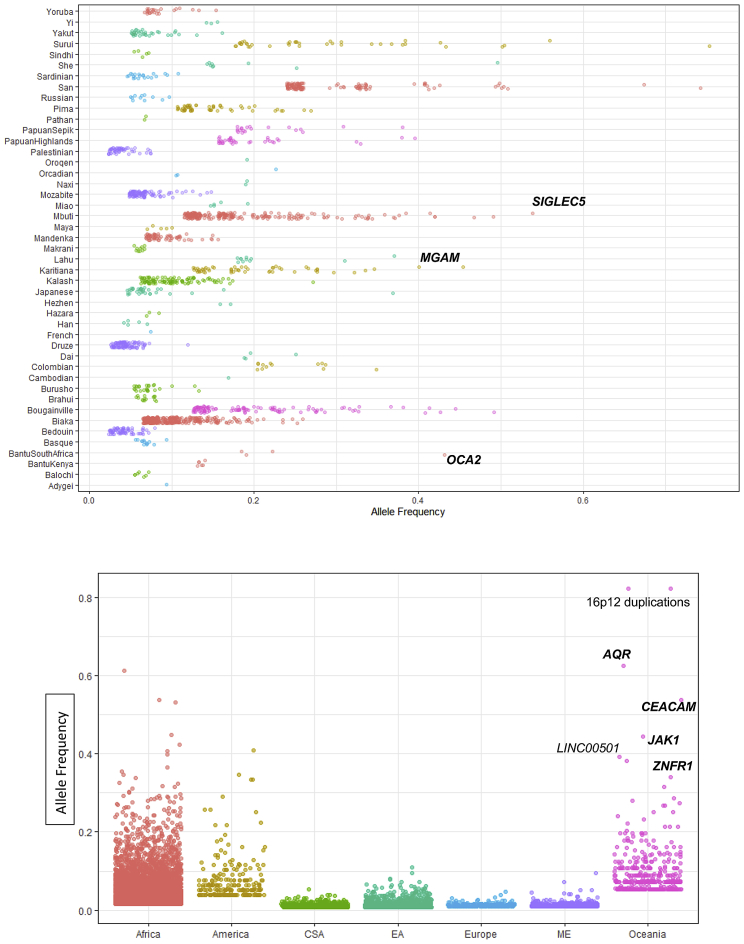
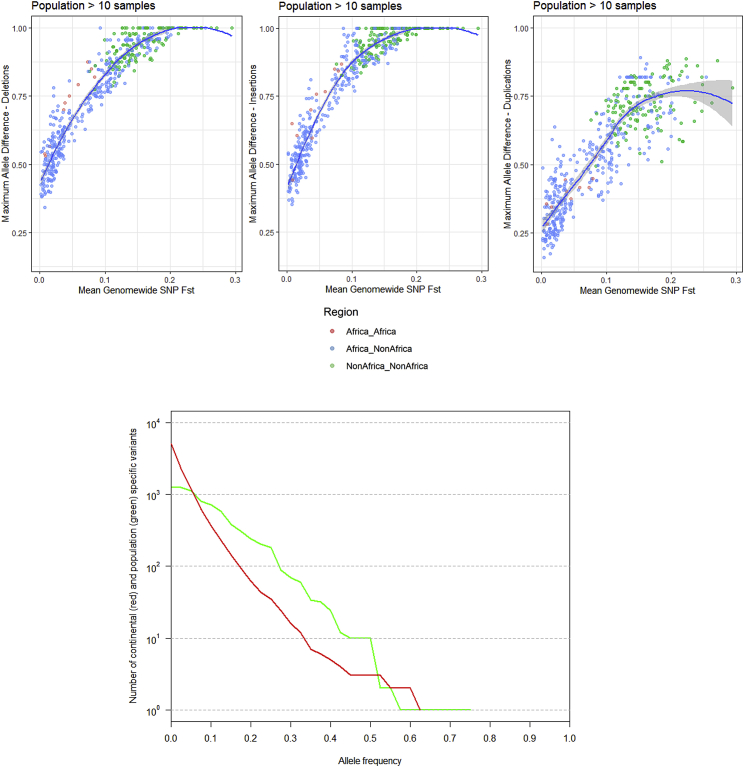
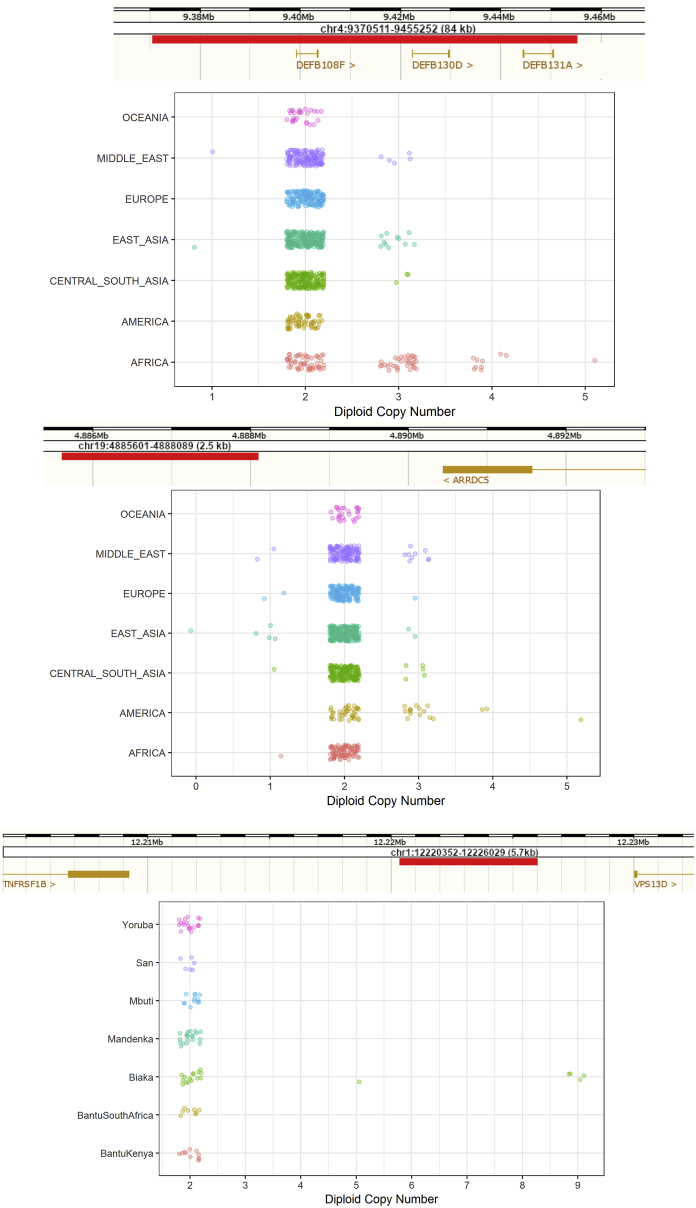
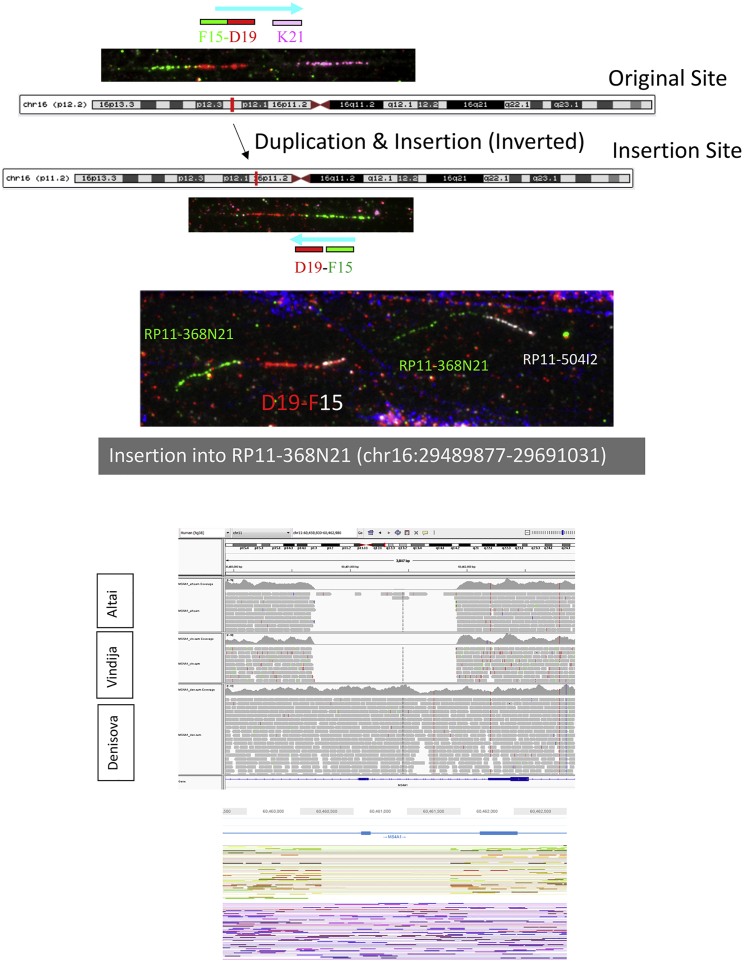
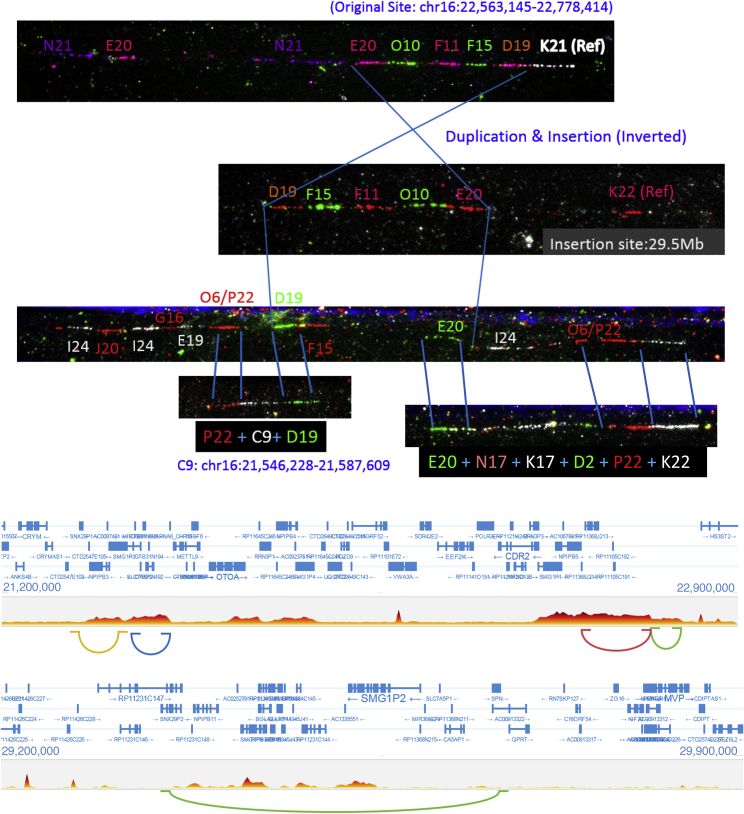
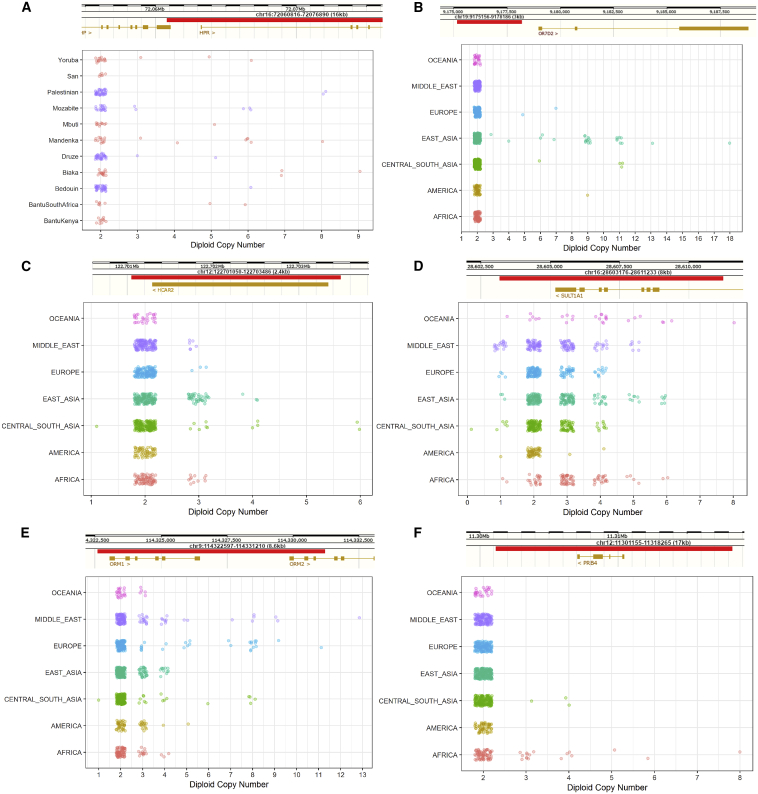
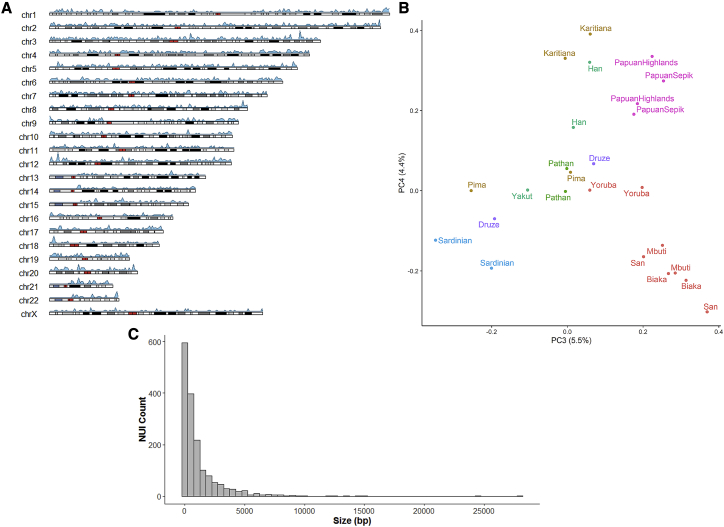
Structural variants contribute substantially to genetic diversity and are important evolutionarily and medically, but they are still understudied. Here we present a comprehensive analysis of structural variation in the Human Genome Diversity panel, a high-coverage dataset of 911 samples from 54 diverse worldwide populations. We identify, in total, 126,018 variants, 78% of which were not identified in previous global sequencing projects. Some reach high frequency and are private to continental groups or even individual populations, including regionally restricted runaway duplications and putatively introgressed variants from archaic hominins. By de novo assembly of 25 genomes using linked-read sequencing, we discover 1,643 breakpoint-resolved unique insertions, in aggregate accounting for 1.9 Mb of sequence absent from the GRCh38 reference. Our results illustrate the limitation of a single human reference and the need for high-quality genomes from diverse populations to fully discover and understand human genetic variation.

Keywords: Human Genome Diversity Project; archaic introgression; denisova; diverse genomes; neanderthal; runaway duplications; sequences missing from the reference; structural variation.


Conflict of interest statement

Declaration of Interests M.E.H. is a co-founder of, director of, share-holder in, and consultant to Congenica.

Figures

None
Graphical abstract
Figure 1
Figure 1
The HGDP Dataset and Population Structure (A) The HGDP dataset. Each point and color represents a population and its regional label, respectively. Colors of regional groups are consistent throughout the study. See Table S1 for more details. (B) UMAP of biallelic deletion genotypes. (C) UMAP of insertions. (D) UMAP of biallelic duplications. (E) UMAP of multiallelic variants. See Figure S2 for more details.
Figure S1
Figure S1
Dataset Quality Control, Related to STAR Methods Top: Size distribution of identified variants that passed all filters and were included in the final callset. Note the differences in scales between the two plots. Left: Manta+Graphtyper. Right: GenomeSTRiP – green line shows variants that have both deletion and duplication alleles. Centre: Correlation of allele frequency of variants identified by both Manta+Graphtyper and GenomeSTRiP within the HGDP dataset (Regional-specific variants, colored by region). Bottom: Allele frequency correlations between deletions identified in the 1000G and the HGDP Manta+Graphtyper callset (using African variants > 5% frequency in 1KG).
Figure S2
Figure S2
Population Structure, Related to Figure 1 and STAR Methods No batch effects identified between samples prepared using different library preparations and sequenced in different centers. Top: PCA (1-4) of GenomeSTRiP biallelic deletion genotypes by sample library preparation and sequencing location. Centre: PCA1-4 of Manta+Graphtyper deletion genotypes by sample library preparation and sequencing location. Bottom: PCA1-4 of Manta+Graphtyper inversion genotypes by sample library preparation and sequencing location.
Figure 2
Figure 2
Population Stratification of Structural Variants (A) Maximum allele frequency difference of deletions as a function of population differentiation for 1,431 pairwise population comparisons. The blue curve represents locally estimated scatterplot smoothing (LOESS) fits. (B and C) The same as (A) but for insertion (B) and biallelic duplications (C). (D) High-frequency Oceania-specific variants (>30% frequency). See Figure S3 for more details. Each point represents a variant, with the x axis illustrating its frequency. Random noise is added to aid visualization. Almost all variants are shared with the Denisovan genome and are within (bold) or near the illustrated genes. (E) Fluorescence in situ hybridization illustrating the 16p12 Oceania-specific duplication shared with Denisova in a homozygous state (cell line GM10543). Yellow arrows show reference, and red arrows illustrate duplication. See Figure S6 and S7 for more details. (F) Distinct deletions at the SIGLEC5/SIGLEC14 locus in an Mbuti sample (HGDP00450), resolved using linked reads. Lines connecting reads illustrate that they are linked; i.e., they are from the same input DNA molecule. One haplotype (top) carries the Mbuti-specific variant that deletes most exons in SIGLEC5 and is present at high frequency (54%), whereas the second haplotype (bottom) carries a globally common deletion that deletes SIGLEC14, creating a fused gene (see STAR Methods for more details).
Figure S3
Figure S3
Population- and Region-Specific Variation, Related to Figures 2D–2F Top: Population-specific variation - Each point represents a variant private to a population (n > 2) with the x axis reflecting its frequency. Colors represent regional labels and random noise is added to aid visualization. High-frequency variants discussed in the text are highlighted. Bottom: Regional-Specific Variation – Each point represents a variant private to a regional group (n > 2) with the y axis illustrating its frequency. Random noise is added to aid visualization. The distribution reflects the ancestral diversity in Africa, the connectivity of Eurasia, the isolation & drift of the Americas and Oceania, and the separate Denisovan introgression event in Oceania. Oceania is notable for having private high-frequency variants that are all shared with the Denisovan genome and are within (bold) or near the illustrated genes, four of which are newly identified in this study (AQR, CEACAM, JAK1, ZNFR1). The Americas contain high frequency variants which are not shared with any archaic genomes, suggesting they arose and increased to high-frequency after they split from other populations. EA: East Asia, CSA: Central & South Asia, ME: Middle East.
Figure S4
Figure S4
Population Stratification and Unreported Variants, Related to Figures 2A–2C and STAR Methods Top: Population Stratification: Maximum allele frequency difference as a function of population differentiation. Blue line is loess fits after excluding populations with 10 samples or less. Deletions (Left), Insertions (Centre), Duplications (Right). Bottom: Variants not present in 1000G or SGDP. Continental (red) or Population (green) specific variants (n > 2) in the HGDP not found in 1000G or SGDP SV callsets binned by allele frequency. The same variant can be present in both distributions.
Figure S5
Figure S5
Additional Copy Number Expansions, Related to Figure 3 Red bar illustrates region expanded. Top: Expansions in beta-Defensin genes. Centre: Expansions downstream of ARRDC5 prominent in Americans. Bottom: Expansion downstream TNFRSF1B private to Biaka.
Figure S6
Figure S6
Putatively Introgressed Variants, Related to Figure 2E and Table 1 Top: fiber-FISH of chr16 Oceanian-specific expansion shared with Denisovan genome at ∼82% frequency in all three Oceanian populations. Cartoon illustration of location of original (16p12.2) and inserted site 7Mb away (16p11.2) into clone RP11-368N21 (green). Bottom: MS4A1 deletion: IGV screenshot of a deletion in an exon of MS4A1, which encodes the B cell differentiation antigen CD20. The deletion is shared by both Neanderthals (Altai top, Vindija middle track) and American populations (reaches ∼26% in Surui and Pima). The deletion is not present in the Denisovan genome (lower track). Bottom track shows Loupe screenshot of the region in HGDP01043 showing the two haplotypes resolved using 10x linked-reads, with one carrying the deletion.
Figure S7
Figure S7
Chr16 Oceanian-Specific Expansion, Related to Figure 2E and Table 1 Top: Fiber-FISH illustrating the original site (top), the (inverted) insertion sites (center) and the region surrounding the insertion site (bottom). Region flanking the insertion site (C9) is a sequence 1Mb away from the original site, consistent with GenomeSTRiP calling a second duplication at this site in perfect LD with the initial duplication. Manta also identifies a Papuan-specific inversion at this locus. This suggests a complex event involving a duplication-inverted-insertion, an inversion and a deletion. Bottom: 10X-linked reads barcode overlap in region. Longranger also identifies a complex event at this locus. Top plot shows the original site barcode overlap and the regions of structural rearrangements, including the region of C9 (on the left). Bottom shows the insertion site. Note that this region is gene rich, and the candidate gene(s) under selection is not known and requires further study.
Figure 3
Figure 3
Copy Number Expansions and Runaway Duplications The red bars illustrate the location of the expansion. Additional examples are shown in Figure S5. (A) Expansion in HPR in African and Middle Eastern samples. (B) Expansions upstream of OR7D2 that are mostly restricted to East Asia. The observed expansions in Central and South Asian samples are all in Hazara samples, an admixed population carrying East Asian ancestry. (C) Expansions within HCAR2 that are particularly common in the Kalash population. (D) Expansions in SULT1A1 that are pronounced in Oceanians (median copy number, 4; all other non-African continental groups, 2; Africa, 3). (E) Expansions in ORM1/ORM2. This expansion has been reported previously in Europeans (Handsaker et al., 2015); however, we found it in all regional groups and particularly in Middle Eastern populations. (F) Expansions in PRB4 that are restricted to Africa and Central and South Asian samples with significant African admixture (Makrani and Sindhi).
Figure 4
Figure 4
Non-reference Unique Insertions (A) Ideogram illustrating the density of identified non-reference unique insertion (NUI) locations across different chromosomes using a window size of 1 Mb. Colors on chromosomes reflect chromosomal bands, with red for centromeres. (B) Principal-component analysis (PCA) of NUI genotypes showing population structure (principal component 3 [PC3] and PC4). Previous PCs potentially reflect variation in size and the quality of the assemblies. (C) Size distribution of NUIs using a bin size of 500 bp.

Comment in

References

    1. Akay A., Di Domenico T., Suen K.M., Nabih A., Parada G.E., Larance M., Medhi R., Berkyurek A.C., Zhang X., Wedeles C.J. The helicase aquarius/EMB-4 is required to overcome intronic barriers to allow nuclear RNAi pathways to heritably silence transcription. Dev. Cell. 2017;42:241–255.e6. - PMC - PubMed
    1. Akkaya M., Barclay A.N. How do pathogens drive the evolution of paired receptors? Eur. J. Immunol. 2013;43:303–313. - PubMed
    1. Ali S.R., Fong J.J., Carlin A.F., Busch T.D., Linden R., Angata T. Siglec-5 and Siglec-14 are polymorphic paired receptors that modulate neutrophil and amnion signaling responses to group B Streptococcus. Journal of Experimental Medicine. 2014;211:1231–1242. - PMC - PubMed
    1. Angata T., Hayakawa T., Yamanaka M., Varki A., Nakamura M. Discovery of Siglec-14, a novel sialic acid receptor undergoing concerted evolution with Siglec-5 in primates. FASEB J. 2006;20:1964–1973. - PubMed
    1. Audano P.A., Sulovari A., Graves-Lindsay T.A., Cantsilieris S., Sorensen M., Welch A.E., Dougherty M.L., Nelson B.J., Shah A., Dutcher S.K. Characterizing the major structural variant alleles of the human genome. Cell. 2019;176:663–675.e19. - PMC - PubMed

Publication types

LinkOut - more resources