. 2020 Aug 6;27(2):224-237.e6.
doi: 10.1016/j.stem.2020.05.008. Epub 2020 Jun 11.

Metabolic Reprograming via Deletion of CISH in Human iPSC-Derived NK Cells Promotes In Vivo Persistence and Enhances Anti-tumor Activity

Affiliations

Metabolic Reprograming via Deletion of CISH in Human iPSC-Derived NK Cells Promotes In Vivo Persistence and Enhances Anti-tumor Activity

Huang Zhu et al. Cell Stem Cell. .

Abstract

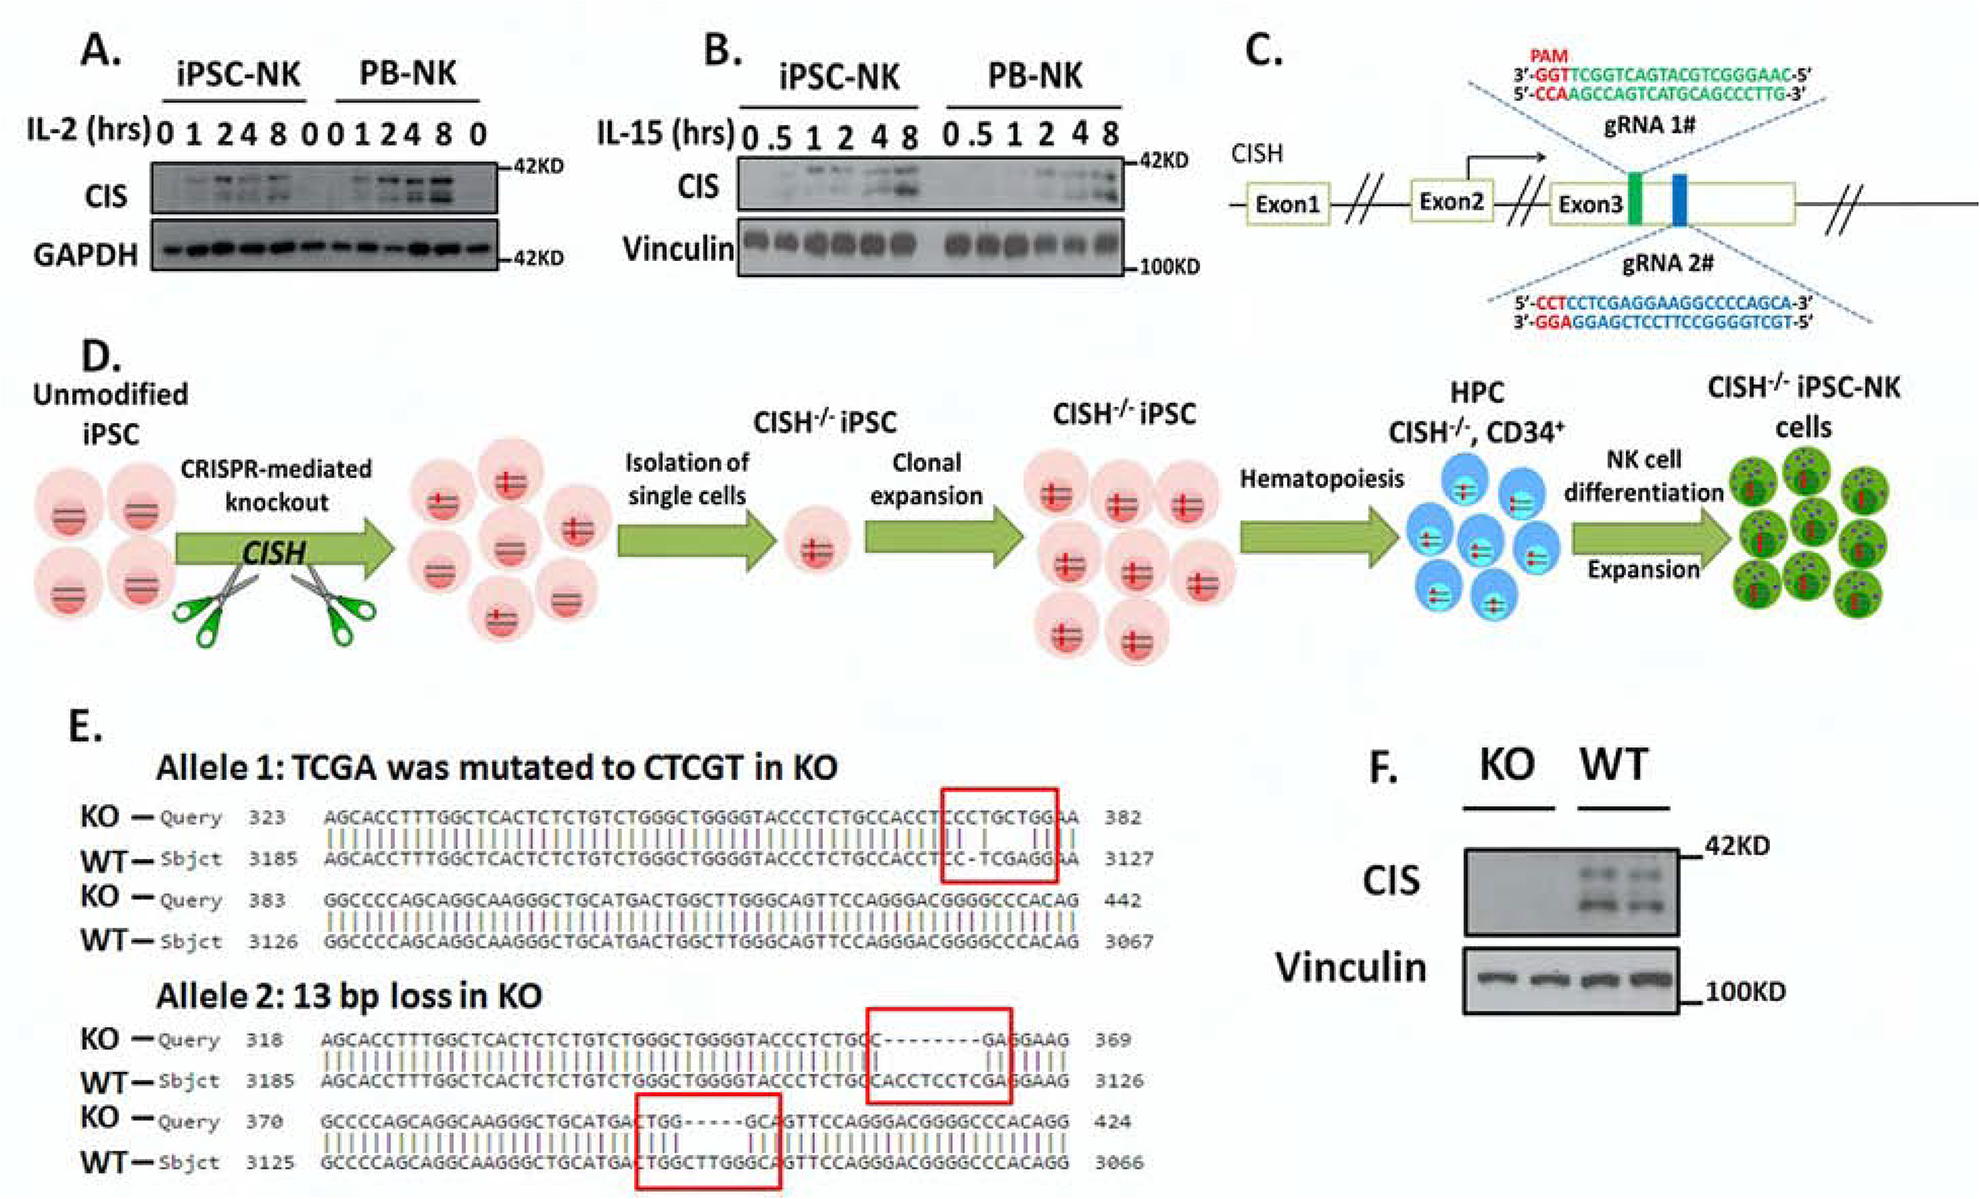
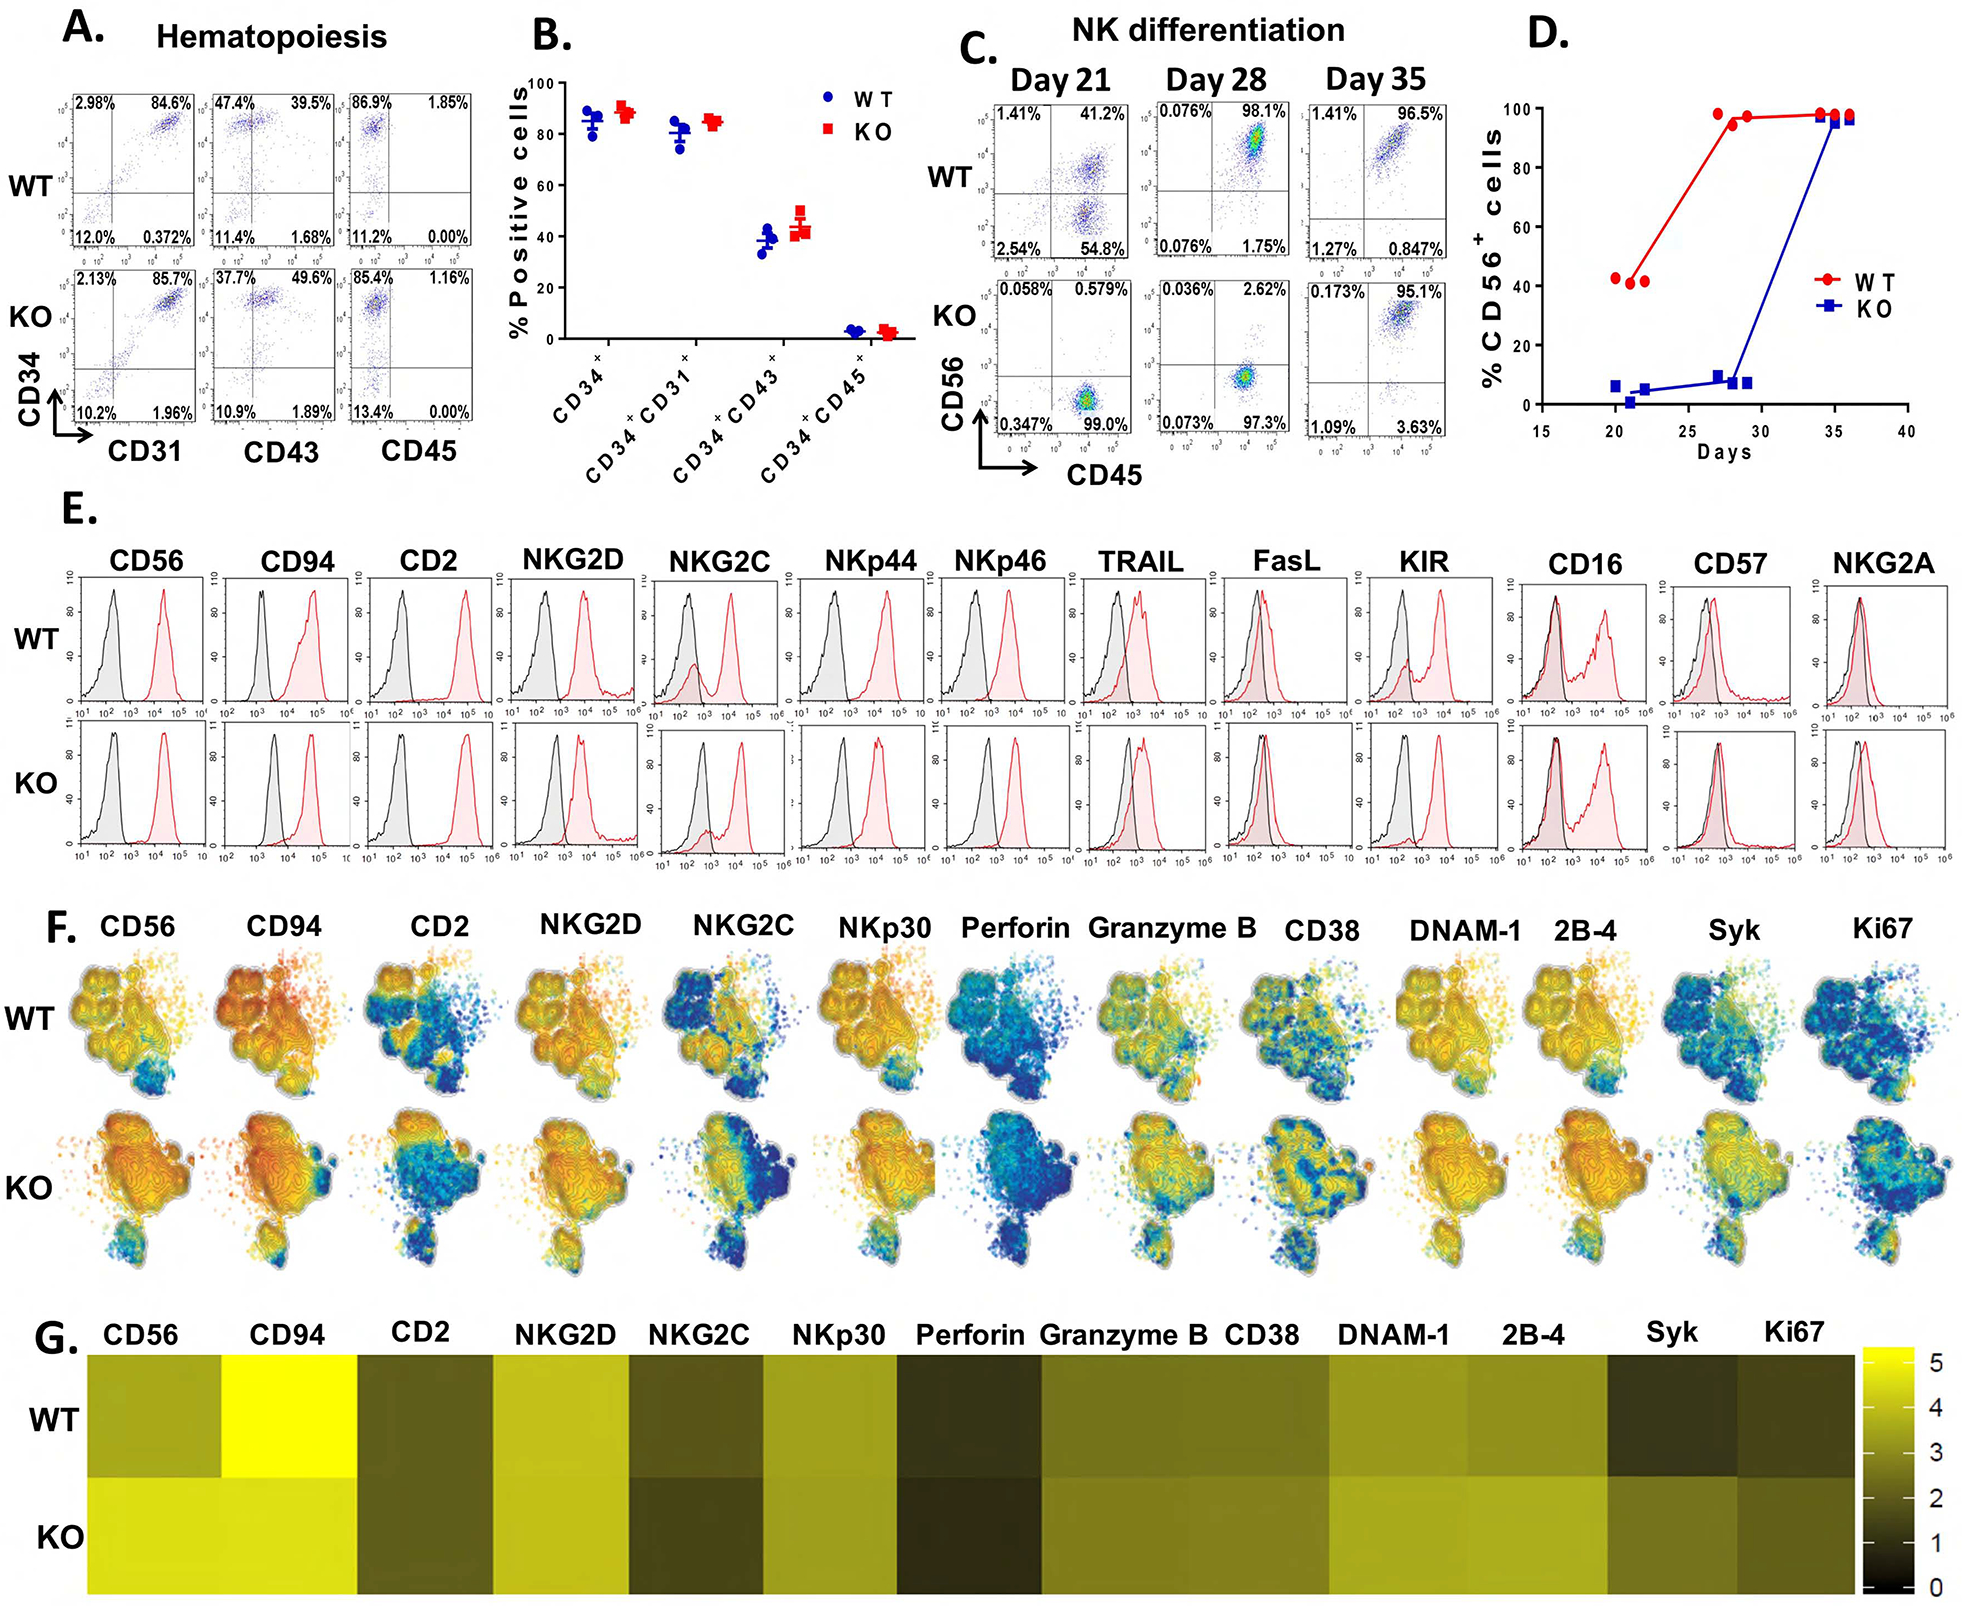
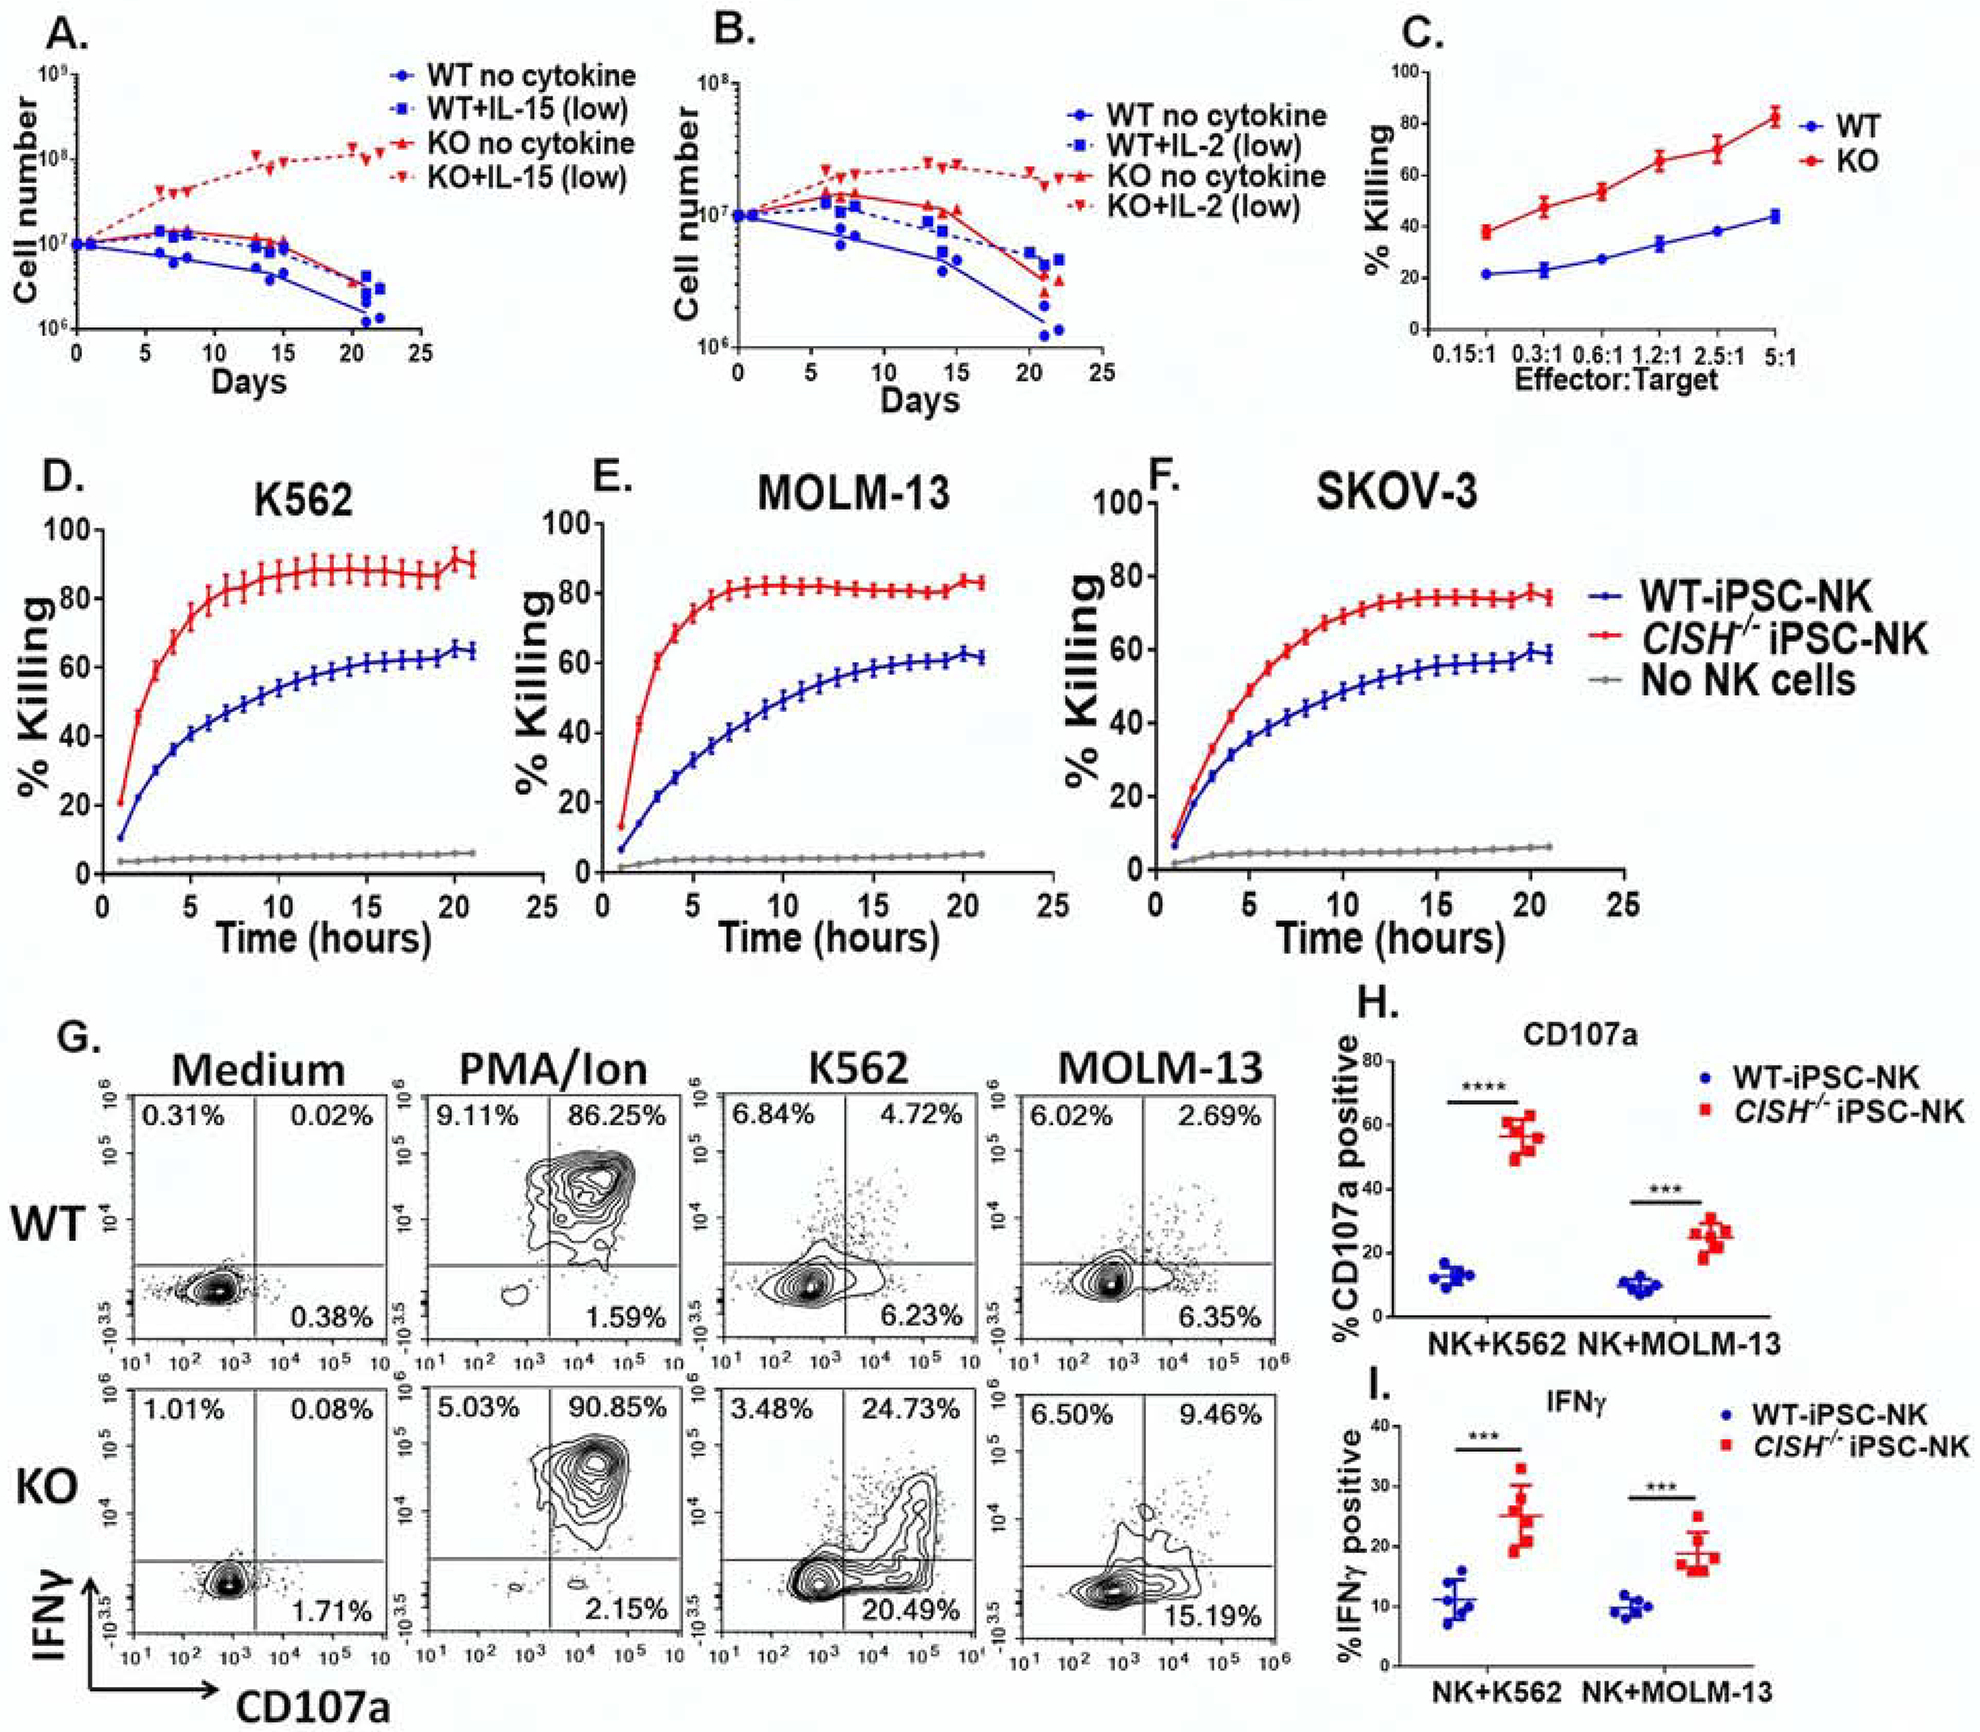
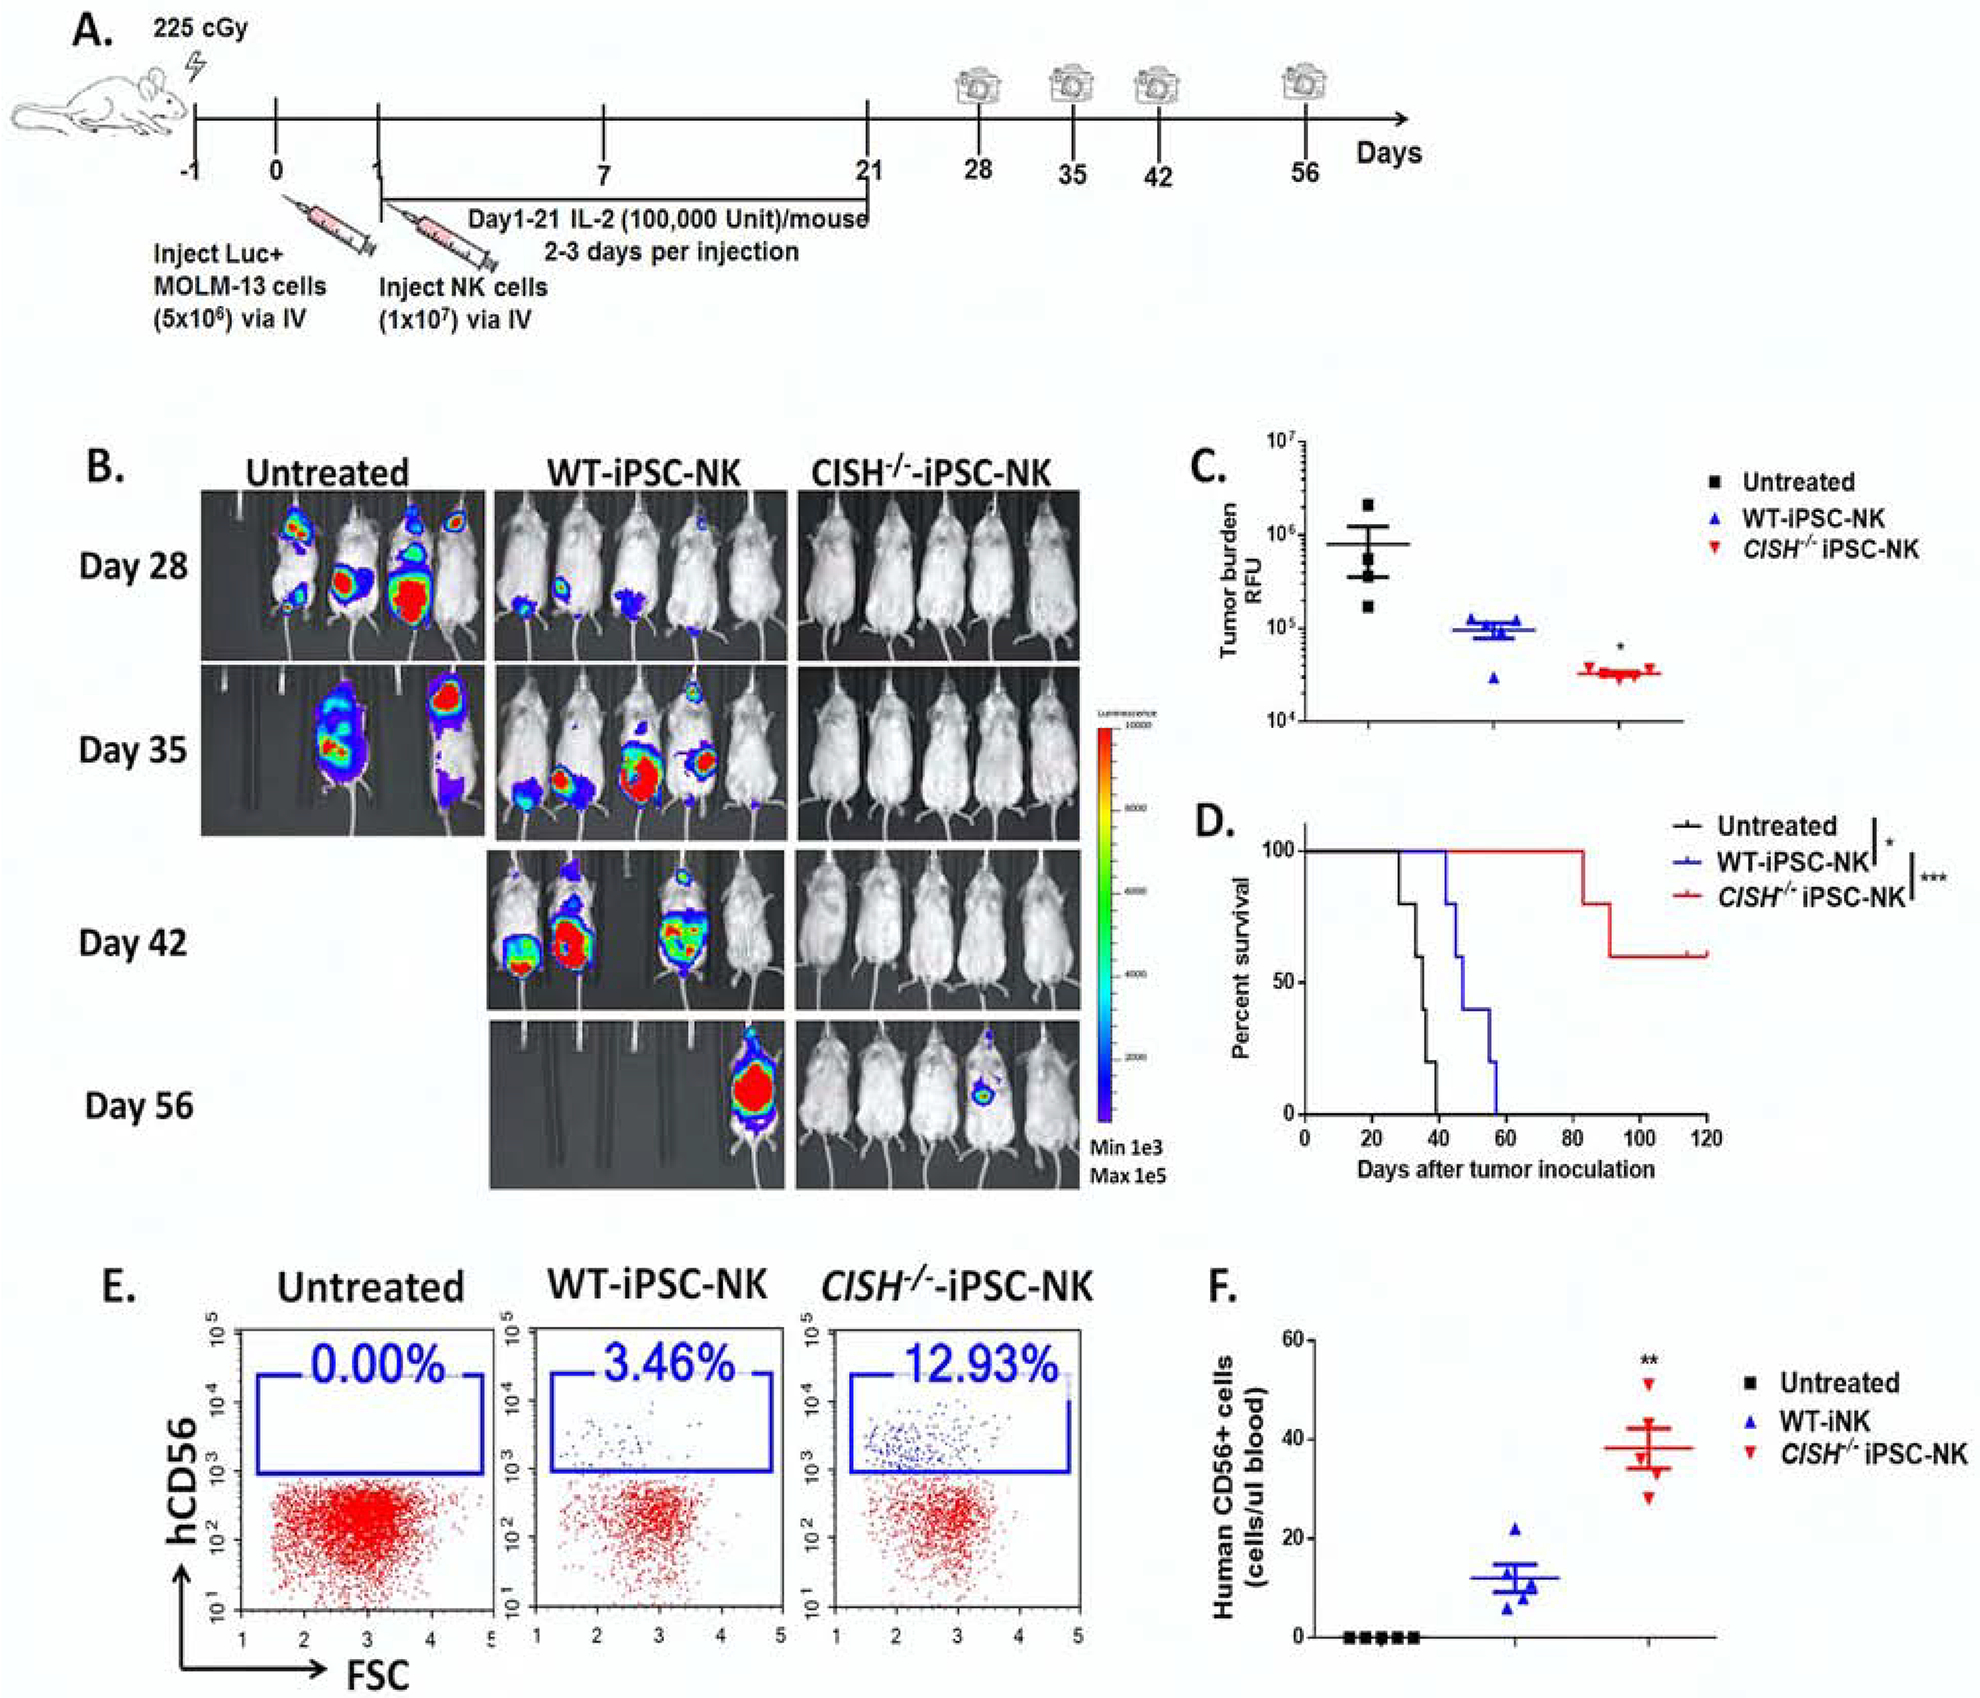
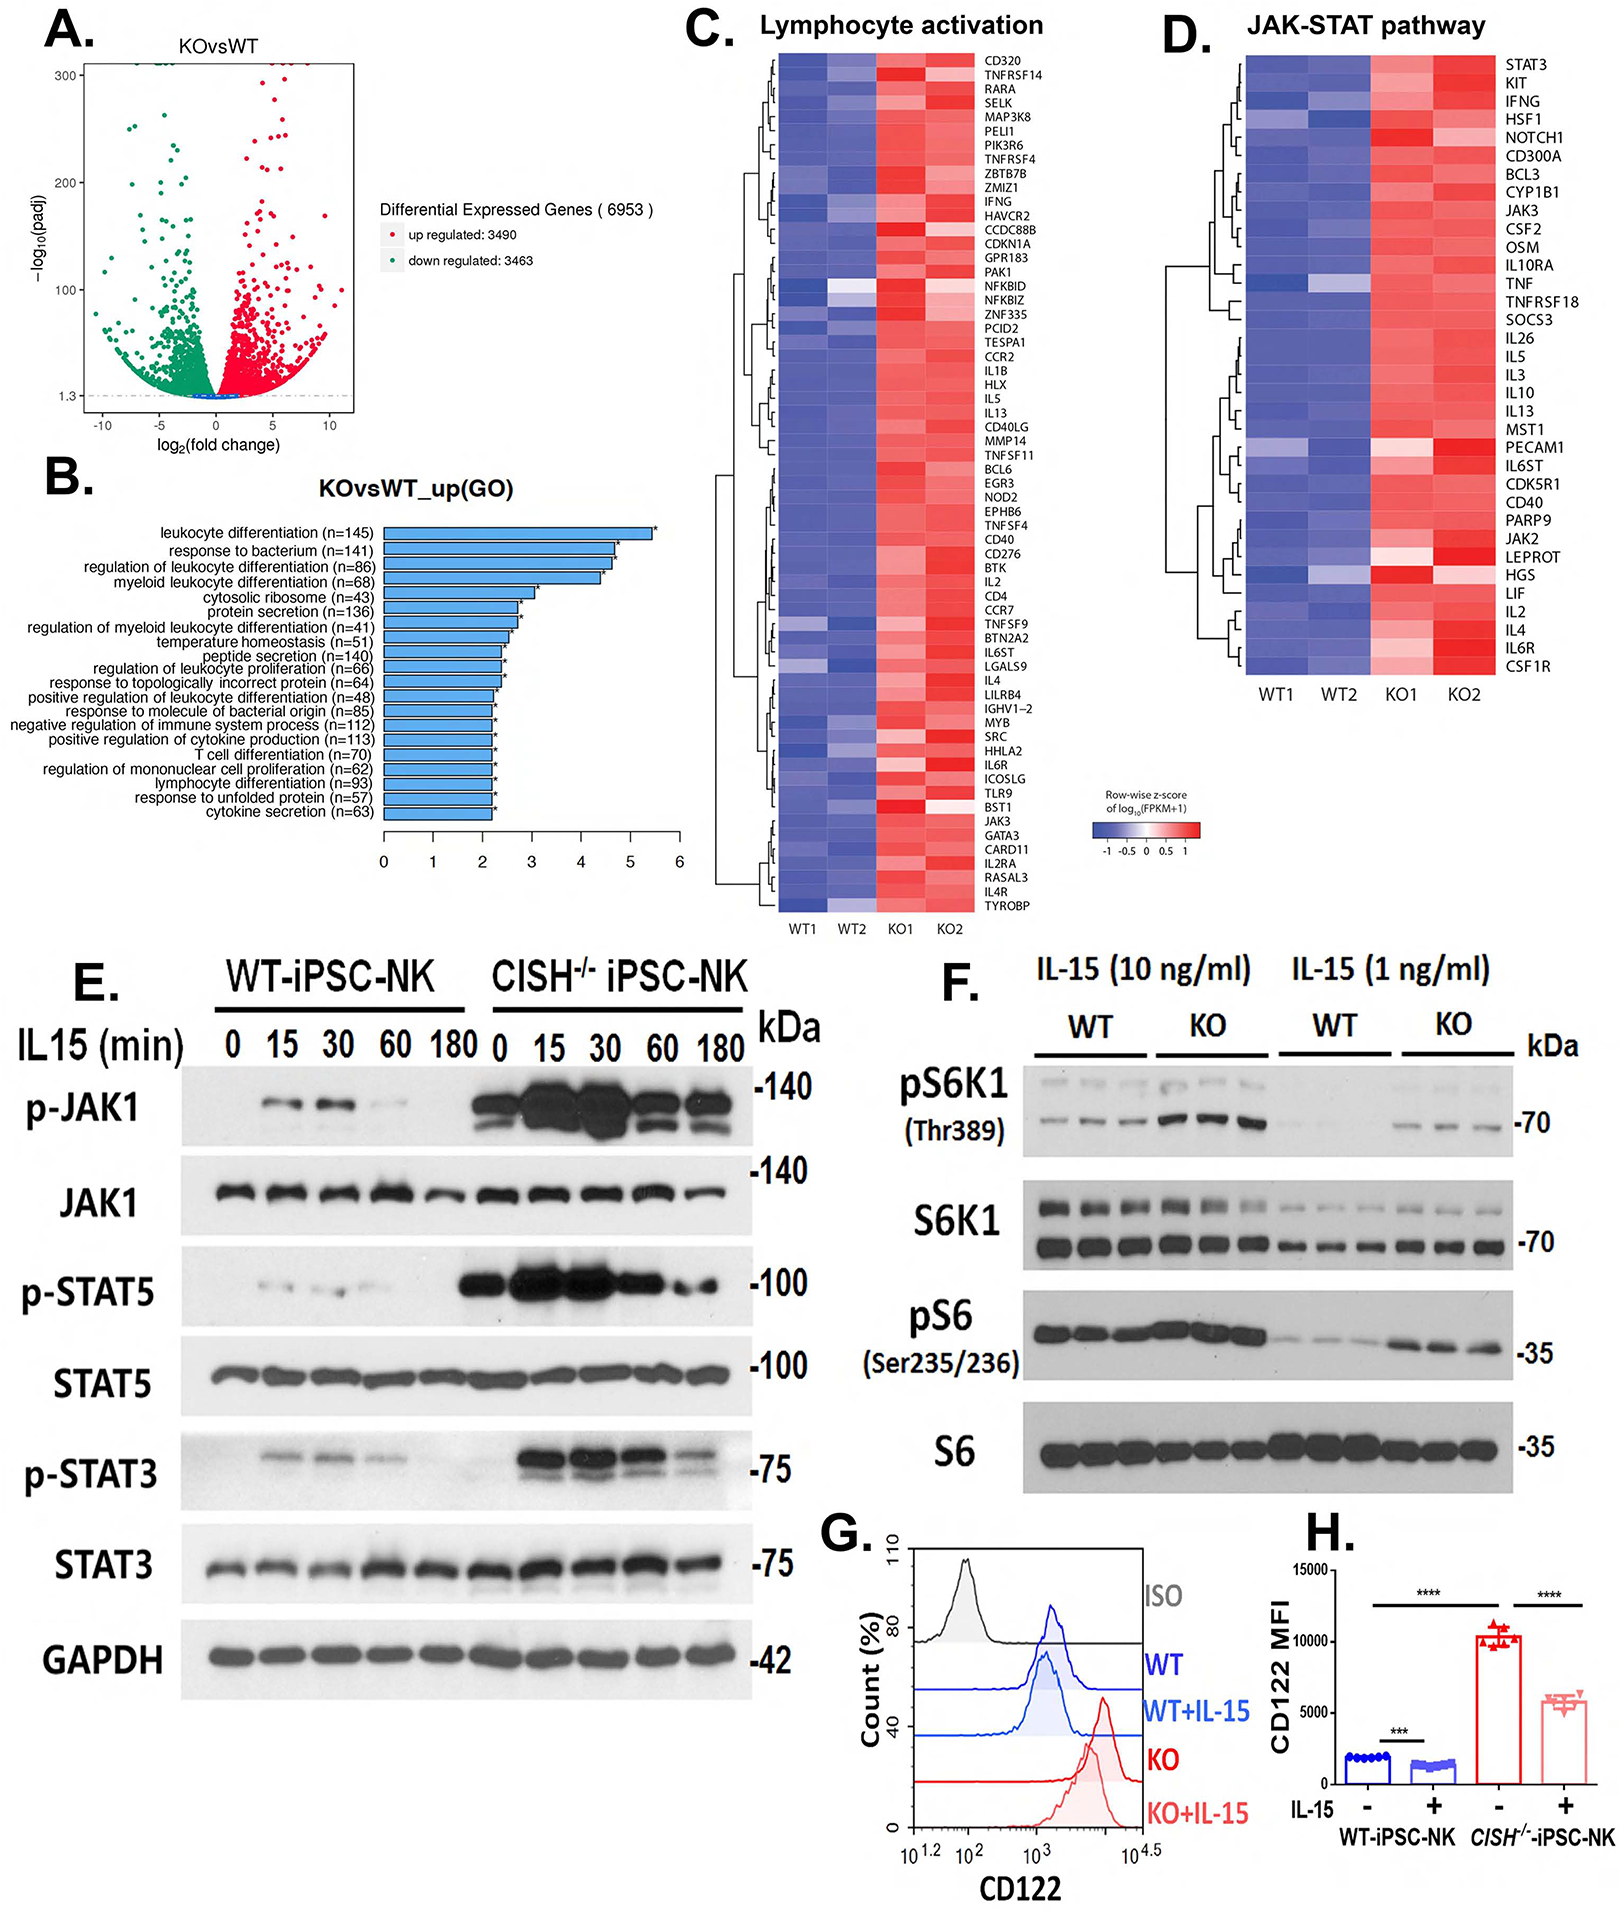
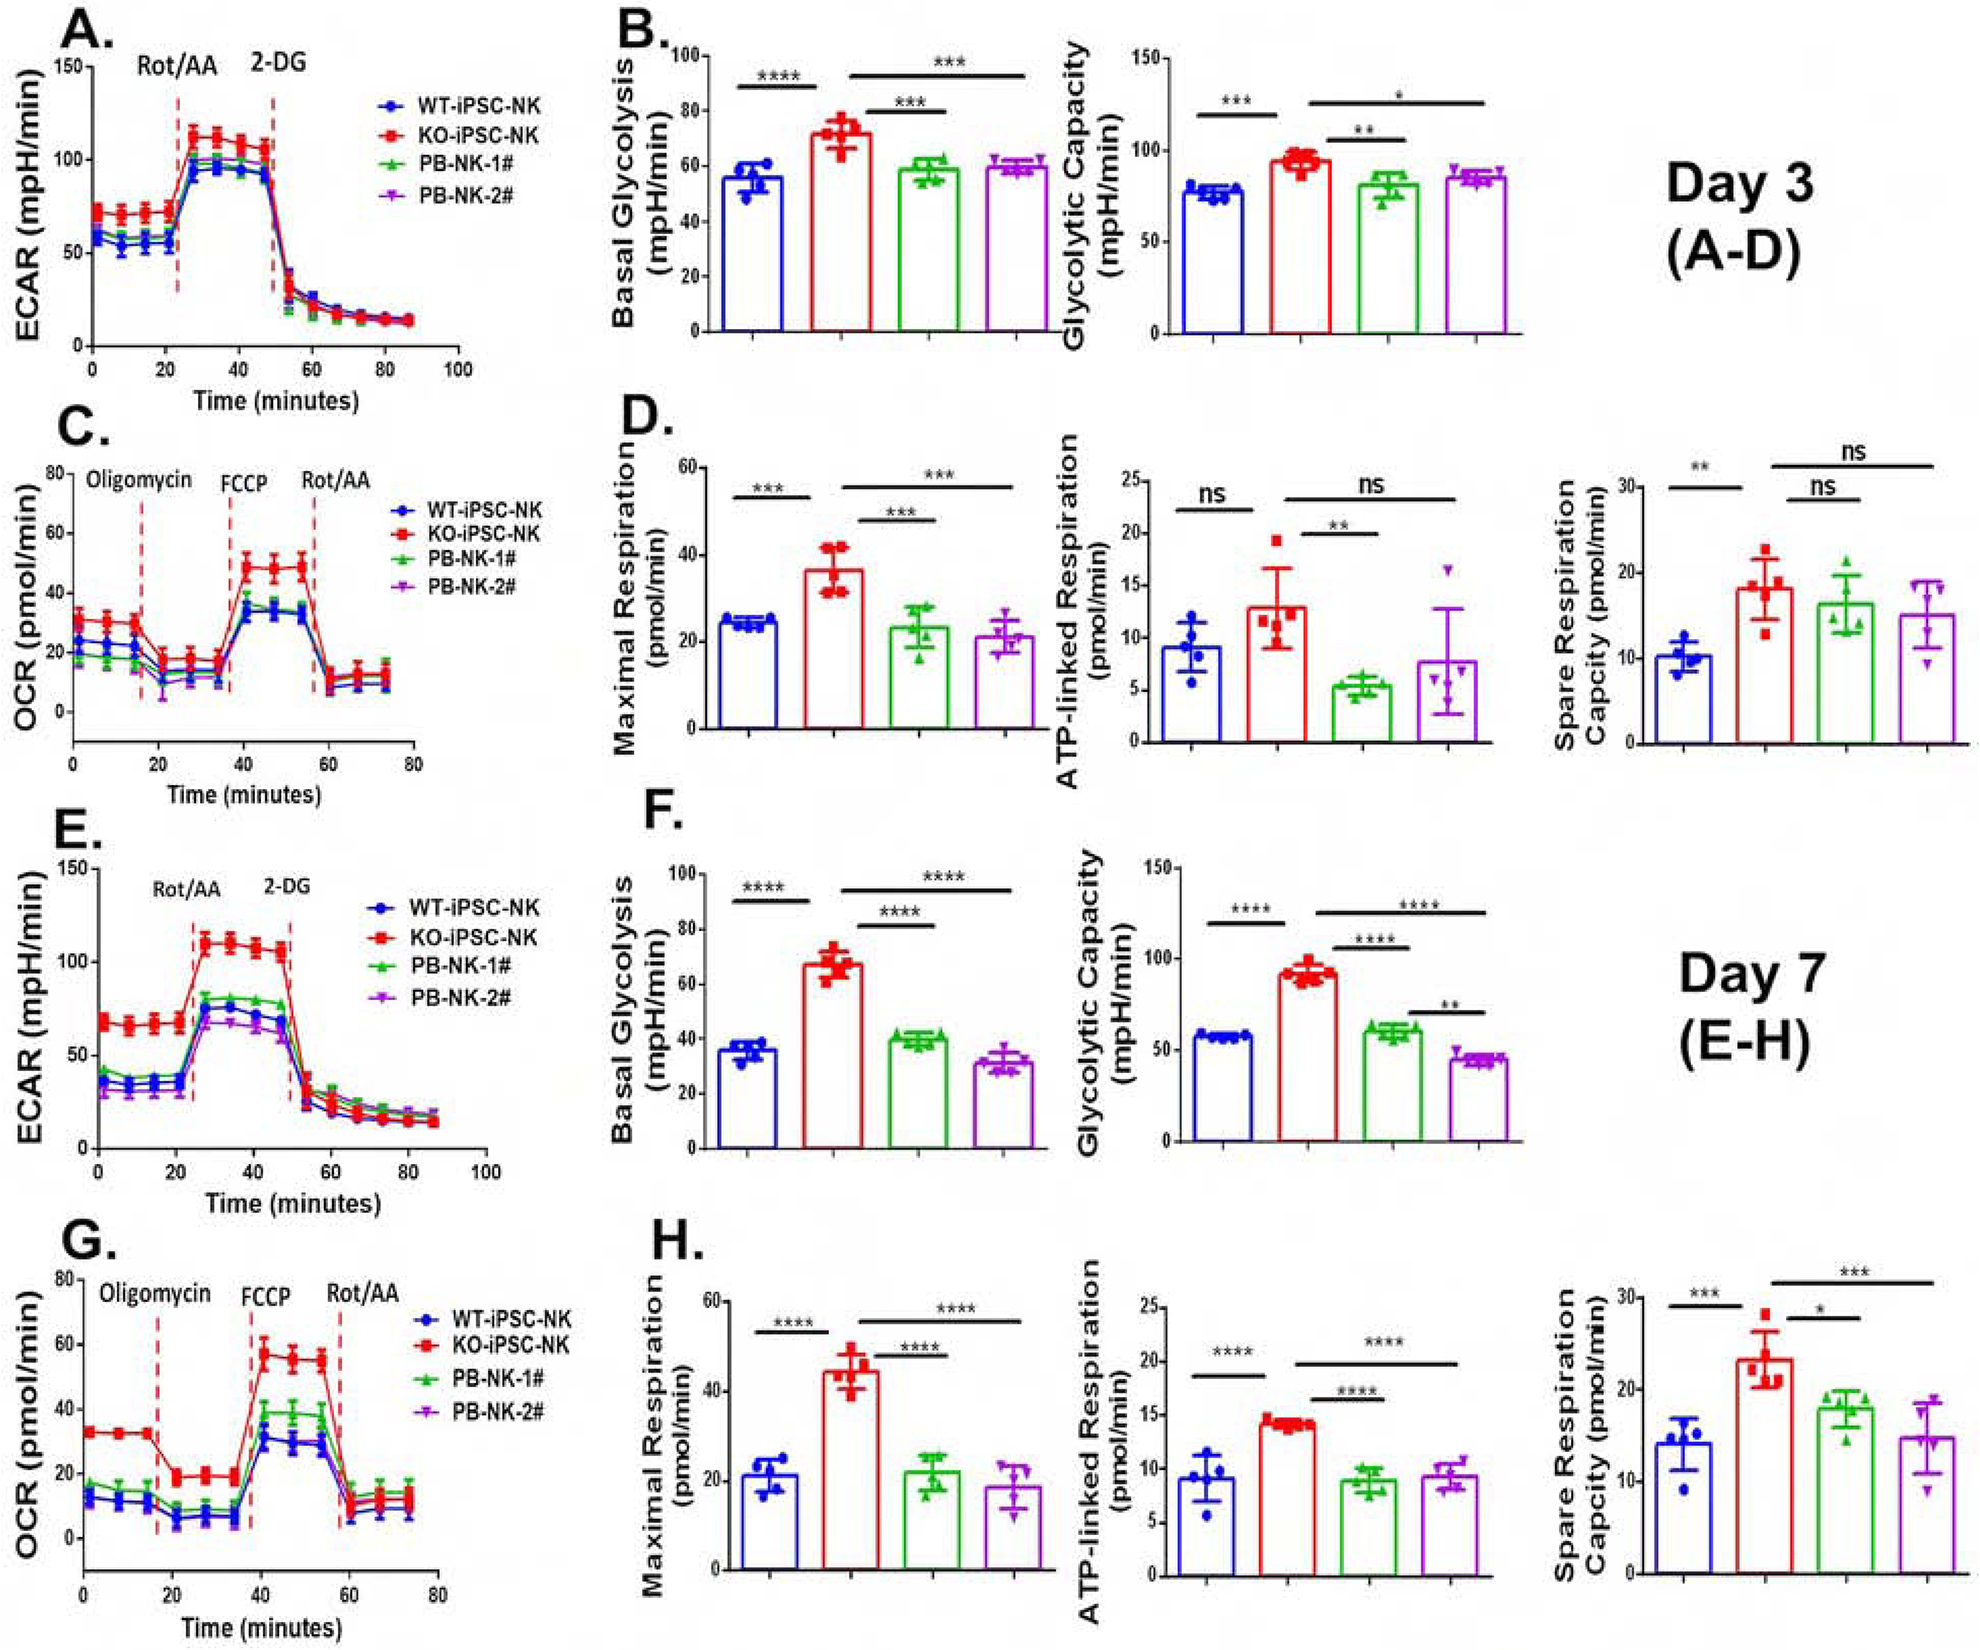
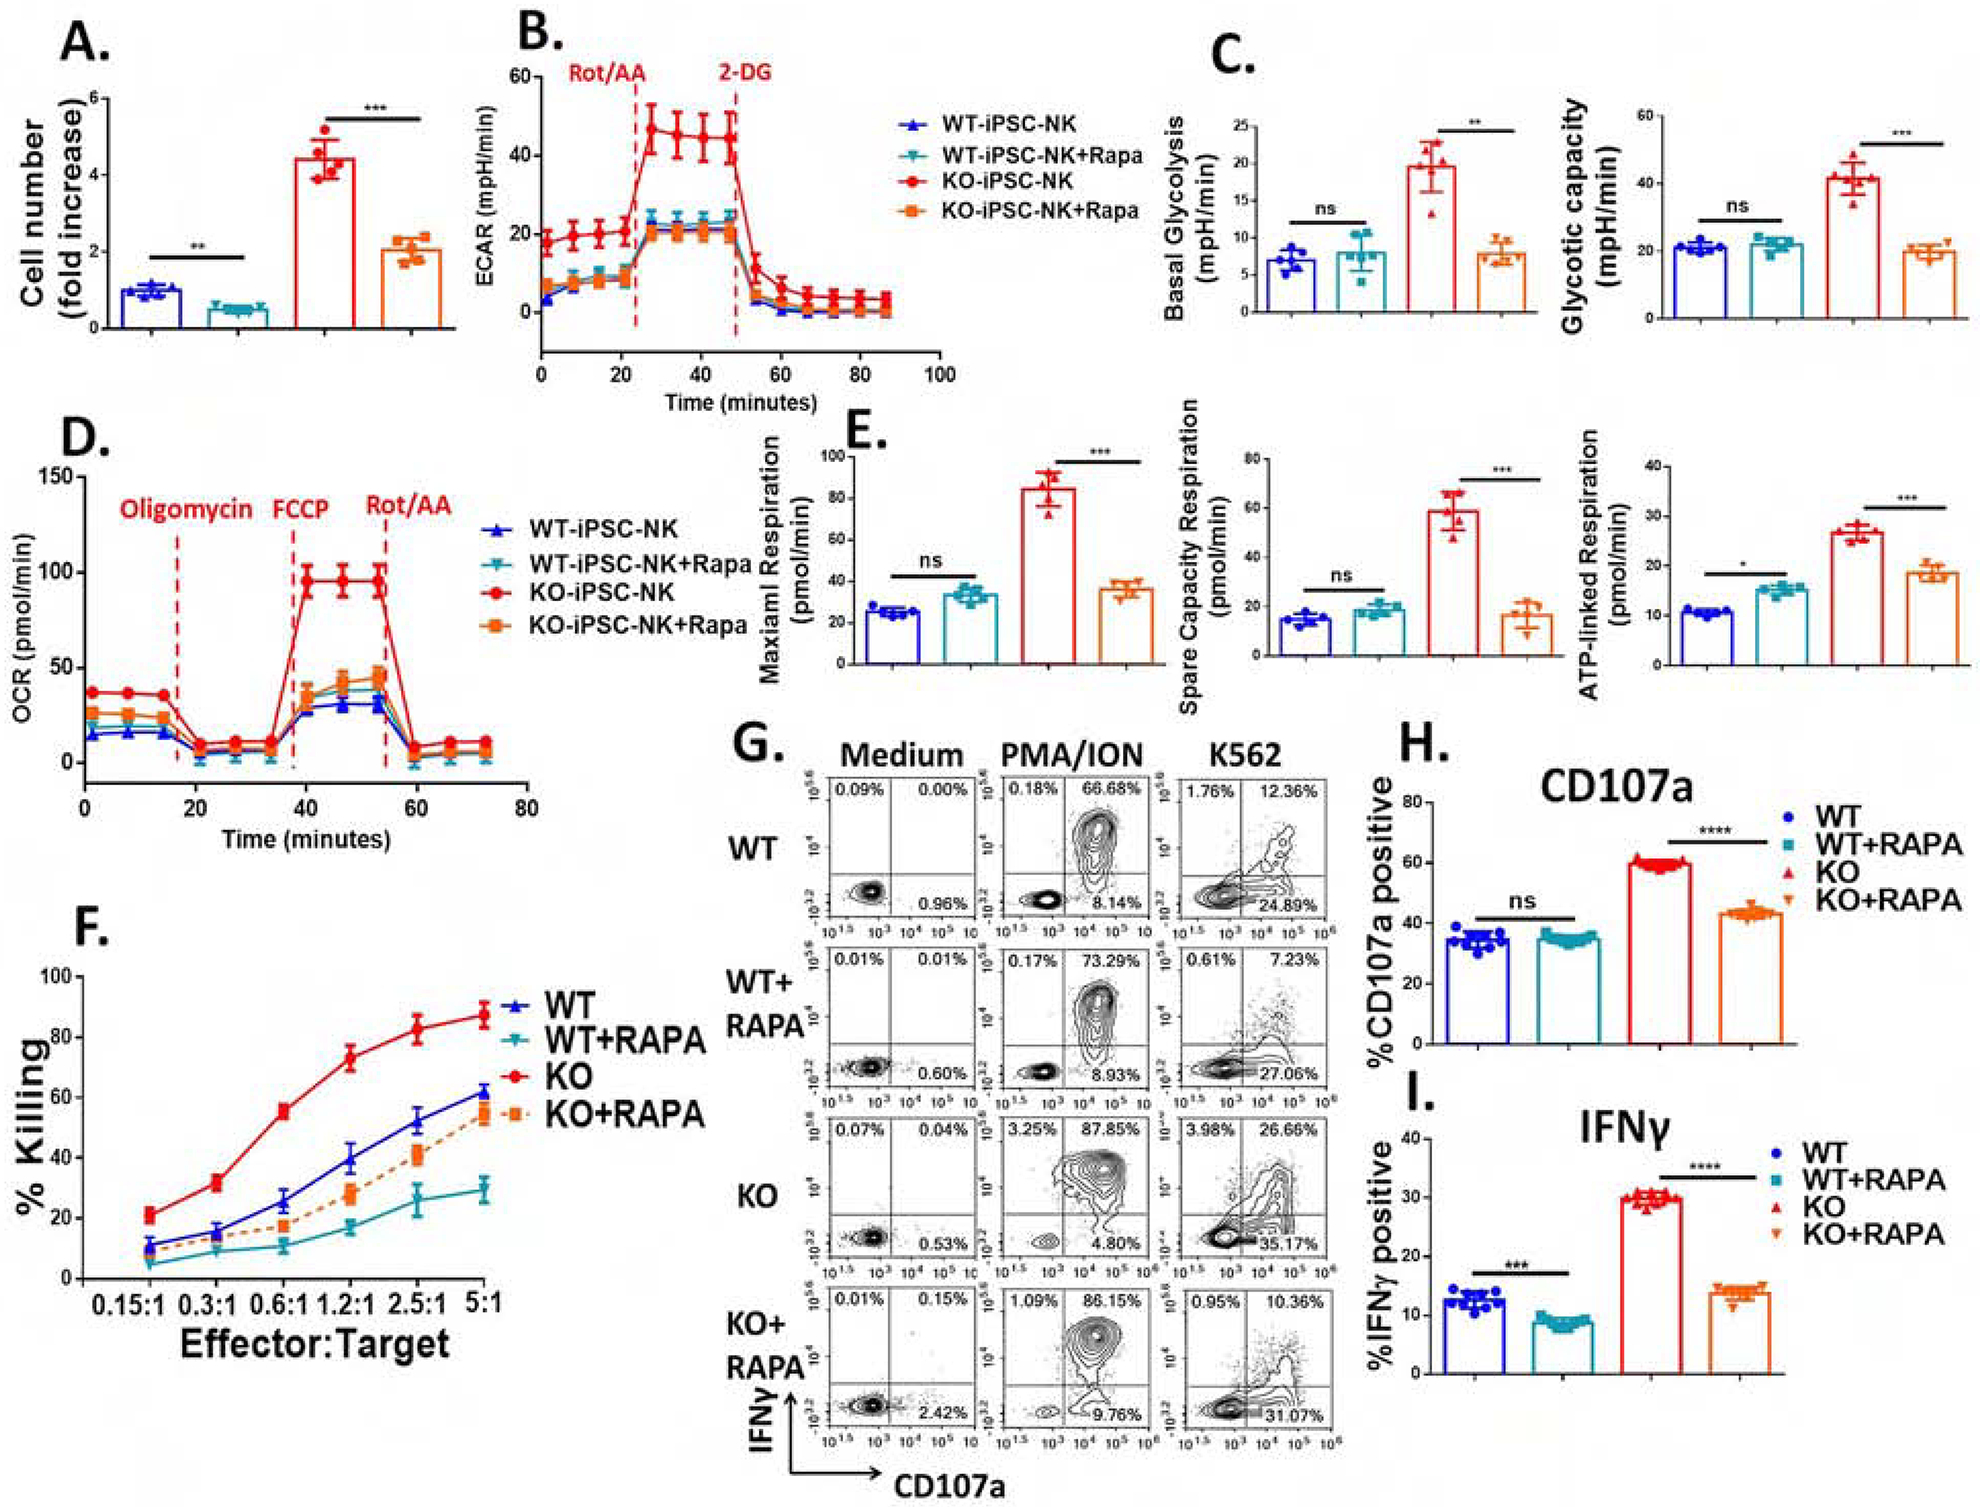
Cytokine-inducible SH2-containing protein (CIS; encoded by the gene CISH) is a key negative regulator of interleukin-15 (IL-15) signaling in natural killer (NK) cells. Here, we develop human CISH-knockout (CISH-/-) NK cells using an induced pluripotent stem cell-derived NK cell (iPSC-NK cell) platform. CISH-/- iPSC-NK cells demonstrate increased IL-15-mediated JAK-STAT signaling activity. Consequently, CISH-/- iPSC-NK cells exhibit improved expansion and increased cytotoxic activity against multiple tumor cell lines when maintained at low cytokine concentrations. CISH-/- iPSC-NK cells display significantly increased in vivo persistence and inhibition of tumor progression in a leukemia xenograft model. Mechanistically, CISH-/- iPSC-NK cells display improved metabolic fitness characterized by increased basal glycolysis, glycolytic capacity, maximal mitochondrial respiration, ATP-linked respiration, and spare respiration capacity mediated by mammalian target of rapamycin (mTOR) signaling that directly contributes to enhanced NK cell function. Together, these studies demonstrate that CIS plays a key role to regulate human NK cell metabolic activity and thereby modulate anti-tumor activity.

Keywords: CISH; IL-15; JAK-STAT; acute myelogenous leukemia; cell therapy; iPSCs; immunotherapy; mTOR; metabolic reprograming; natural killer cells.


Conflict of interest statement

Declaration of Interests D.S.K. is a consultant for Fate Therapeutics, has equity, and receives income. The terms of this arrangement have been reviewed and approved by the University of California, San Diego in accordance with its conflict of interest policies. He also has patents filed or issued related to this work. K.-J.M. consults for and receives research support from Fate Therapeutics. K.-L.G. is co-founder and has an equity interest in Vivace Therapeutics, Inc., and OncoImmune, Inc. H.Z. has a patent filed related to this work.

Figures

Figure 1.
Figure 1.. Generation of CISH-KO NK cells from human iPSCs.
A–B. To demonstrate normal CIS expression iPSC-NK and PB-NK cells were incubated without cytokines for 8hrs and then simulated with (A) 100 U/ml IL-2 or (B) 10ng/ml IL-15 for the indicated times, then CIS expression was analyzed by immunoblotting (IB). GAPDH was used as loading control. C. Scheme of CRISPR/Cas9-mediated CISH KO using two guide RNAs (gRNA) located in direct and complementary strand targeting exon 3 of the CISH gene. D. Schematic representation for deriving clonal CISH−/− iPSC-NK cells from human iPSC. CRISPR/Cas9 mediated CISH KO was performed in WT iPSC, followed by identification of CISH−/− iPSC at clonal level. After clonal expansion, CISH−/− iPSC were differentiated to CD34+ hematopoietic progenitor cells through hematopoiesis and then CISH−/− iPSC-NK cells through NK cell differentiation using the method previously reported. E. Comparison of sequence in CISH KO clone (obtained by Sanger sequencing) with CISH WT sequence (exon3, from 3067 to 3185) by Basic Local Alignment Search Tool (BLAST) showing frame shift mutations (red rectangle) in both alleles. All mutations occurred in 2 gRNA targeted region. F. WT-iPSC-NK cells and CISH−/− iPSC-NK cells were simulated with 10 ng/ml IL-15 for 8 hours and CIS expression evaluated by IB. Vinculin was used as loading control. Data at A, B and F were repeated in 3 separate experiments.
Figure 2.
Figure 2.. Deletion of CISH in human iPSCs do not affect hematopoiesis but delays NK cell differentiation in vitro
A. Analysis of hematopoietic progenitor cell markers (CD31, CD34, CD43 and CD45) in day 6 EBs generated from WT-iPSCs and CISH-KO iPSCs by flow cytometry. Data was repeated independently in 3 separate experiments. B. Quantification of the percentage of positive cells shown in A. C. Analysis of CD45+CD56+ NK cells during NK cell differentiation. Day 6 EBs generated from WT-iPSCs or CISH-KO iPSCs were incubated in NK differentiation media and analyzed by flow cytometry at 21, 28, and 35 day time points. D. Quantification of CD56+ cells shown derived at each time point. E. WT-iPSC-NK and CISH−/− iPSC-NK cells analyzed by flow cytometry for CD56 other indicated typical NK cell surface receptors. Data in A–E was repeated independently in 3 separate experiments. F. Mass cytometry analysis of WT-iPSC-NK and CISH−/− iPSC-NK cells. Individual t-SNE maps show the expression of selected NK cell surface and intracellular markers. Color indicates signal intensity, ranging from low (blue) to high (red). G. Heatmap of the marker expression showed in F. Color scale shows the expression level with yellow representing higher expression and black representing lower expression.
Figure 3.
Figure 3.. CISH−/− iPSC-NK cells have better expansion and functions in vitro compared with WT iPSC-NK cells
A&B Growth curve of CISH−/− iPSC-NK cells and WT iPSC-NK cells with or without a low concentration of IL-15 (A. 1ng/ml) and IL-2 (B. 10 U/ml). Data was repeated independently in 3 separate experiments. C. 4 hour cytotoxicity assay using CISH−/− iPSC-NK and WT iPSC-NK cells against K562 cells after 3 weeks of culture in low concentration IL-15 as determined using CellEvent™ Caspase-3/7 Green Flow Cytometry Assay. D–F. Killing against K562 (D), MOLM-13 (E) and SKOV-3 (F) cells was quantified over an extended time course using the IncuCyte real-time imaging system at E:T=1:1. G. CISH−/− iPSC-NK cells and WT iPSC-NK cells were maintained at low IL-15 for 3 weeks and production of CD107α and IFNγ in response to K562 and MOLM-13 cells was measured. CISH−/− iPSC-NK cells and WT iPSC-NK cells were left unstimulated or stimulated with a 1:1 ratio of target cells and stained for CD107a and IFNγ 4 hours later. Quantification of CD107a (H, n=6) and IFNγ (I, n=6) after stimulation with K562 or MOLM-13 cells. Paired t test was used to do the comparisons. ***P < 0.001, ****P < 0.0001. Data at C–F, H and I were shown as mean ± SD. Data at C-I were repeated in 3 separate experiments.
Figure 4.
Figure 4.. CISH−/− iPSC-NK cells demonstrate improved persistence and better anti-tumor activity in vivo.
A. Diagram of in vivo treatment scheme. NSG mice were inoculated iv with 5×10⁶ MOLM-13 cells expressing the firefly luciferase gene. 1 day after tumor injection, mice were either left untreated or treated with 1×10⁷ WT-iPSC-NK or CISH−/− iPSC-NK cells. NK cells were supported by weekly injections of IL-2 for 3 weeks, and IVIS imaging was done to track tumor load. B. IVIS images showing progression of tumor burden. C. Tumor burden at day 28 was quantified and shown as mean ± SD. Statistics by one way ANOVA test; *p<0.05. D. Kaplan-Meier curve demonstrating survival of the experimental groups. Statistics: two-tailed Log-rank test, WT-iPSC-NK vs untreated, *p<0.05; WT-iPSC-NK vs CISH−/− iPSC-NK, ***p<0.001. E. Representative flow cytometric plot of human CD56+ cells in population from mice peripheral blood 7 days after NK cell treatment. F. Quantification of human CD56+ cells in peripheral blood (number of hCD56+ cells/ul blood) at Day 7, shown as mean ± SD. Statistics by one way ANOVA test; **p<0.01.
Figure 5.
Figure 5.. CISH−/− iPSC NK cells show increased IL-15 signal activation
A–D. Differential expression gene between WT iPSC-NK and CISH−/− iPSC-NK cells was analyzed by RNA sequencing. A. Volcano diagram of differential expression genes. The threshold of differential expression genes is: padj < 0.05. B. Gene ontology (GO) enrichment analysis. Top 20 significantly enriched cellular compares, molecular function and biological process in CISH−/− iPSC-NK cells were shown. C. Heatmap view of expression of 61 genes involved in regulating lymphocyte activations in WT iPSC-NK and CISH−/− iPSC-NK cells. D. Heatmap view of the JAK-STAT pathway gene expression in WT iPSC-NK and CISH−/− iPSC-NK cells. E. Immunoblot analysis of WT iPSC-NK and CISH−/− iPSC-NK cells incubated without cytokines for 24 hrs and then simulated with 1 ng/ml IL-15 for the indicated times. F. Immunoblot analysis of mTOR downstream activation (pS6 and pS6K1) in WT iPSC-NK and CISH−/− iPSC-NK cells cultured in media with 10 ng/ml or 1 ng/ml IL-15 for 24 hrs. G. Representative flow cytometry plot of IL-2Rβ (CD122) surface expression on WT iPSC-NK, CISH−/− iPSC-NK cells cultured in media with or without IL-15 (1ng/ml) for 24 hrs. H. Quantification of CD122 expression (n=6). MFI: mean fluorescence intensity. Statistics: One way ANOVA, ***P=0.0002, ****P<0.0001. Data at E, G and H were repeated in 3 separate experiments and data at F were repeated in 2 separate experiments.
Figure 6.
Figure 6.. Deletion of CISH in human iPSC-NK cells improve metabolic fitness.
WT-iPSC-NK cells, CISH−/− iPSC-NK-cells and PB-NK cells from 2 donors (PB-NK-1# and PB-NK-2#) were incubated with a low concentration of IL-15 (1ng/ml) for 3 days (A–D) or 7 days (E–H). A. The extracellular acidification rate, (ECAR) was measured in real time in an XFe96 analyzer after injection of rotenone/antimycin A (Rot/AA) and 2-deoxy-D-glucose (2DG). B. Graphical analysis of Basal Glycolysis (left) and Glycolytic Capacity (right) derived from A (n=6). C. The oxygen consumption rate (OCR) was measured after injection of oligomycin, Carbonyl cyanide-4-(trifluoromethoxy)phenylhydrazone (FCCP), and Rot/AA. D. Graphical analysis of Maximal Respiration (left), ATP-linked Respiration (middle) and Spare Capacity Respiration (SRC, right) derived from C (n=6). E. ECAR was measured. F. Graphical analysis of Basal Glycolysis (left) and Glycolytic Capacity (right) derived from E (n=6). G. OCR was measured. D. Graphical analysis of Maximal Respiration (left), ATP-linked Respiration (middle) and SRC (right) derived from G (n=6) Data were shown as mean ± SD and were repeated in 3 separate experiments. One way ANOVA was used to do all comparisons. **p<0.01, ***p<0.001, ****p<0.0001. ns: p>0.05.
Figure 7.
Figure 7.. Improved metabolic fitness in CISH−/− iPSC-NK cells is mediated by mTOR signaling pathway and contributes to improved function
WT-iPSC-NK cells and CISH−/−-iPSC-NK-cells were incubated at low IL-15 (1 ng/ml) with or without Rapamycin (100 ng/ml) for 7 days. A. Quantification of Rapamycin’s effects upon NK cell proliferation. B. Rapamycin decreases the ECAR of CISH−/−-iPSC-NK-cells to a level similar to that observed in WT-iPSC-NK cells regardless of rapamycin’s addition. ECAR was measured in real time in an XFe96 analyzer after injection of Rot/AA and 2-DG. C. Graphical analysis of Basal Glycolysis (left) and Glycolytic capacity (right) derived from B (n=6). D. OCR was measured after injection of oligomycin, FCCP and Rot/AA. E. Graphical analysis of Maximal Respiration (left), Spare Capacity Respiration (middle) and ATP-linked Respiration (right) derived from D (n=6). F. After 7 days incubation with or without Rapamycin, killing against K562 cells was evaluated using CellEvent™ Caspase-3/7 Green Flow Cytometry Assay. G. CISH−/− iPSC-NK cells and WT iPSC-NK cells produce CD107a and IFNγ in response to K562 with or without rapamycin for 7 days (low dose IL-15, 1 ng/ml). CISH−/− iPSC-NK cells and WT iPSC-NK cells were left unstimulated or stimulated with a 1:1 ratio of target cells and stained for CD107a and IFNγ 4 hours later. Quantification of CD107a (H, n=6) and IFNγ (I, n=6) after stimulation with K562 or MOLM-13 cells. Data were shown as mean ± SD and were repeated in 3 separate experiments. Paired t test was used to do all comparisons. *P<0.05, **P<0.01, ***P < 0.001, ****P < 0.0001.

References

    1. Assmann N, O’Brien KL, Donnelly RP, Dyck L, Zaiatz-Bittencourt V, Loftus RM, Heinrich P, Oefner PJ, Lynch L, Gardiner CM, et al. (2017). Srebp-controlled glucose metabolism is essential for NK cell functional responses. Nat Immunol 18, 1197–1206. - PubMed
    1. Bremm M, Pfeffermann LM, Cappel C, Katzki V, Erben S, Betz S, Quaiser A, Merker M, Bonig H, Schmidt M, et al. (2019). Improving Clinical Manufacturing of IL-15 Activated Cytokine-Induced Killer (CIK) Cells. Front Immunol 10, 1218. - PMC - PubMed
    1. Cichocki F, Wu CY, Zhang B, Felices M, Tesi B, Tuininga K, Dougherty P, Taras E, Hinderlie P, Blazar BR, et al. (2018). ARID5B regulates metabolic programming in human adaptive NK cells. J Exp Med 215, 2379–2395. - PMC - PubMed
    1. Cong JJ, Wang XW, Zheng XH, Wang D, Fu BQ, Sun R, Tian ZG, and Wei HM (2018). Dysfunction of Natural Killer Cells by FBP1-Induced Inhibition of Glycolysis during Lung Cancer Progression. Cell Metab 28, 243–255.e245. - PubMed
    1. Delconte RB, Kolesnik TB, Dagley LF, Rautela J, Shi W, Putz EM, Stannard K, Zhang JG, Teh C, Firth M, et al. (2016). CIS is a potent checkpoint in NK cell-mediated tumor immunity. Nat Immunol 17, 816–824. - PubMed

Publication types

LinkOut - more resources