. 2020 Jul 13;38(1):79-96.e11.
doi: 10.1016/j.ccell.2020.04.017. Epub 2020 Jun 11.

Targeting FTO Suppresses Cancer Stem Cell Maintenance and Immune Evasion

Affiliations

Targeting FTO Suppresses Cancer Stem Cell Maintenance and Immune Evasion

Rui Su et al. Cancer Cell. .

Abstract

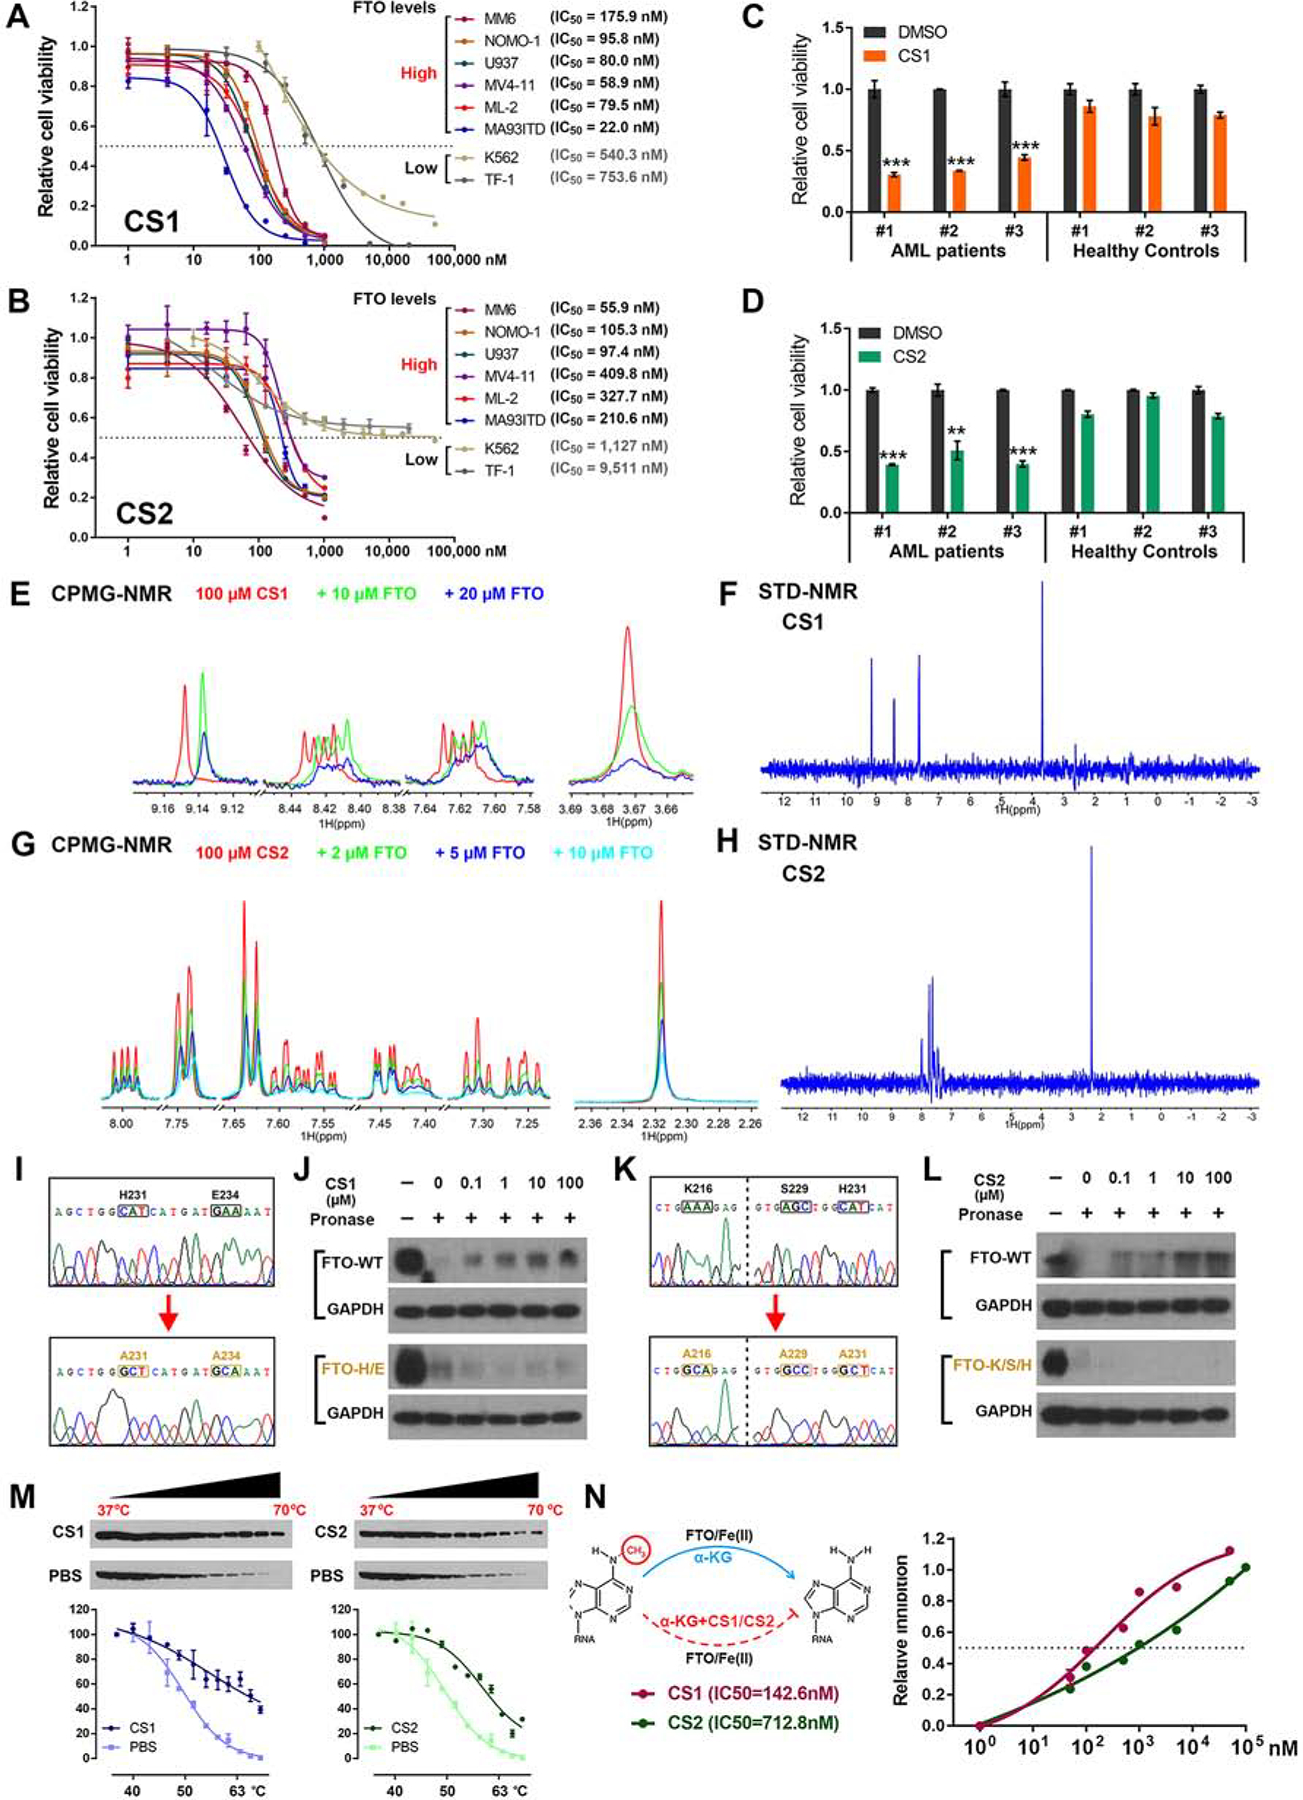
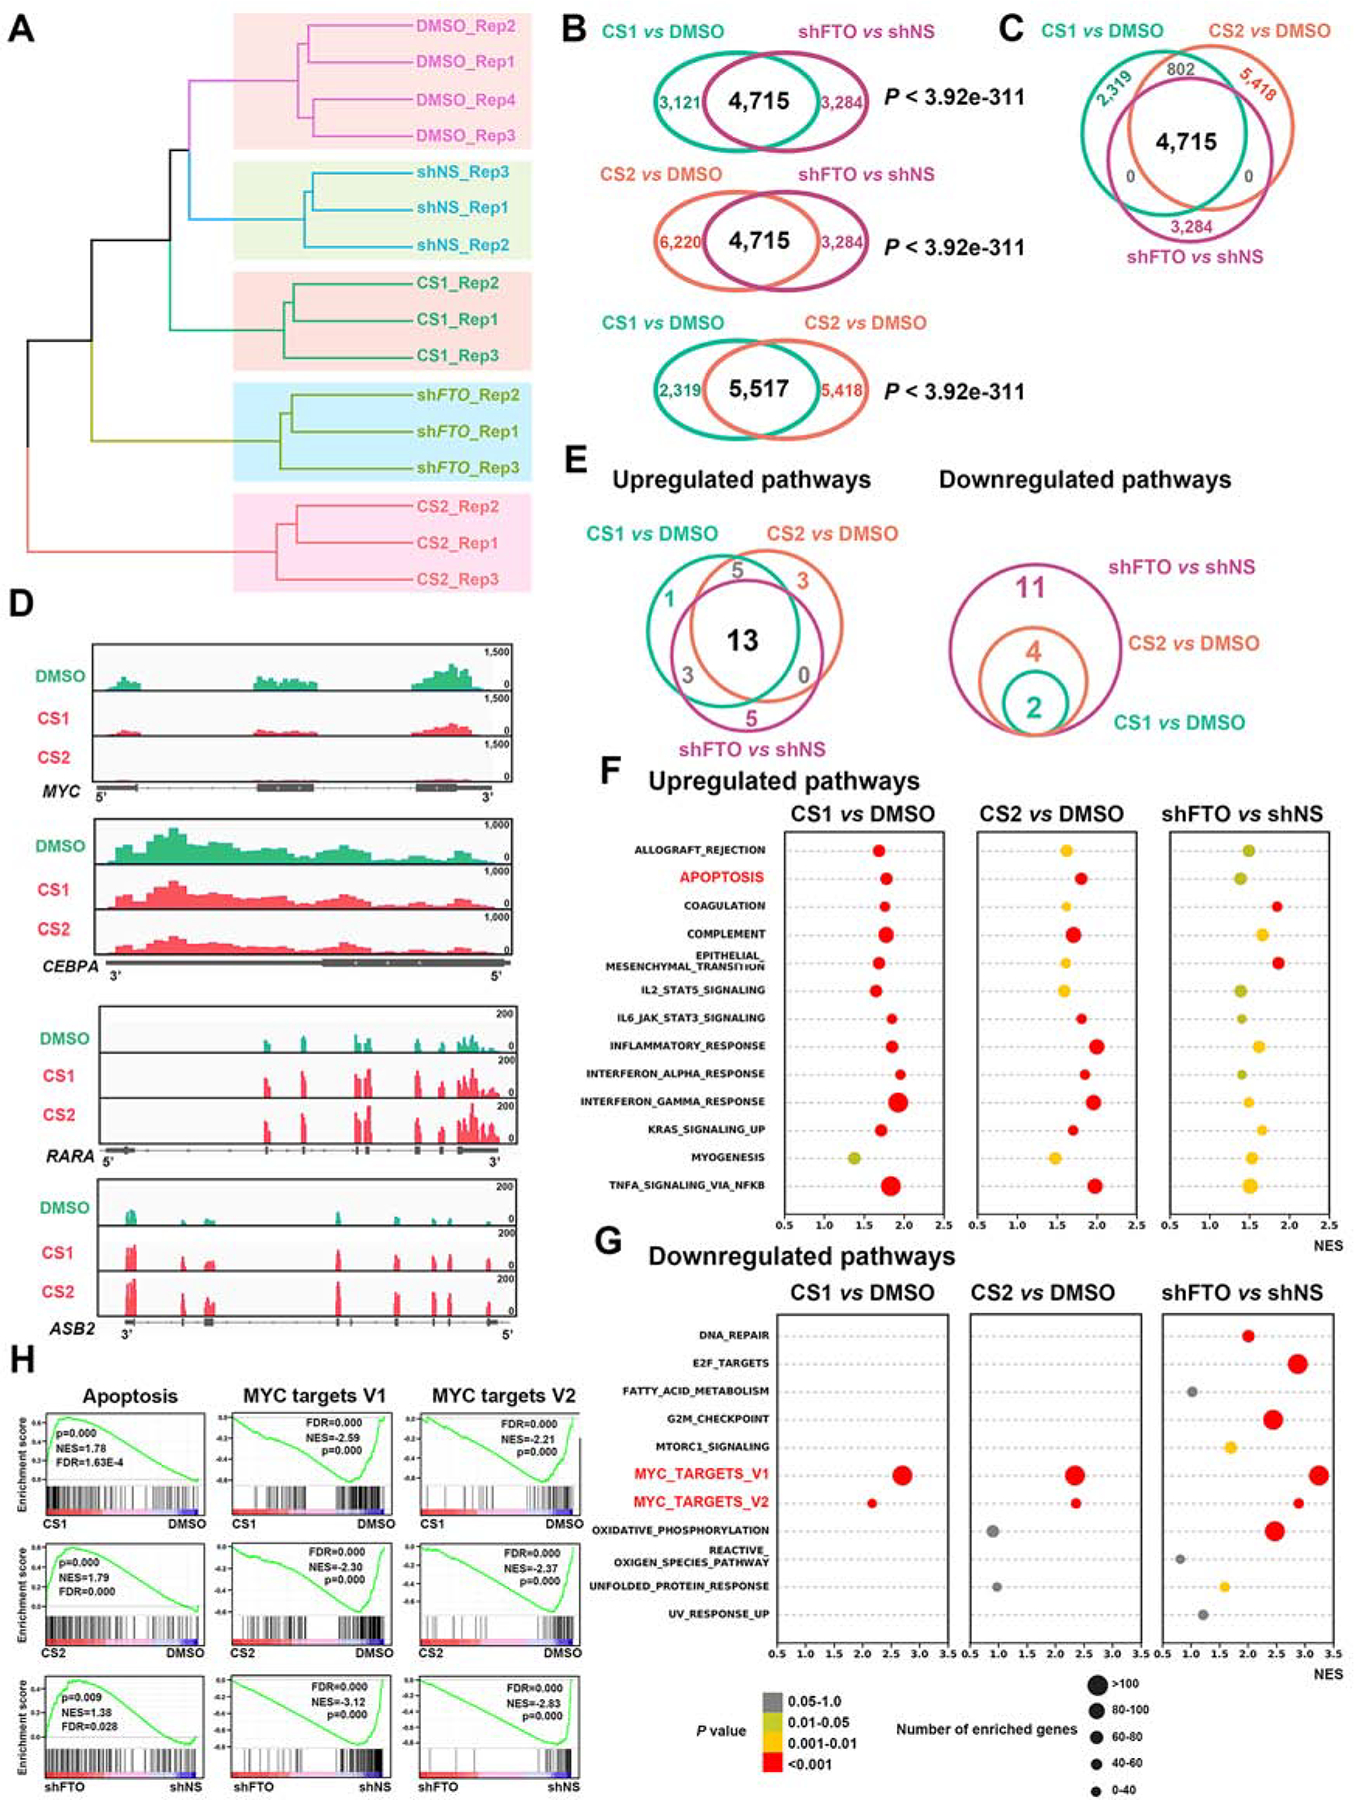
Fat mass and obesity-associated protein (FTO), an RNA N6-methyladenosine (m6A) demethylase, plays oncogenic roles in various cancers, presenting an opportunity for the development of effective targeted therapeutics. Here, we report two potent small-molecule FTO inhibitors that exhibit strong anti-tumor effects in multiple types of cancers. We show that genetic depletion and pharmacological inhibition of FTO dramatically attenuate leukemia stem/initiating cell self-renewal and reprogram immune response by suppressing expression of immune checkpoint genes, especially LILRB4. FTO inhibition sensitizes leukemia cells to T cell cytotoxicity and overcomes hypomethylating agent-induced immune evasion. Our study demonstrates that FTO plays critical roles in cancer stem cell self-renewal and immune evasion and highlights the broad potential of targeting FTO for cancer therapy.

Keywords: FTO; LILRB4; LSC/LIC self-renewal; N(6)-methyladenosine (m(6)A) modification; immune checkpoint genes; immune evasion; inhibitors; leukemia; solid tumors; therapeutics.


Conflict of interest statement

Declaration of Interests A provisional patent was filed, with J.C., R. Su, D.H., X.D., H.L., and J.X. as inventors. J.C. is the scientific founder of Genovel Biotech Corp. and holds equities with the company. A.T.F. has done consultancy work for Celgene, Agios, Astellas, Daiichi Sankyo, and Abbvie, and Celgene and Agios are providing funding for two ongoing clinical trials that A.T.F. is running as investigator-initiated studies.

Figures

Figure 1.
Figure 1.. Identification of FTO inhibitors through structure-based virtual screening and validation assays
(A) Pyramid flowchart of the pipeline to identify FTO inhibitors from the NCI Developmental Therapeutics Program (DTP) library. (B) Docking models were developed based on FTO crystal structure and the 260,000 compounds from the NCI DTP library. (C) Docking pose of the top 370 hits within the catalytic center of FTO protein. (D) The effects of top 20 compounds on cell viability in MONOMAC 6. (E) The effects of top 20 compounds on the enzymatic activity of FTO. (F) The two-dimensional (2D) structure (upper panel) and three-dimensional (3D) conformer (lower panel) of CS1 and CS2. (G) The binding model of CS1 in FTO catalytic pocket. (H) The CS1/FTO and CS2/FTO binding models. (I and J) The 2D ligand interaction diagrams for CS1/FTO (I) and CS2/FTO (J). Data are represented as mean ± SEM from 3 independent experiments. ***, p < 0.001. See also Figure S1.
Figure 2.
Figure 2.. The anti-leukemic efficacy of CS1 and CS2 is FTO dependent.
(A and B) IC50 values of CS1 (A) and CS2 (B) on inhibiting cell viability in AML cell lines. The cells were treated for 72 h. (C and D) The effects of CS1 (100 nM, 48 h; C) and CS2 (200 nM, 48 h; D) on cell viability in CD34+ cells of AML patients and healthy donors. (E) The CPMG spectra for CS1 (red), CS1 in the presence of 10 μM FTO (green), and 20 μM FTO (blue). (F) The STD spectrum for CS1 in the presence of 5 μM FTO protein. (G) The CPMG spectra for CS2 (red), CS1 in the presence of 2 μM FTO (green), 5 μM FTO (blue), and 10 μM FTO (cayn). (H) The STD spectrum for CS2 in the presence of 5 μM FTO protein. (I) Confirming FTOH231A/E234A mutation via Sanger sequencing. (J) Western blot analysis of FTO WT (upper panel) and FTOH231A/E234A (lower panel) from DARTS with CS1 in MONOMAC 6 cells. (K) Confirming FTOK216A/S229A/H231A mutation via Sanger sequencing. (L) Western blot analysis of FTO WT (upper panel) and FTOK216A/S229A/H231A (lower panel) from DARTS with CS2 in MONOMAC 6 cells. (M) Western blot analysis (upper panel) and thermal shift curves (lower panel) of FTO from CETSA in MONOMAC 6 pretreated with 200 nM CS1 or CS2. (N) Inhibitory effects of CS1 and CS2 on FTO demethylase activity via in vitro (cell-free) m6A demethylation assays. Data are represented as mean ± SEM from 3 independent experiments. **, p < 0.01; ***, p < 0.001. See also Figure S2 and Table S1.
Figure 3.
Figure 3.. Effects of CS1 and CS2 on apoptosis, cell cycle, and LSCs/LICs frequency in AMLs (A and B) Effect of CS1 (A) and CS2 (B) treatment on early apoptosis (left panel) and late apoptosis (right panel) in NOMO-1 AML cells upon 48 h treatment.
(C and D) Effects of CS1 and CS2 treatment on cell cycle distribution in NOMO-1 cells as detected by PI staining (C) and Hoechst 33342/Pyronin Y staining (D). (E) FTO abundance in the bone marrow-derived mononuclear cells (BMMNCs) of AML patients and healthy donors. (F) FTO abundance in the CD34+ and CD34 cells of BMMNCs from AML patients. (G) FTO levels in CD34+ cells vs. CD34 cells of individual BMMNC samples. (H) The LSC/LIC frequency changes in MA9 primary murine AML cells upon Fto KD as estimated by in vitro limiting dilution assays (LDAs). (I and J) The LSC/LIC frequency changes in MA9 (I) and FLT3ITD/NPM1mut (J) primary murine AML cells upon CS1 (20 nM) treatment. (K) Diagram for the in vivo LDAs. (L) LSC/LIC frequency changes in the MA9 AML mouse models upon CS1 or CS2 treatment. Data are represented as mean ± SEM, n = 3. *, p < 0.05; **, p < 0.01; ***, p < 0.001. See also Figure S3 and Table S1.
Figure 4.
Figure 4.. Identify signal pathways affected by FTO inhibition and KD via RNA-seq
(A) Hierarchical clustering dendrogram of RNA-seq data from NOMO-1 cells upon CS1, CS2, DMSO, shNS or shFTO (shFTO-1) treatment. (B) The overlapped dysregulated genes between CS1 treatment and FTO KD (upper panel), CS2 treatment and FTO KD (middle panel), and CS1 and CS2 treatments (lower panel). (C) The overlapped dysregulated genes among CS1 treatment, CS2 treatment, and FTO KD groups. (D) Distribution of RNA-seq reads in MYC, CEBPA, RARA, and ASB2 mRNA. (E) The overlap of ‘Upregulated pathways’ (left panel) or ‘Downregulated pathways’ (right panel) induced by FTO KD, CS1 and CS2 based on the GSEA analysis. (F and G) Scattergrams of the ‘Upregulated pathways’ (F) and ‘Downregulated pathways’ (G) based on the GSEA analysis. (H) GSEA analysis of shared ‘Up-regulated’ apoptosis, and ‘Down-regulated’ MYC pathways by inhibition of FTO (CS1 or CS2) and KD of FTO (shFTO). All RNA-seq experiments were conducted with at least three independent biological replicates. See also Figure S4 and Table S2.
Figure 5.
Figure 5.. FTO inhibition substantially delayed AML progression and improved survival in vivo
(A) Kaplan-Meier survival curves of AML PDX mouse model (AML 2017–38) treated with free CS1 or CS2. (B) Polymeric Micelles of mPEG-b-PLA (upper panel) and β-cyclodextrin (lower panel) were utilized to deliver CS1. (C) Kaplan-Meier survival curves of AML PDX mouse model (AML 2017–38) treated with free CS1 or Micelle_CS1. (D) Kaplan-Meier survival curves of mice transplanted with primary murine MA9 AML cells treated with free CS1, Micelle_CS1, or CS2. (E and F) Kaplan-Meier survival curves of AML PDX mouse models (AML 2016–9) treated with β-CD_CS1 (E) or CS2 (F). (G and H) In vivo bioluminescence imaging (G) and Kaplan-Meier survival curves (H) of xenograft mouse models with human MA9.3ITD cells treated with β-CD_CS1 or CS2. ns, not significant; p values are derived from log-rank test. See also Figure S5 and Table S1.
Figure 6.
Figure 6.. The FTO/m6A axis contributes to HMA-mediated up-regulation of immune checkpoint genes.
(A) Global m6A abundance upon DAC or PBS treatment for 48 h in MONOMAC 6 cells. (B) qPCR analysis of FTO level changes in MONOMAC 6 cells upon DAC treatment (48 h). (C) qPCR analysis of LILRB4 level changes in NOMO-1 cells upon DAC treatment (48 h). (D) qPCR analysis of LILRB4 in CD3 T cells, healthy MNCs, and AML cell lines. (E) Expression levels of PD-L1, PD-L2, and LILRB4 in the TCGA AML dataset. (F) qPCR analysis of LILRB4 level changes upon CS1 or CS2 treatment in MONOMAC 6 cells. (G and H) qPCR analysis of LILRB4 level changes upon FTO overexpression (G) in NOMO1 cells or FTO KD (H) in MONOMAC 6 cells. (I and J) Flow cytometry analysis of LILRB4 level changes upon FTO overexpression (I) or KD (J) in THP1 cells. (K and L) Western blot analysis of LILRB4 level changes in MONOMAC 6 cells upon FTO KD (K) or inhibition (L). (M) Protein levels of LILRB4 in MONOMAC 6 cells with CS1 or CS1+DAC treatment (left panel), and CS2 or CS2+DAC treatment (right panel). (N and O) m6A abundance changes in LILRB4 mRNA upon FTO inhibition (N) or KD (O) in MONOMAC 6 cells. (P-R) LILRB4 mRNA stability changes in AML cells upon FTO overexpression (P), FTO KD (Q), or YTHDF2 KD (R). Mean ± SEM from 3 independent experiments. *, p < 0.05; **, p < 0.01; ***, p < 0.001. See also Figure S6.
Figure 7.
Figure 7.. FTO inhibition suppressed immune evasion via targeting LILRB4.
(A) Schematic of the co-culture assays with T cells and GFP-labeled human AML cells. (B-E) Effect of CS1 (B) and CS2 (D) on the sensitivity of human AML cells to the cytotoxicity of T cells in vitro. MONOMAC 6 cells were pretreated with CS1 or CS2 for 48 h and LILRB4 levels were validated via qPCR (C and E). (F) Scatter plot of normalized expression for all genes from RNA-seq with the spleen MNCs of MA9 mice with PBS or CS1 treatment. (G) Distribution of RNA-seq reads in Lilrb4 transcript. (H) Schematic showing the method to assess the effect of FTO inhibition on Lilrb4 expression in vivo. (I) Flow cytometry analysis of Lilrb4 expression in vivo. (J and K) Representative (J) and statistical summary (K) of Lilrb4 abundance changes in AML blast cells of MA9 mice upon β-CD_CS1 or CS2 treatment. (L and M) Effects of LILRB4 KO (L) and KD (M) on cell proliferation in MONOMAC 6 cells. (N and O) Effect of LILRB4 overexpression (N) on T-cell toxicity (O) in NOMO-1 cells. Mean ± SEM for B, C, D, E and O; while mean ± SD for K, L, and M, n = 3. *, p < 0.05; **, p < 0.01; ***, p < 0.001. See also Figure S7.
Figure 8.
Figure 8.. The in vivo effects of FTO inhibitors on immunotherapy and solid tumors.
(A and B) Bioluminescence images (A) and Kaplan-Meier survival curves (B) of NRGS mice with MA9.3ITD AML subjected to treatment with FTO inhibitors and/or activated human T-cells. (C) Kaplan-Meier survival curves of MA9 AML mouse models upon treatments as indicated. (D) Tumor growth curves of NSG mice bearing human breast cancer upon treatment with vehicle control, β-CD_CS1 or CS2. Dots represent the mean tumor volume in cubic millimeters ± SD (n = 10). (E) Representative bioluminescence images of NSG mice at their endpoints. For survival curves, the p values were calculated using the log-rank test. *, p < 0.05; **, p < 0.01; ***, p < 0.001; ****, p < 0.0001; NS: not significant. For the tumor growth curve, ***, p < 0.001 as assayed by one-way ANOVA. See also Figure S7 and S8.

Comment in

References

    1. Alfayez M, and Borthakur G (2018). Checkpoint inhibitors and acute myelogenous leukemia: promises and challenges. Expert review of hematology 11, 373–389. - PubMed
    1. Baell JB, and Holloway GA (2010). New substructure filters for removal of pan assay interference compounds (PAINS) from screening libraries and for their exclusion in bioassays. J Med Chem 53, 2719–2740. - PubMed
    1. Barbieri I, Tzelepis K, Pandolfini L, Shi J, Millan-Zambrano G, Robson SC, Aspris D, Migliori V, Bannister AJ, Han N, et al. (2017). Promoter-bound METTL3 maintains myeloid leukaemia by m(6)A-dependent translation control. Nature 552, 126–131. - PMC - PubMed
    1. Beatty GL, and Gladney WL (2015). Immune escape mechanisms as a guide for cancer immunotherapy. Clin Cancer Res 21, 687–692. - PMC - PubMed
    1. Berger R, Rotem-Yehudar R, Slama G, Landes S, Kneller A, Leiba M, Koren-Michowitz M, Shimoni A, and Nagler A (2008). Phase I safety and pharmacokinetic study of CT-011, a humanized antibody interacting with PD-1, in patients with advanced hematologic malignancies. Clin Cancer Res 14, 3044–3051. - PubMed

Publication types

MeSH terms