Multicenter Study
. 2020 Aug;146(2):315-324.e7.
doi: 10.1016/j.jaci.2020.05.051. Epub 2020 Jun 10.

Expression of SARS-CoV-2 receptor ACE2 and coincident host response signature varies by asthma inflammatory phenotype

Affiliations
Multicenter Study

Expression of SARS-CoV-2 receptor ACE2 and coincident host response signature varies by asthma inflammatory phenotype

Matthew Camiolo et al. J Allergy Clin Immunol. 2020 Aug.

Abstract

Background: More than 300 million people carry a diagnosis of asthma, with data to suggest that they are at a higher risk for infection or adverse outcomes from severe acute respiratory syndrome coronavirus 2. Asthma is remarkably heterogeneous, and it is currently unclear how patient-intrinsic factors may relate to coronavirus disease 2019.

Objective: We sought to identify and characterize subsets of patients with asthma at increased risk for severe acute respiratory syndrome coronavirus 2 infection.

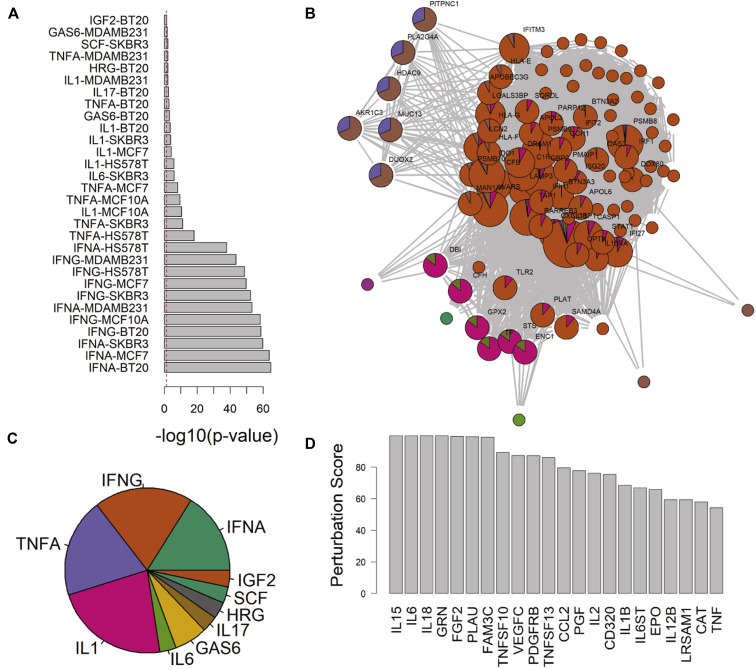
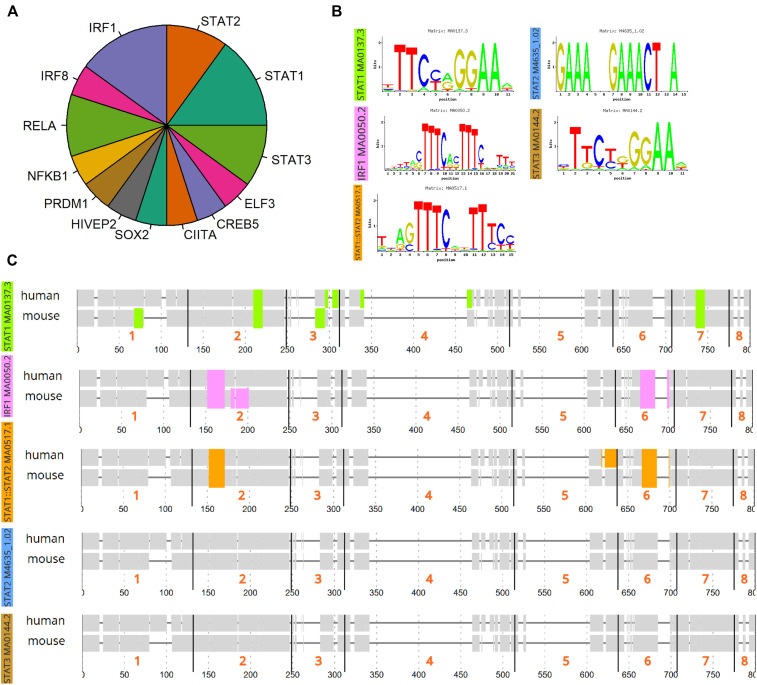
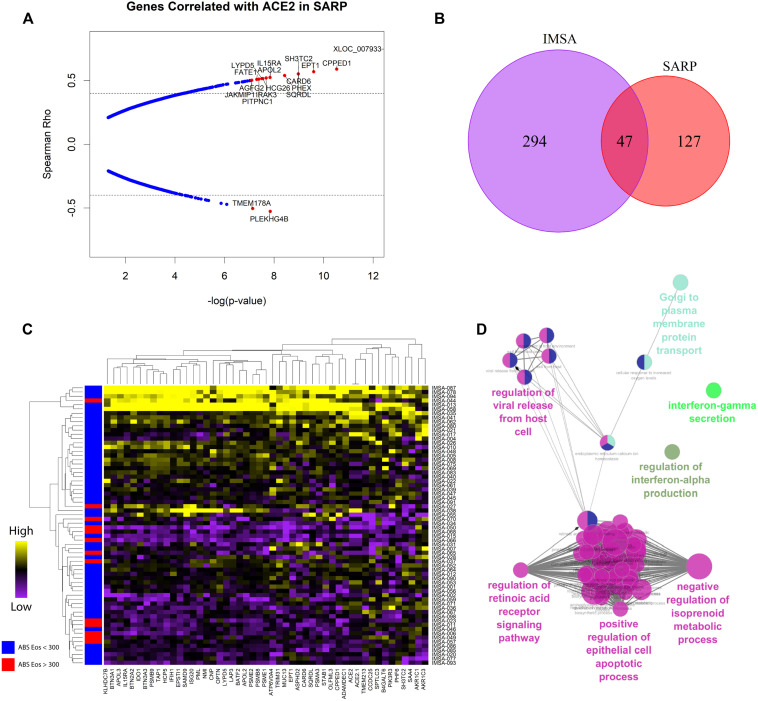
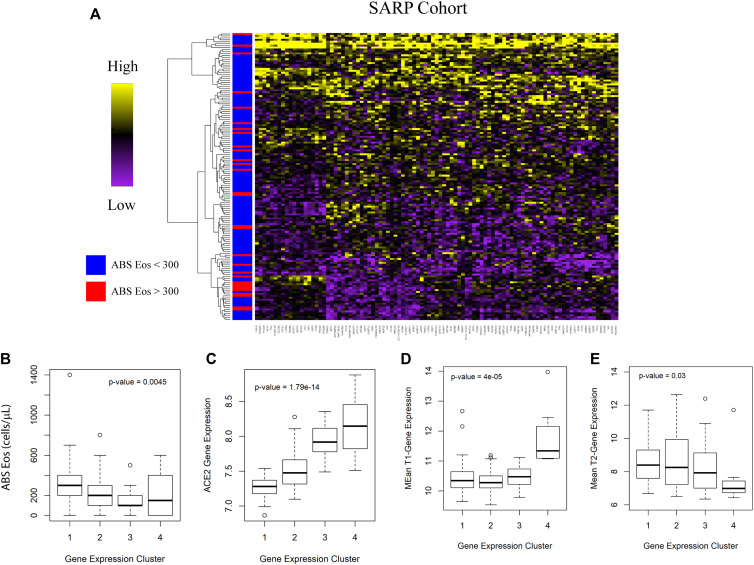
Methods: Participants from 2 large asthma cohorts were stratified using clinically relevant parameters to identify factors related to angiotensin-converting enzyme-2 (ACE2) expression within bronchial epithelium. ACE-2-correlated gene signatures were used to interrogate publicly available databases to identify upstream signaling events and novel therapeutic targets.

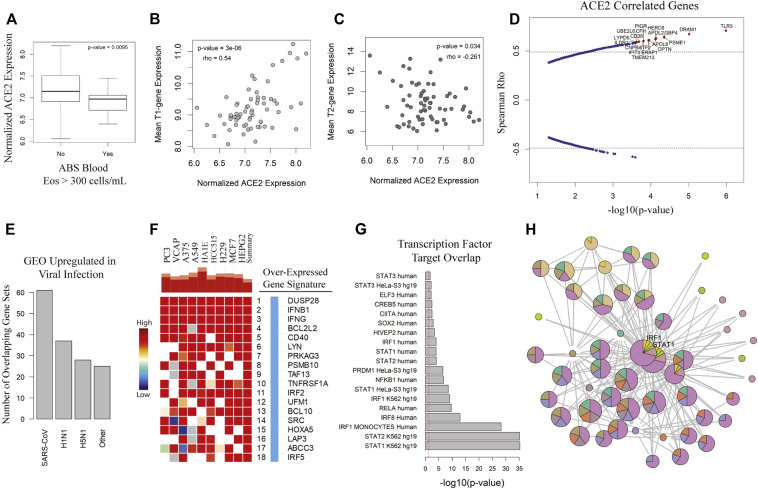
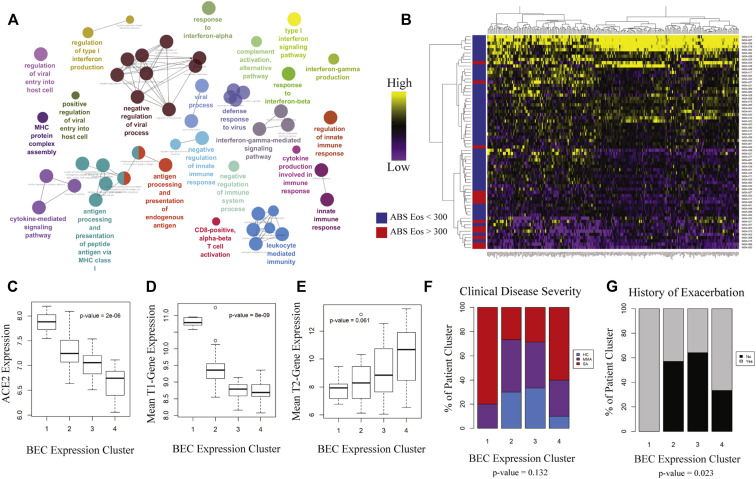
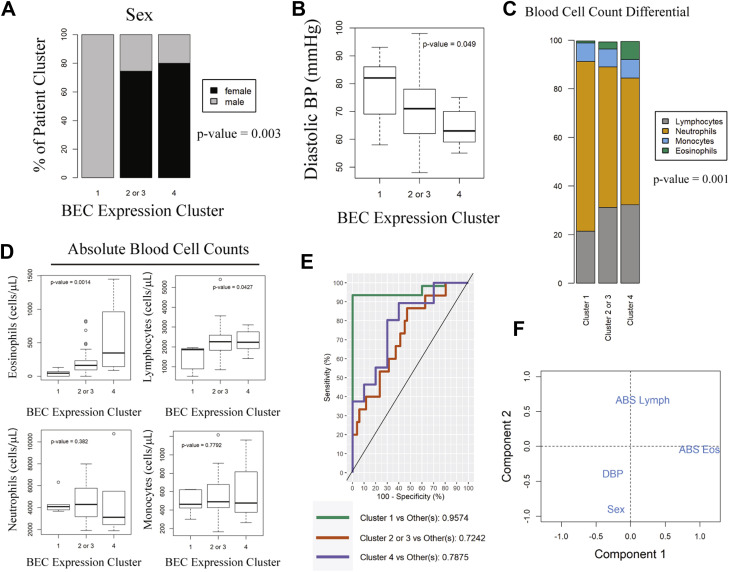
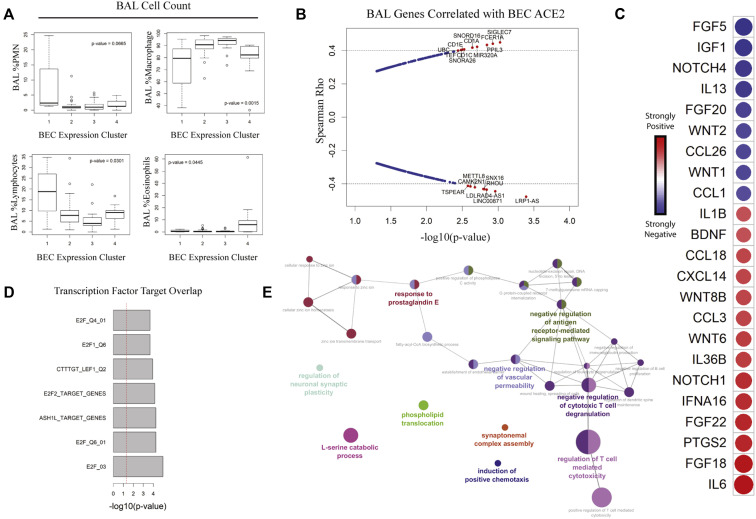
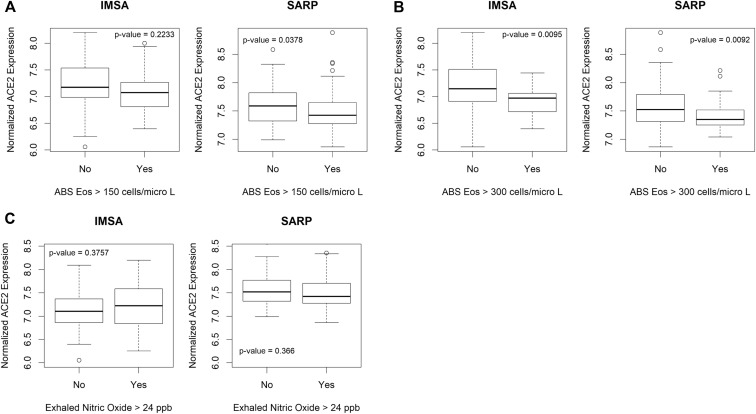
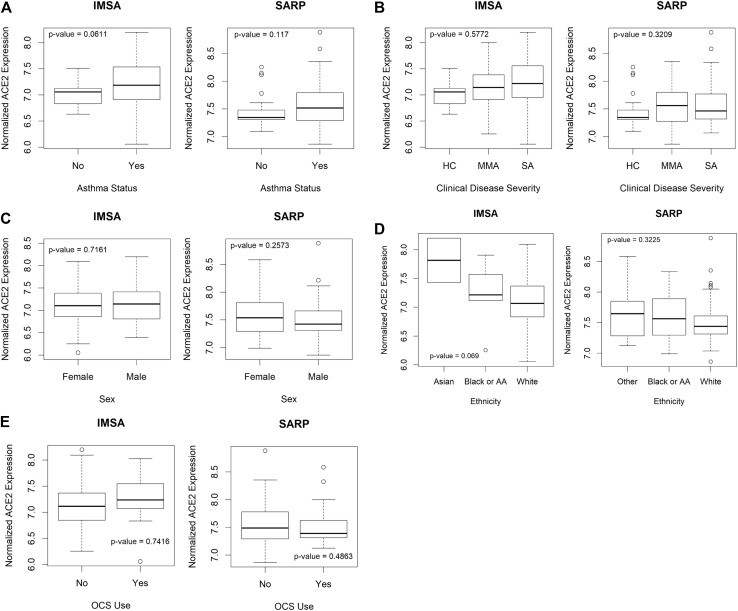
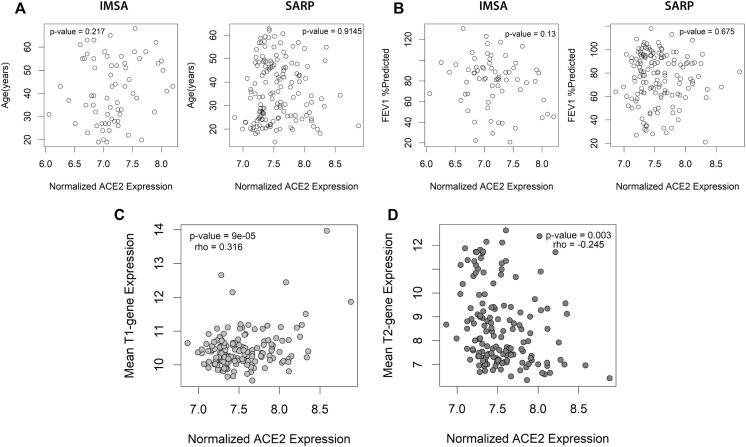
Results: Stratifying by type 2 inflammatory biomarkers, we identified subjects who demonstrated low peripheral blood eosinophils accompanied by increased expression of the severe acute respiratory syndrome coronavirus 2 receptor ACE2 in bronchial epithelium. Genes highly correlated with ACE2 overlapped with type 1 and 2 IFN signatures, normally induced by viral infections. T-cell recruitment and activation within bronchoalveolar lavage cells of ACE2-high subjects was reciprocally increased. These patients demonstrated characteristics corresponding to risk factors for severe coronavirus disease 2019, including male sex, history of hypertension, low peripheral blood, and elevated bronchoalveolar lavage lymphocytes.

Conclusions: ACE2 expression is linked to upregulation of viral response genes in a subset of type 2-low patients with asthma with characteristics resembling known risk factors for severe coronavirus disease 2019. Therapies targeting the IFN family and T-cell-activating factors may therefore be of benefit in a subset of patients.

Keywords: ACE2; COVID-19; SARS-CoV-2; Type-2 low; asthma; coronavirus; interferons; viral response.


Figures

Fig 1
Fig 1
ACE2 is increased in T2-low patients with asthma and is correlated with viral response genes. A, Boxplot of ACE2 by blood absolute (ABS) eosinophil (Eos) cutoff. Comparison made using Student t test. Spearman rank correlation for composite T1 (B) or T2 (C) gene expression score vs ACE2 transcript level with rho and P value as indicated. D, Spearman rho vs −log10(P value) for genes associated with ACE2. Hashed lines indicate 99th percentile of rho values. Genes of interest are highlighted in red. E, Count of GEO data sets upregulated in viral infections overlapping with ACE2-correlated genes. F, Heatmap indicating strength of overlap between in vitro overexpression conditions from the LINCS database vs ACE2-correlated signature from the IMSA cohort. G, Plotting of TFT sets overlapped with BEC ACE2-correlated signature from the CHEA, TTRUST, and ENCODE libraries. H, Graphical resolution of membership between TFT sets identifying STAT1 and IRF1 as having greatest enrichment in the ACE2-correlated gene list. LINCS, Library of Integrated Network-Based Cellular Signatures; TFT, transcription factor target.
Fig 2
Fig 2
Patient clustering using ACE2-correlated genes identifies 2 groups of patients with severe asthma with distinct immune profiles. Following identification of an ACE2-correlated gene signature within the IMSA cohort, (A) gene ontology enrichment mapping was performed using the Cytoscape plug-in ClueGo. Only terms that met a significance threshold of P value less than .001 are included in the graph. B, Heatmap of expression of ACE2-correlated genes within BECs across patients in the IMSA cohort. Row side bar indicates those participants with absolute blood eosinophil counts less than (blue) or greater than (red) 300 cells/μL. C, Boxplot of normalized ACE2 expression across BEC expression clusters. Kruskal-Wallis testing for variation in expression was performed, with P value indicated on the graph. Boxplot of mean T1 (D) or T2 (E) gene expression across BEC expression clusters. Breakdown of (F) clinical disease severity and (G) history of exacerbation in preceding year across BEC expression clusters. ABS, Absolute; Eos, eosinophils.
Fig 3
Fig 3
Noninvasive clinical and peripheral blood factors identify the potentially high COVID-19 risk in PC1. A, Distribution of sex across BEC expression clusters. Independence of distribution was calculated via likelihood-ratio chi-square test. B, Boxplot of diastolic BP across BEC expression clusters. Variation was tested by Kruskal-Wallis. C, Stacked bar chart of peripheral blood differential cell counts across BEC expression clusters in the IMSA cohort. Height of bars represents mean cell percentages across patients in the BEC cluster. P value of difference in proportion for neutrophils and lymphocytes is reported in the figure. D, Absolute blood cell counts plotted across BEC expression clusters. Variation was tested using Kruskal-Wallis. E, ROC curve of prediction model for BEC expression cluster using differential blood cell count, sex, and diastolic BP. Wilcoxon test for one class vs the others met a significance threshold of P less than .05 for all groups. F, Plot of variance for included prediction parameters across components used in model. ABS, Absolute; BP, blood pressure; DBP, diastolic blood pressure; Eos, eosinophils; Lymph, lymphocytes; ROC, receiver operating characteristic.
Fig 4
Fig 4
Intercompartmental crosstalk links high epithelial ACE2 with activated BAL lymphocytes. A, Boxplot of BAL immune cell composition across BEC clusters. Variation was tested using Kruskal-Wallis. B, Spearman rho vs −log10(P value) for association of BEC ACE2 with genes in BAL cells. Hashed lines indicate 99th percentile of rho values. Genes of interest are highlighted in red. C, Correlogram of cytokine expression by BAL cells vs epithelial ACE2. Colors of circles indicate directionality: red for positive and blue for negative Spearman rho values. Circle sizes are inversely proportional to P values. D, TFT sets overlapped with BAL ACE2-correlated signature. E, Gene ontology enrichment mapping of BAL ACE2-correlated signature. PMN, Polymorphonuclear cell; TFT, transcription factor target.
Fig 5
Fig 5
Novel targets for antagonizing ACE2-correlated gene expression are identified using curated ligand stimulation models. A, Plot of −log10(P value) overlap between ligand stimulation conditions in cultured cell lines and ACE2-correlated BEC signature. B, Graphical approach to resolving overlapping membership of genes between ligand stimulation conditions identified hub genes shared between data sets. C, Pie chart of count for aggregated results from ligand stimulation and ACE2-signature overlap. D, Arbitrary perturbation score plots from the LINCS database for cytokines that negatively impact the expression of ACE2 hub genes upon knockdown in vitro. LINCS, Library of Integrated Network-Based Cellular Signatures.
Fig E1
Fig E1
Biomarkers for T2 inflammation identify patients with differential ACE2 expression. Evaluation of participants in asthma cohorts for differential expression of ACE2 based on clinically relevant biomarkers of T2 inflammation. A, A cutoff of more than 300 eosinophils/μL of peripheral blood identifies patients with differential expression of ACE2 by bronchial epithelium in the IMSA cohort. Boxplot represents normalized ACE2 expression broken down by blood absolute eosinophil cutoff. Bars represent median values, with bounds of boxes representing interquartile range (IQR) and whiskers representing 1.5 times the upper or lower IQR. Testing was performed using Student t test. B, Differential expression of ACE2 can be identified using a cutoff of either more than 150 or more than 300 eosinophils/μL of peripheral blood in the SARP cohort. C, Comparison of ACE2 level for patients with measured exhaled nitric oxide over the commonly used threshold of more than 24 parts per billion showed no difference in expression in either the IMSA cohort or the SARP cohort. ABS, Abslolute; Eos, eosinophils.
Fig E2
Fig E2
Relationship between clinical parameters and ACE2 expression. Testing for differential expression of ACE2 using clinical parameters including (A) asthma status, (B) clinical disease severity, (C) sex, (D) ethnicity, or (E) oral corticosteroid (OCS) use did not reveal significant variation in either the IMSA cohort or the SARP cohort. Boxplots of normalized ACE2 expression broken down clinical parameters are plotted as indicated. Bars represent median values, with bounds of boxes representing IQR and whiskers representing 1.5 times the upper or lower IQR. Testing was performed using Student t test. AA, African American; HC, healthy control; IQR, interquartile range; MMA, mild to moderate asthma; SA, severe asthma.
Fig E3
Fig E3
Correlation between other clinical parameters and ACE2 expression. Spearman rank correlation between (A) age or (B) FEV1% predicted and normalized ACE2 expression using Spearman rank was performed in both IMSA and SARP cohorts, demonstrating no significant relationship. Spearman rank correlation for composite T1 (C) or T2 (D) gene expression score vs ACE2 transcript level for participants in the SARP cohort with rho and P value as indicated.
Fig E4
Fig E4
Transcription factor binding predictions at the ACE2 genomic locus. A, Results of transcription factor target analysis from the CHEA, ENCODE, and TTRUST data sets were aggregated using semantic similarity and relative count plotted as fractions in pie chart. B, ConTra analysis of predicted transcription factor binding sites at the ACE2 genomic locus on the X chromosome was performed using the relevant JASPAR binding sequences indicated in the figure. C, Predicted sites for STAT1, IRF1, STAT1:STAT2, STAT2, and STAT3 within the ACE2 promoter region through 500 bp upstream.
Fig E5
Fig E5
ACE2-correlated genes are consistent between independent asthma cohorts. A, Plotting of Spearman correlation rho vs −log10(P value) for genes associated with ACE2 in BECs in the SARP cohort with P value less than .05 after correction for multiple testing for FDR less than 5%. Hashed lines indicate the 99th percentile of rho values. Genes of interest are highlighted in red as indicated in the figure. B, Venn diagram indicating overlap of genes in the IMSA and SARP cohorts that had a Spearman rho value of more than 0.4, with P value less than .05 after correction for multiple testing for FDR less than 5%. C, Heatmap of expression of genes identified in overlap analysis across patients in the IMSA cohort. Row side bar indicates those participants with absolute blood eosinophil counts less than (blue) or greater than (red) 300 cells/μL. Patients (rows) and genes (columns) are ordered according to similarity. D, Gene ontology enrichment term mapping for transcripts correlated with ACE2 in both IMSA and SARP cohorts using the Cytoscape plug-in ClueGo. FDR, False-discovery rate.
Fig E6
Fig E6
Clustering of the SARP cohort by ACE2-correlated genes recapitulates groupings similar to IMSA. Ability to cluster patients into clinically meaningful groups was validated in the SARP cohort using ACE2-correlated genes. A, Heatmap of expression of ACE2-correlated genes across patients in the SARP cohort. Row side bar indicates those participants with absolute blood eosinophil counts less than (blue) or greater than (red) 300 cells/μL. Patients are clustered according to similarity in gene expression. B, Boxplot of peripheral blood absolute eosinophil count across BEC clusters in the SARP cohort. Bars represent median values, with bounds of boxes representing IQR and whiskers representing 1.5 times the upper or lower IQR. Kruskal-Wallis testing was performed, with P value indicated on the graph. C, Boxplot of normalized ACE2 expression across BEC expression clusters. Variation in expression was tested by Kruskal-Wallis. ABS, Absolute; Eos, eosinophils; IQR, interquartile range.

References

    1. Garg S., Kim L., Whitaker M., O’Halloran A., Cummings C., Holstein R. Hospitalization rates and characteristics of patients hospitalized with laboratory-confirmed coronavirus disease 2019—COVID-NET, 14 states, March 1–30, 2020. MMWR Morb Mortal Wkly Rep. 2020;69 - PMC - PubMed
    1. Li X, Xu S, Yu M, Wang K, Tao Y, Zhou Y, et al. Risk factors for severity and mortality in adult COVID-19 inpatients in Wuhan [April 12, 2020]. J Allergy Clin Immunol. https://doi.org/10.1016/j.jaci.2020.04.006. - DOI - PMC - PubMed
    1. Ray A., Camiolo M., Fitzpatrick A., Gauthier M., Wenzel S.E. Are we meeting the promise of endotypes and precision medicine in asthma? Physiol Rev. 2020;100:983–1017. - PMC - PubMed
    1. Song W., Gui M., Wang X., Xiang Y. Cryo-EM structure of the SARS coronavirus spike glycoprotein in complex with its host cell receptor ACE2. PLoS Pathog. 2018;14 - PMC - PubMed
    1. Zhou P., Yang X.L., Wang X.G., Hu B., Zhang L., Zhang W. A pneumonia outbreak associated with a new coronavirus of probable bat origin. Nature. 2020;579:270–273. - PMC - PubMed

Publication types

MeSH terms