

Myelination- and immune-mediated MR-based brain network correlates
- PMID: 32532336
- PMCID: PMC7293122
- DOI: 10.1186/s12974-020-01827-z
Myelination- and immune-mediated MR-based brain network correlates
Abstract
Background: Multiple sclerosis (MS) is an autoimmune disease of the central nervous system (CNS), characterized by inflammatory and neurodegenerative processes. Despite demyelination being a hallmark of the disease, how it relates to neurodegeneration has still not been completely unraveled, and research is still ongoing into how these processes can be tracked non-invasively. Magnetic resonance imaging (MRI) derived brain network characteristics, which closely mirror disease processes and relate to functional impairment, recently became important variables for characterizing immune-mediated neurodegeneration; however, their histopathological basis remains unclear.
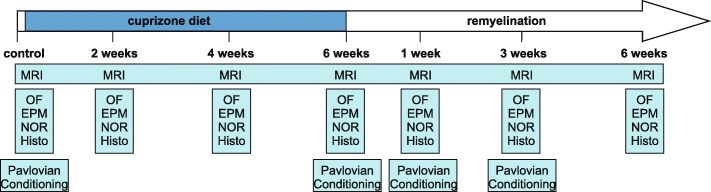
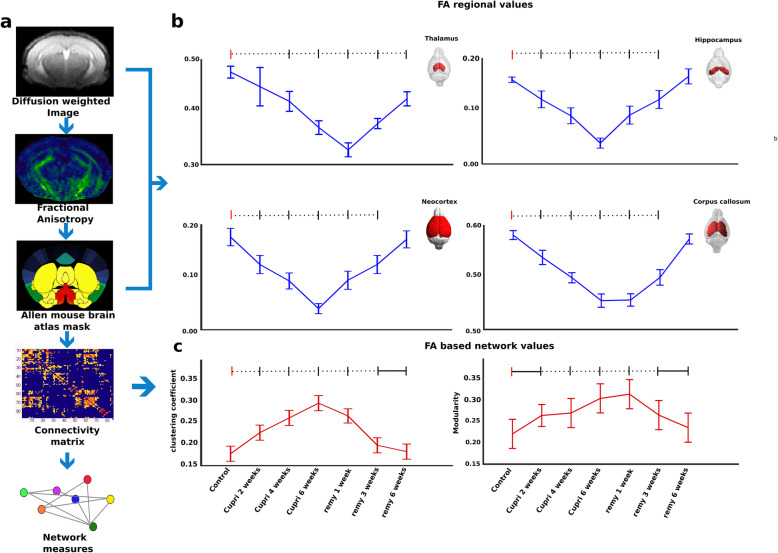
Methods: In order to determine the MRI-derived correlates of myelin dynamics and to test if brain network characteristics derived from diffusion tensor imaging reflect microstructural tissue reorganization, we took advantage of the cuprizone model of general demyelination in mice and performed longitudinal histological and imaging analyses with behavioral tests. By introducing cuprizone into the diet, we induced targeted and consistent demyelination of oligodendrocytes, over a period of 5 weeks. Subsequent myelin synthesis was enabled by reintroduction of normal food.
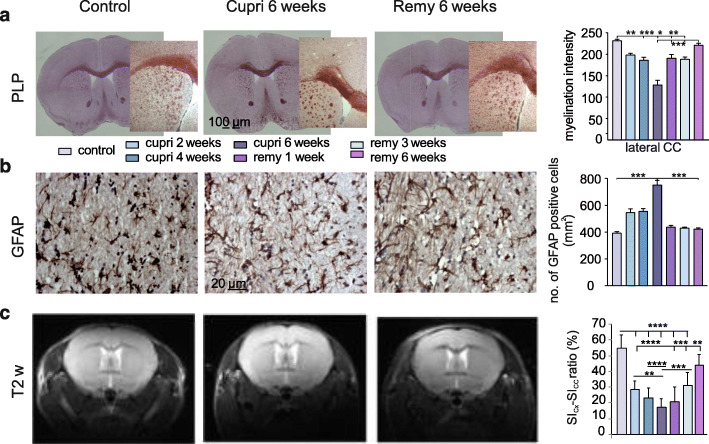
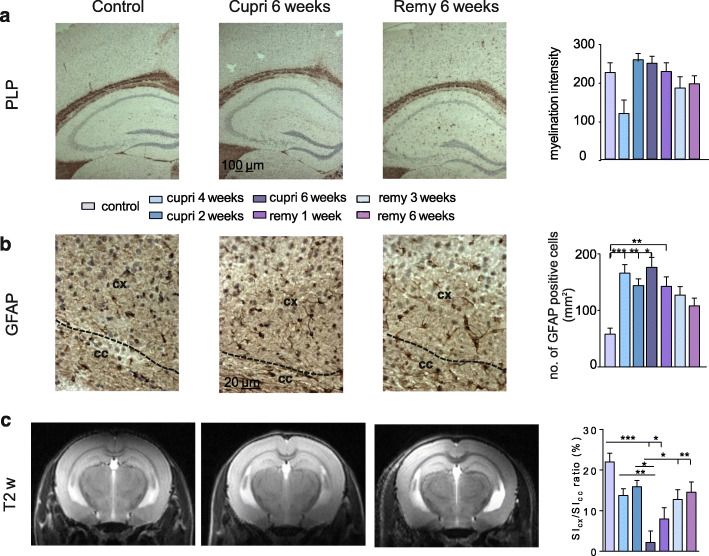
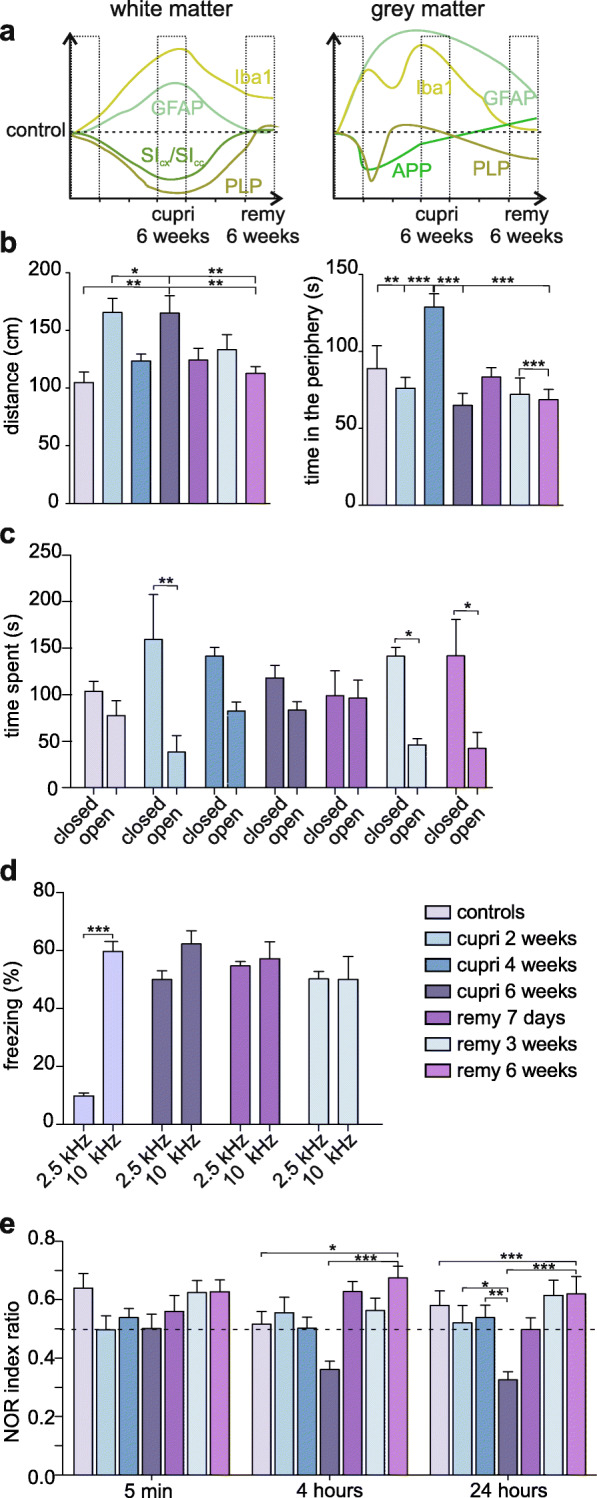
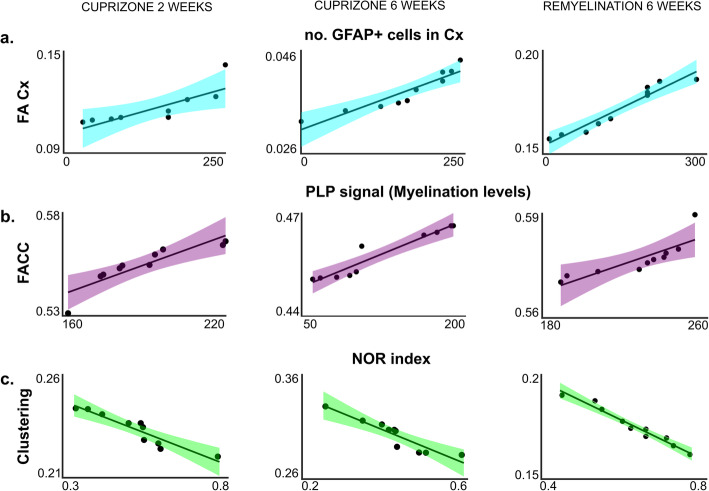
Results: Using specific immune-histological markers, we demonstrated that 2 weeks of cuprizone diet induced a 52% reduction of myelin content in the corpus callosum (CC) and a 35% reduction in the neocortex. An extended cuprizone diet increased myelin loss in the CC, while remyelination commenced in the neocortex. These histologically determined dynamics were reflected by MRI measurements from diffusion tensor imaging. Demyelination was associated with decreased fractional anisotropy (FA) values and increased modularity and clustering at the network level. MRI-derived modularization of the brain network and FA reduction in key anatomical regions, including the hippocampus, thalamus, and analyzed cortical areas, were closely related to impaired memory function and anxiety-like behavior.
Conclusion: Network-specific remyelination, shown by histology and MRI metrics, determined amelioration of functional performance and neuropsychiatric symptoms. Taken together, we illustrate the histological basis for the MRI-driven network responses to demyelination, where increased modularity leads to evolving damage and abnormal behavior in MS. Quantitative information about in vivo myelination processes is mirrored by diffusion-based imaging of microstructural integrity and network characteristics.
Keywords: Demyelination; MRI; Modularity; Network Dynamics; Remyelination.
Conflict of interest statement
All authors report no competing interests.
Figures
Similar articles
-
Diffusion kurtosis imaging probes cortical alterations and white matter pathology following cuprizone induced demyelination and spontaneous remyelination.Neuroimage. 2016 Jan 15;125:363-377. doi: 10.1016/j.neuroimage.2015.10.052. Epub 2015 Oct 23. Neuroimage. 2016. PMID: 26525654 Free PMC article.
-
Quantitative temporal changes in DTI values coupled with histological properties in cuprizone-induced demyelination and remyelination.Neurochem Int. 2018 Oct;119:151-158. doi: 10.1016/j.neuint.2017.10.004. Epub 2017 Oct 10. Neurochem Int. 2018. PMID: 29030079
-
rHIgM22 enhances remyelination in the brain of the cuprizone mouse model of demyelination.Neurobiol Dis. 2017 Sep;105:142-155. doi: 10.1016/j.nbd.2017.05.015. Epub 2017 May 30. Neurobiol Dis. 2017. PMID: 28576706
-
De- and remyelination in the CNS white and grey matter induced by cuprizone: the old, the new, and the unexpected.Histol Histopathol. 2011 Dec;26(12):1585-97. doi: 10.14670/HH-26.1585. Histol Histopathol. 2011. PMID: 21972097 Review.
-
The neurotoxicant, cuprizone, as a model to study demyelination and remyelination in the central nervous system.Brain Pathol. 2001 Jan;11(1):107-16. doi: 10.1111/j.1750-3639.2001.tb00385.x. Brain Pathol. 2001. PMID: 11145196 Free PMC article. Review.
Cited by
-
Modulation of pacemaker channel function in a model of thalamocortical hyperexcitability by demyelination and cytokines.Cereb Cortex. 2022 Oct 8;32(20):4397-4421. doi: 10.1093/cercor/bhab491. Cereb Cortex. 2022. PMID: 35076711 Free PMC article.
-
Early exercise intervention promotes myelin repair in the brains of ischemic rats by inhibiting the MEK/ERK pathway.Transl Neurosci. 2024 Mar 14;15(1):20220335. doi: 10.1515/tnsci-2022-0335. eCollection 2024 Jan 1. Transl Neurosci. 2024. PMID: 38511170 Free PMC article.
-
Dmd mdx mice have defective oligodendrogenesis, delayed myelin compaction and persistent hypomyelination.Dis Model Mech. 2024 Apr 1;17(4):dmm050115. doi: 10.1242/dmm.050115. Epub 2024 May 9. Dis Model Mech. 2024. PMID: 38721692 Free PMC article.
-
Sex-specific signatures of intrinsic hippocampal networks and regional integrity underlying cognitive status in multiple sclerosis.Brain Commun. 2021 Aug 23;3(3):fcab198. doi: 10.1093/braincomms/fcab198. eCollection 2021. Brain Commun. 2021. PMID: 34514402 Free PMC article.
-
Translational imaging of TSPO reveals pronounced innate inflammation in human and murine CD8 T cell-mediated limbic encephalitis.Sci Adv. 2023 Jun 9;9(23):eabq7595. doi: 10.1126/sciadv.abq7595. Epub 2023 Jun 9. Sci Adv. 2023. PMID: 37294768 Free PMC article.
References
-
- Bitsch A. Acute axonal injury in multiple sclerosis: correlation with demyelination and inflammation. Brain. 2000;123:1174–1183. - PubMed
MeSH terms
Substances
Grants and funding
LinkOut - more resources
Full Text Sources
