. 2020 Aug;33(8):1023-1031.e2.
doi: 10.1016/j.echo.2020.03.016. Epub 2020 Jun 10.

Flow Augmentation in the Myocardium by Ultrasound Cavitation of Microbubbles: Role of Shear-Mediated Purinergic Signaling

Affiliations

Flow Augmentation in the Myocardium by Ultrasound Cavitation of Microbubbles: Role of Shear-Mediated Purinergic Signaling

Federico Moccetti et al. J Am Soc Echocardiogr. 2020 Aug.

Abstract

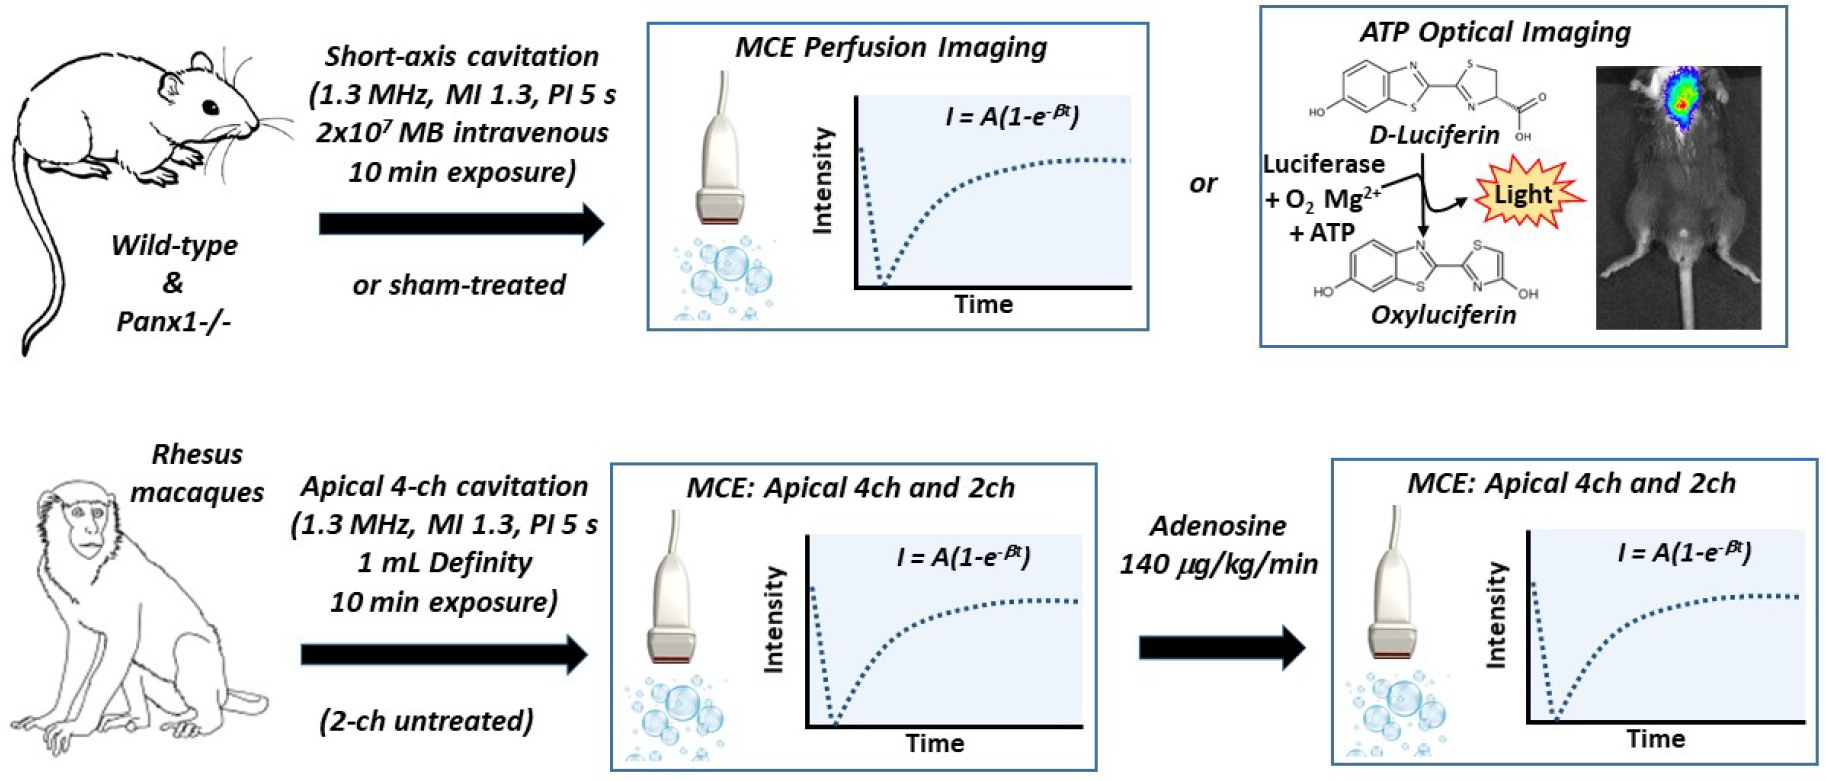
Background: Ultrasound-mediated cavitation of microbubble contrast agents produces high intravascular shear. We hypothesized that microbubble cavitation increases myocardial microvascular perfusion through shear-dependent purinergic pathways downstream from ATP release that is immediate and sustained through cellular ATP channels such as Pannexin-1.

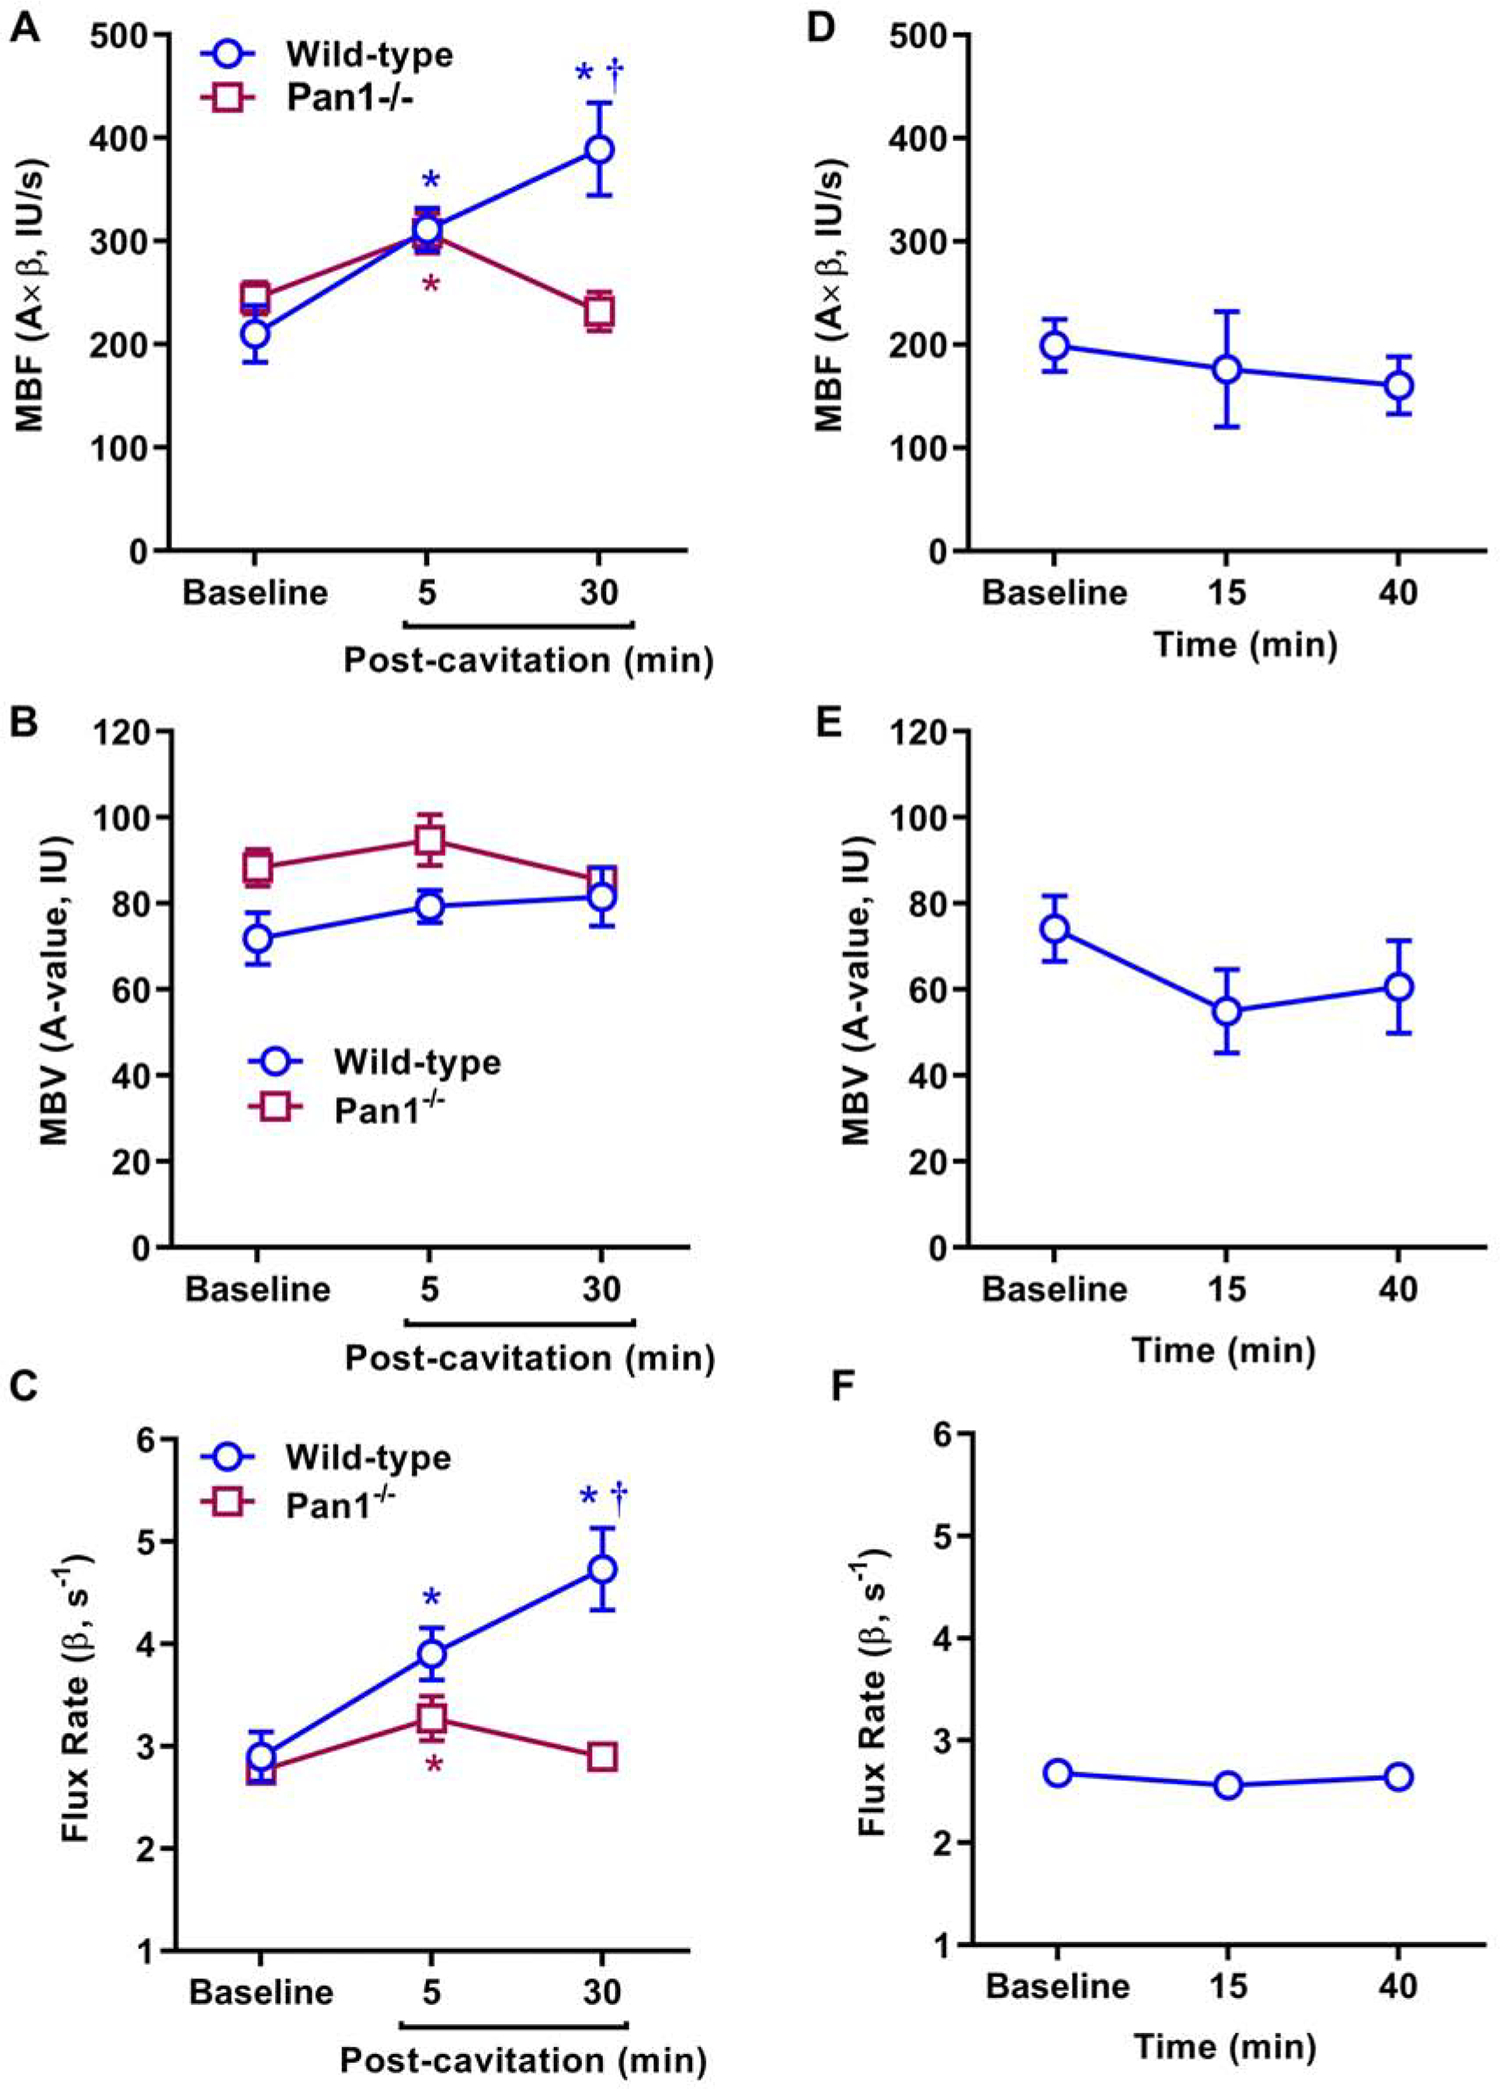
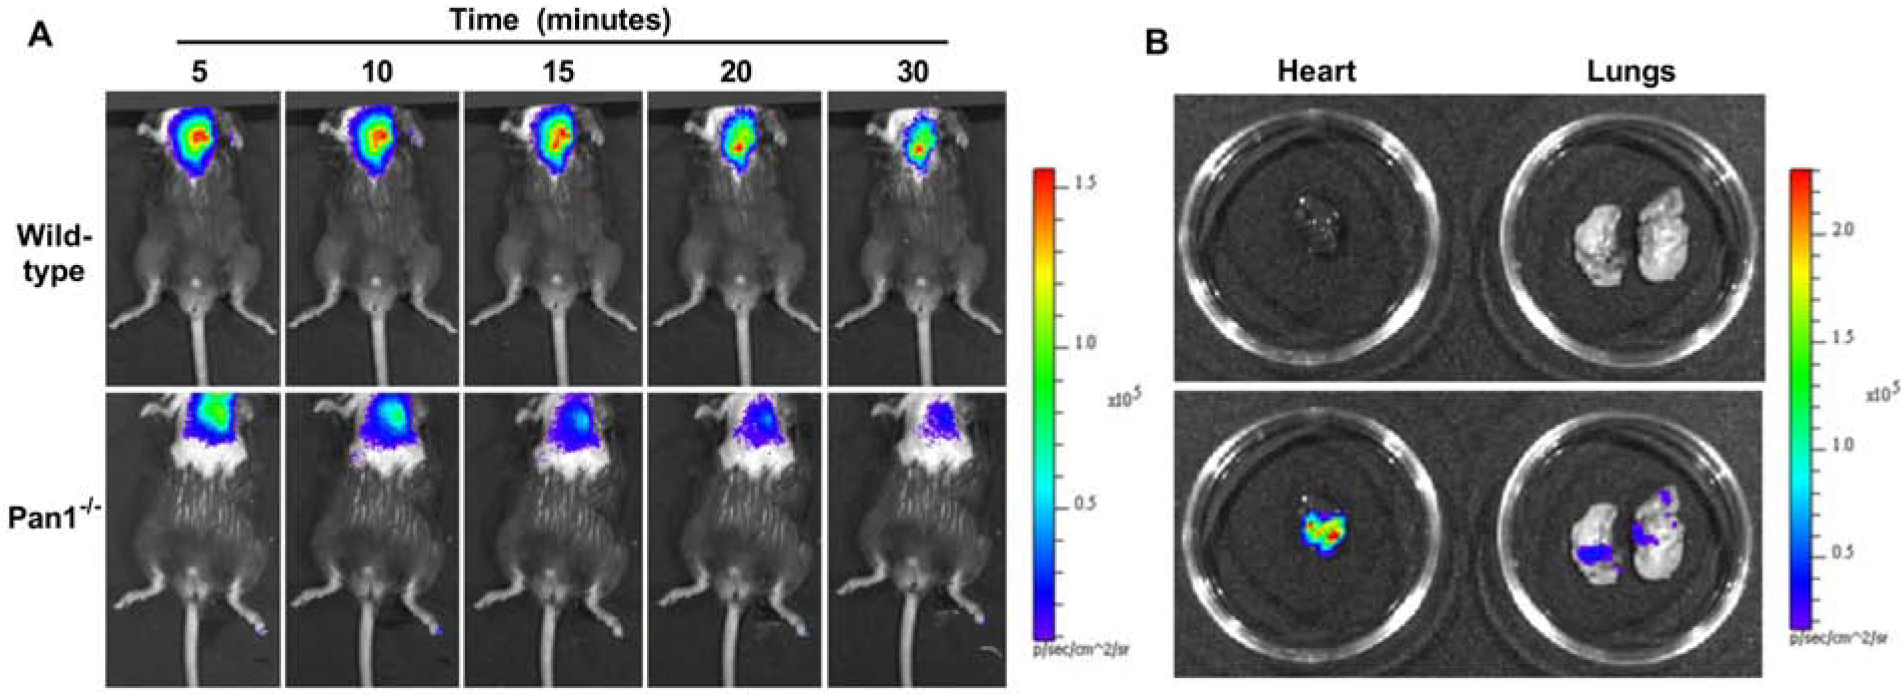
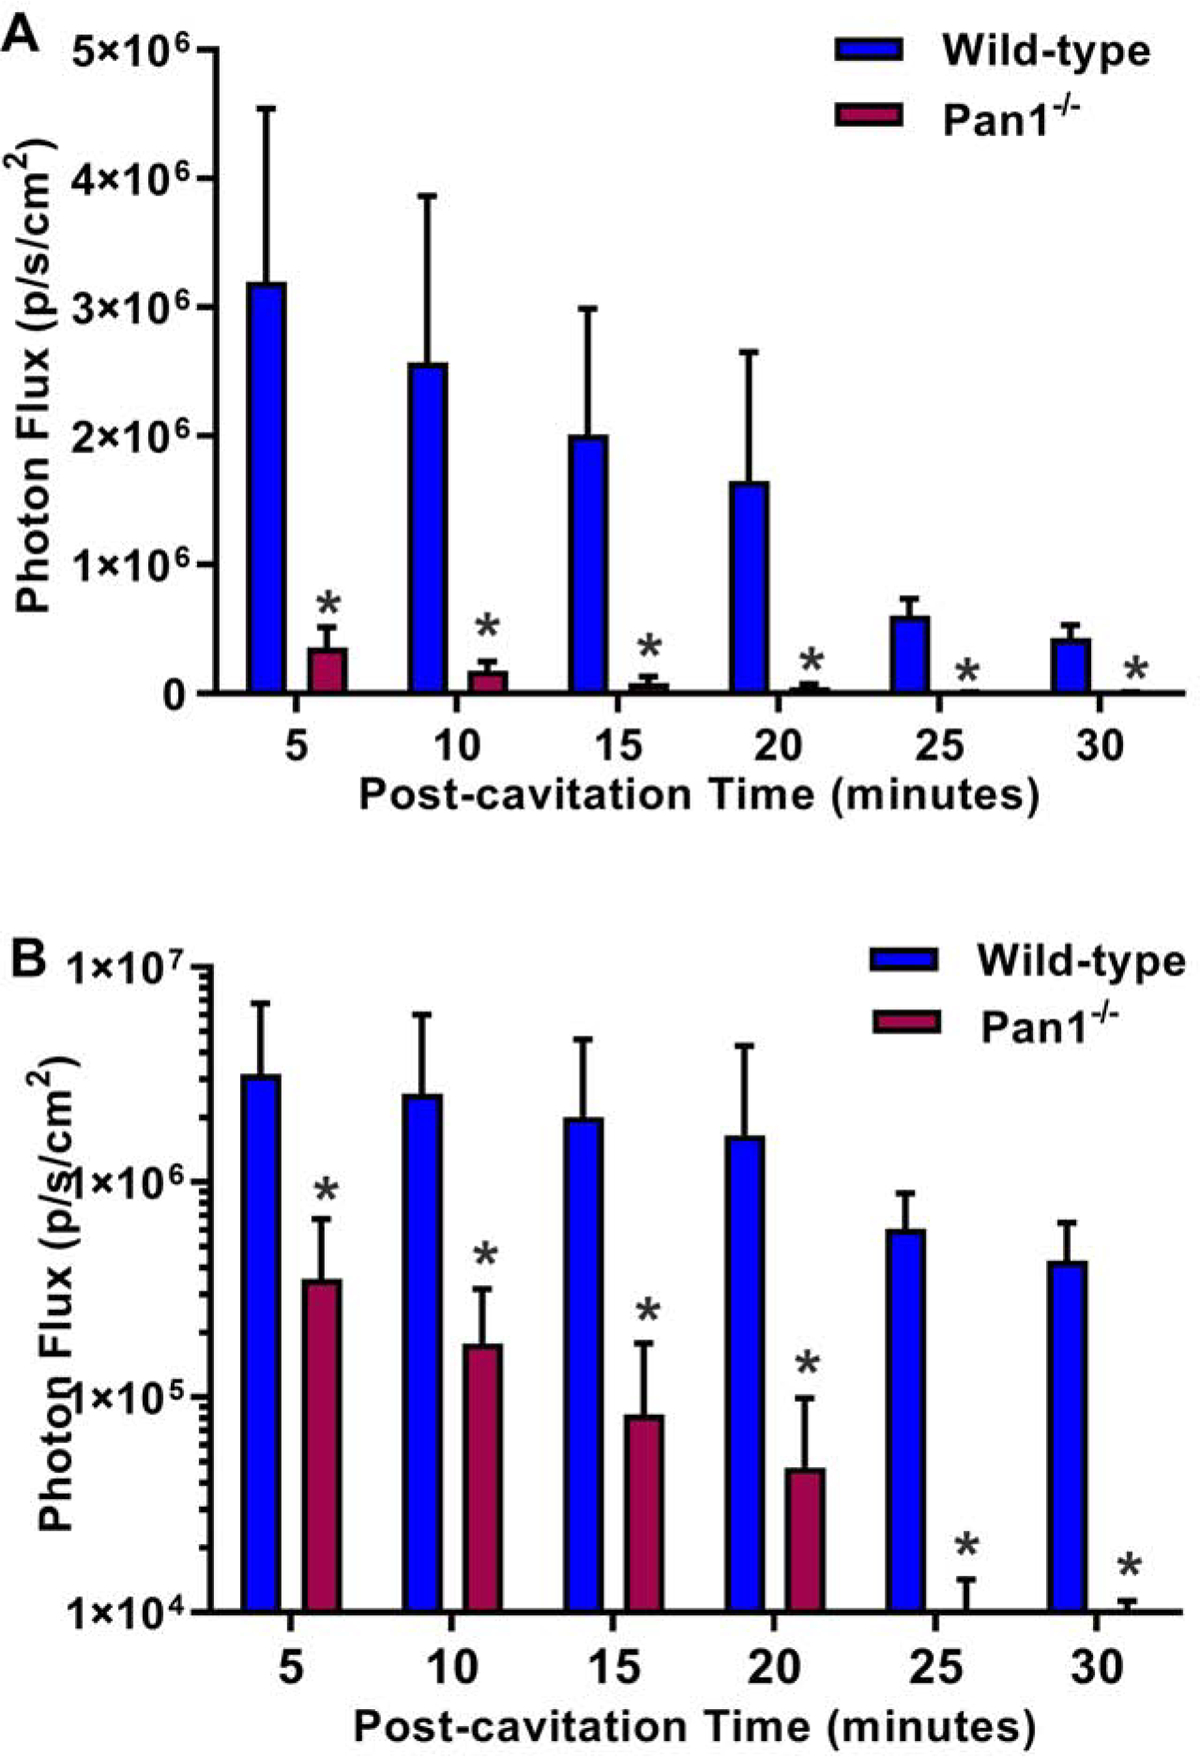
Methods: Quantitative myocardial contrast echocardiography perfusion imaging and in vivo optical imaging of ATP was performed in wild-type and Pannexin-1-deficient (Panx1-/-) mice before and 5 and 30 minutes after 10 minutes of ultrasound-mediated (1.3 MHz, mechanical index 1.3) myocardial microbubble cavitation. Flow augmentation in a preclinical model closer to humans was evaluated in rhesus macaques undergoing myocardial contrast echocardiography perfusion imaging after high-power cavitation in the apical four-chamber plane for 10 minutes.

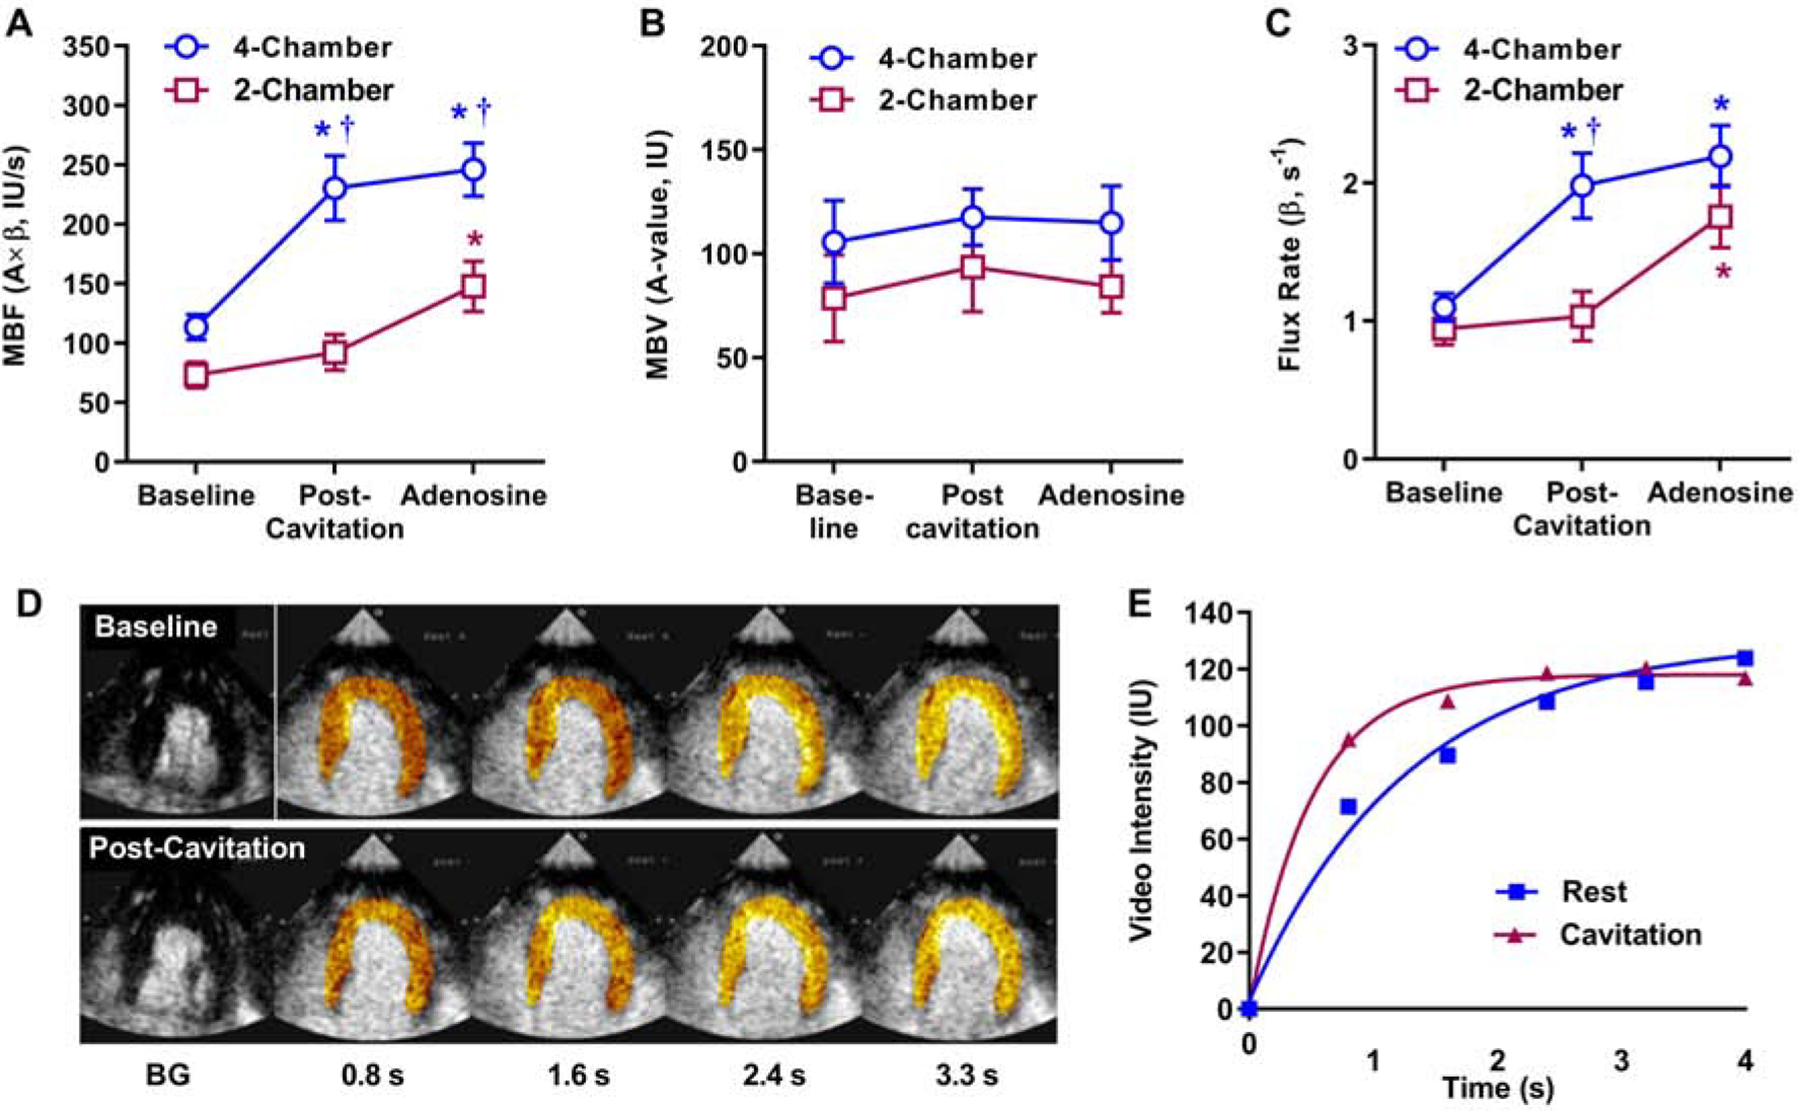
Results: Microbubble cavitation in wild-type mice (n = 7) increased myocardial perfusion by 64% ± 25% at 5 minutes and 95% ± 55% at 30 minutes compared with baseline (P < .05). In Panx1-/- mice (n = 5), perfusion increased by 28% ± 26% at 5 minutes (P = .04) but returned to baseline at 30 minutes. Myocardial ATP signal in wild-type (n = 7) mice undergoing cavitation compared with sham-treated controls (n = 3) was 450-fold higher at 5 minutes and 90-fold higher at 30 minutes after cavitation (P < .001). The ATP signal in Panx1-/- mice (n = 4) was consistently 10-fold lower than that in wild-type mice and was similar to sham controls at 30 minutes. In macaques (n = 8), myocardial perfusion increased twofold in the cavitation-exposed four-chamber plane, similar in degree to that produced by adenosine, but did not increase in the control two-chamber plane.

Conclusions: Cavitation of microbubbles in the myocardial microcirculation produces an immediate release of ATP, likely from cell microporation, as well as sustained release, which is channel dependent and responsible for persistent flow augmentation. These findings provide mechanistic insight by which cavitation improves perfusion and reduces infarct size in patients with myocardial infarction.

Keywords: Cavitation; Contrast ultrasound; Microbubbles; Myocardial blood flow.


Figures

Figure 1.
Figure 1.
Schematic of study design. MB, microbubble; Panx1−/−, pannexin-1 channel deficient mice.
Figure 2.
Figure 2.
Mean (±SEM) values for MCE-derived microvascular blood flow (MBF, A×β), microvascular blood volume (MBV, A-value), and microvascular flux rate (β) in wild-type and Panx1−/− mice undergoing MB cavitation (A to C); and sham-treated wild-type mice (D to F). *p<0.05 versus baseline; †p<0.05 versus Panx1−/−.
Figure 3.
Figure 3.
Examples of background-subtracted color-coded (scale at left) MCE perfusion images with increasing time in seconds (s) after MB destruction from a mouse at (A) baseline and (B) 30 minutes after therapeutic cavitation. (B) MCE time-intensity curves after microbubble destruction from a mouse at baseline and 30 minutes after therapeutic cavitation. The baseline data correlate to images shown in panel A.
Figure 4.
Figure 4.. (A)
Examples of in vivo optical imaging of ATP production using a luciferin-luciferase assay in anesthetized wild-type and Panx1−/− mice at increasing time intervals after MB cavitation. (B) Examples of ex vivo imaging using bright light without (top) and with (bottom) superimposed luminescence imaging for the lung and heart from a wild-type mouse undergoing myocardial MB cavitation. Scales are shown to the right.
Figure 5.
Figure 5.
Mean (±SEM) photon flux on optical imaging of ATP activity from regions-of-interest placed over the anterior chest after ultrasound cavitation in wild-type and Panx1−/− mice. Data are displayed with optical imaging data in linear (A), and log-compressed (B) scale. *p<0.05 versus Panx1−/−.
Figure 6.
Figure 6.
Mean (±SEM) values for MCE-derived (A) microvascular blood flow (MBF, A×β), (B) microvascular blood volume (MBV, A-value), and (C) microvascular flux rate (β) in rhesus macaques. Data are shown for resting conditions, post-cavitation (performed only in tissue within the apical 4-chamber plane), and adenosine infusion). *p<0.05 versus baseline; †p<0.05 versus 2-chamber data. (D and E) Background-subtracted color-coded images and corresponding time-intensity data from the apical 4 chamber view illustrating increase in myocardial perfusion by cavitation.
Figure 7.
Figure 7.
Relations between double product in NHPs at the time of post-cavitation imaging and the perfusion parameters on MCE including (A) microvascular blood flow, (B) microvascular blood volume (A-value), and (C) microvascular flux rate (β-value). Solid line=line of identity; dashed line=standard error of the estimate.

References

    1. Feigl EO. Coronary physiology. Physiol Rev. 1983;63:1–205. - PubMed
    1. Marcus ML, Chilian WM, Kanatsuka H, Dellsperger KC, Eastham CL and Lamping KG. Understanding the coronary circulation through studies at the microvascular level. Circulation. 1990;82:1–7. - PubMed
    1. Durand MJ and Gutterman DD. Diversity in mechanisms of endothelium-dependent vasodilation in health and disease. Microcirculation. 2013;20:239–47. - PMC - PubMed
    1. Forsyth AM, Wan J, Owrutsky PD, Abkarian M and Stone HA. Multiscale approach to link red blood cell dynamics, shear viscosity, and ATP release. Proc Natl Acad Sci USA. 2011;108:10986–91. - PMC - PubMed
    1. Wan J, Ristenpart WD and Stone HA. Dynamics of shear-induced ATP release from red blood cells. Proc Natl Acad Sci USA. 2008;105:16432–7. - PMC - PubMed

Publication types