. 2020 Jul 24;369(6502):413-422.
doi: 10.1126/science.abc0035. Epub 2020 Jun 12.

The impact of COVID-19 and strategies for mitigation and suppression in low- and middle-income countries

Affiliations

The impact of COVID-19 and strategies for mitigation and suppression in low- and middle-income countries

Patrick G T Walker et al. Science. .

Abstract

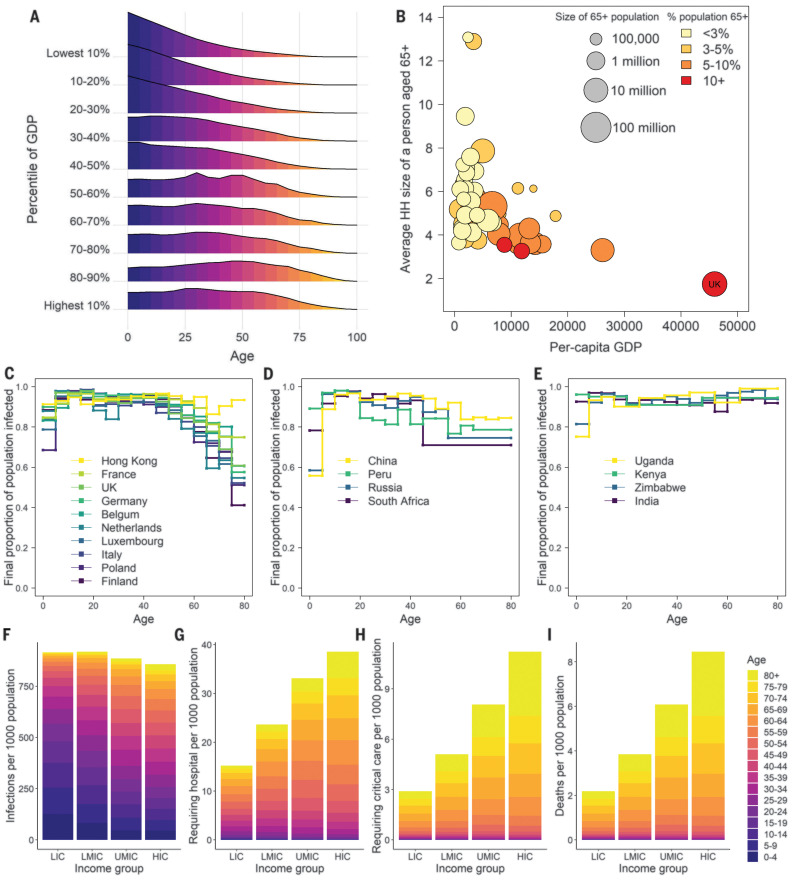
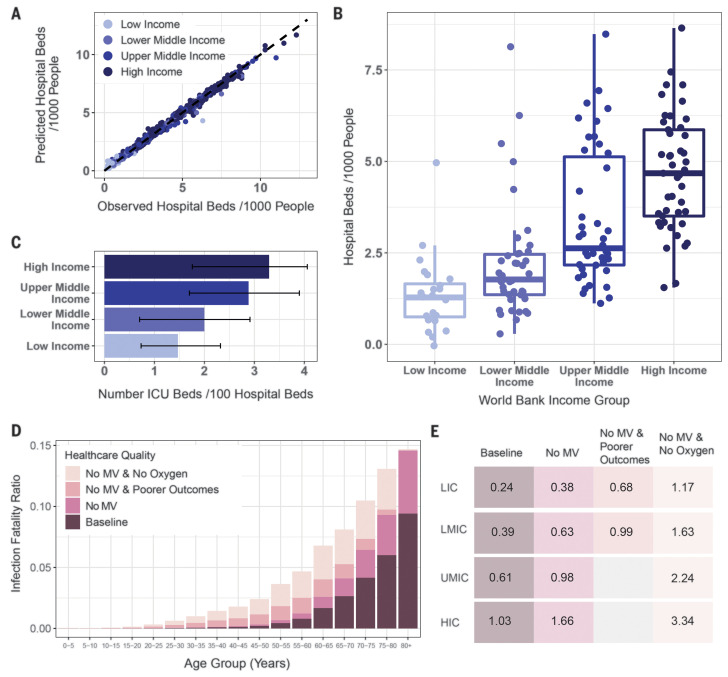
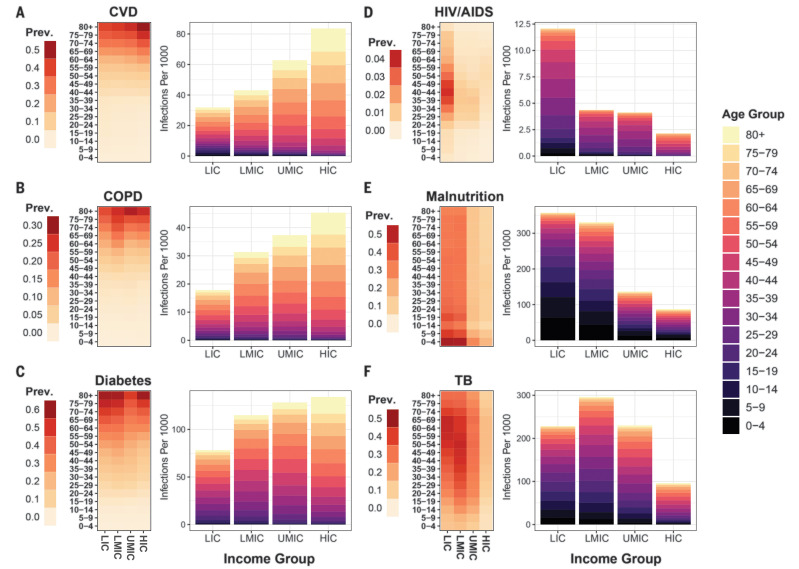
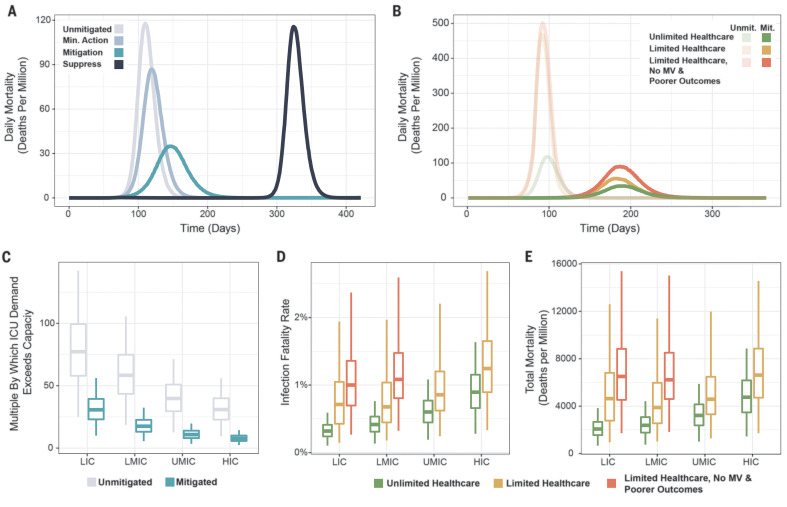
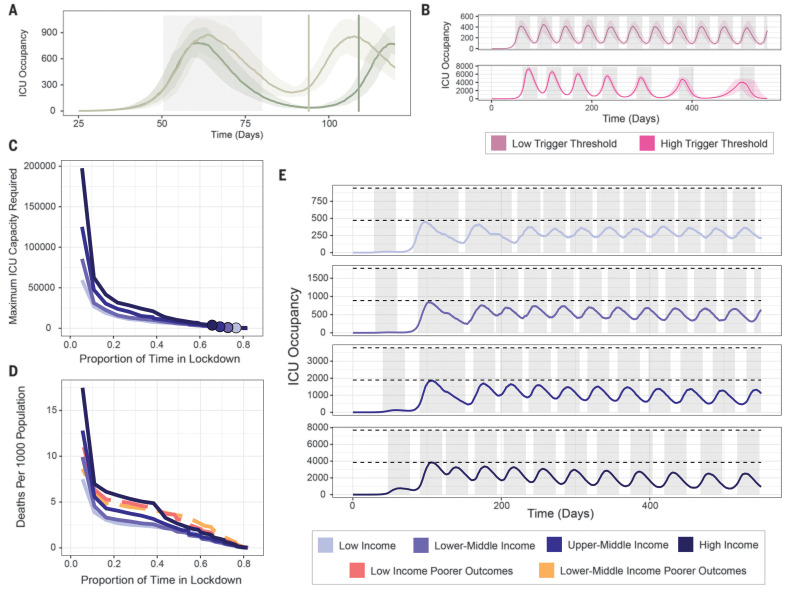
The ongoing coronavirus disease 2019 (COVID-19) pandemic poses a severe threat to public health worldwide. We combine data on demography, contact patterns, disease severity, and health care capacity and quality to understand its impact and inform strategies for its control. Younger populations in lower-income countries may reduce overall risk, but limited health system capacity coupled with closer intergenerational contact largely negates this benefit. Mitigation strategies that slow but do not interrupt transmission will still lead to COVID-19 epidemics rapidly overwhelming health systems, with substantial excess deaths in lower-income countries resulting from the poorer health care available. Of countries that have undertaken suppression to date, lower-income countries have acted earlier. However, this will need to be maintained or triggered more frequently in these settings to keep below available health capacity, with associated detrimental consequences for the wider health, well-being, and economies of these countries.


Figures

Fig. 1
Fig. 1. Demographic, societal, and mixing patterns relevant to SARS-CoV-2 transmission and burden.
(A) Aggregated demographic patterns within 2020 World Population Prospects projections across countries within each 2018 World Bank GDP per-capita decile. (B) Average household (HH) size within Demographic Health Surveys of individuals aged 65 and over by 2018 World Bank GDP per capita. For reference, the average household size of contacts in the UK is also provided as an example for a HIC. (C) Final proportion of population infected in an unmitigated epidemic for an age-structured SIR model with R0 = 3.0 and age-specific social mixing based on contact surveys identified in HICs. (D and E) Equivalent figure for surveys identified in UMICs and LMICs/LICs, respectively. (F to I) Output from simulations across countries of an unmitigated pandemic with R0 = 3.0. (F) Attack rate in terms of number of individuals infected per 1000 population. (G) Equivalent rates of infection leading to illness requiring hospitalization. (H) Illness requiring critical care. (I) Mortality assuming a health system functioning at the level of China throughout the pandemic. LIC, low-income country; LMIC, low- and middle-income country; UMIC, upper–middle-income country HIC, high-income country.
Fig. 2
Fig. 2. Estimates of hospital bed and ICU capacity, and the potential impact of health care quality on the IFR.
(A) Comparison of BRT model prediction and empirically observed numbers of hospital beds per 1000 population. Each point represents a country, with the x axis indicating the observed number of hospital beds per 1000 population for that country and the y axis indicating the model-predicted number of hospital beds per 1000 population. Coloring of the points indicates which World Bank income strata the country belongs to. (B) Boxplots of the number of hospital beds per 1000 population, stratified by World Bank income group. Points are modeled estimates of hospital beds per 1000 population obtained from the model. (C) Results from a systematic review describing the percentage of all hospital beds that are in ICUs, stratified by World Bank income group. Error bars indicate the interquartile range of the median. (D) Age-stratified scenarios for the IFR under different health care quality. The baseline age groups are estimates based on data for high-income settings. “No MV” denotes not being able to access an ICU unit with mechanical ventilation available. “Poorer outcomes” represents a higher risk of mortality from severe pneumonia in an LMIC setting if only limited or poor-quality oxygen support is available. “No Oxygen” represents the outcomes if hospitalized patients do not receive oxygen support. The stacked bars represent the cumulative increase in IFR at each stage. Note that the final stage “No MV and No Oxygen” represents the additional IFR due to increasing mortality rates from 20% in the presence of limited or poor-quality oxygen support to 60% in the absence of any oxygen support. (E) Estimated representative IFR averaged across age groups in different settings under a range of health care quality assumptions. The differences between LIC, LMIC, UMIC, and HIC at baseline reflect the demography and social contact patterns but otherwise assume the same health care quality. Lower health care quality is not shown for UMIC and HIC as these settings are likely to have the quality of health care incorporated in the baseline estimates.
Fig. 3
Fig. 3. The prevalence of different comorbidities across income settings and the proportion of SARS-CoV-2 infections co-occurring with them.
The age distribution of comorbidities relevant as modifiers of COVID-19 disease severity was extracted from Global Burden of Disease 2017 estimates (12) and integrated with estimates of the predicted age distribution of infection in an unmitigated pandemic scenario. For (A) cardiovascular disease (CVD), (B) chronic obstructive pulmonary disease (COPD), (C) diabetes, (D) HIV/AIDS, (E) malnutrition, and (F) tuberculosis, the left heatmap shows the age distribution of these comorbidities across different income settings, expressed as the proportion of the population in that income setting that has the comorbidity. The bar charts (colored according to age group) show the number of infections per 1000 population that co-occur with the respective comorbidity.
Fig. 4
Fig. 4. The impact of health care capacity and quality on COVID-19 mortality in different settings.
(A) Representative epidemic trajectories for an unmitigated epidemic (gray line), an epidemic involving minimal social distancing (pale blue line, 20% reduction in social contacts), an epidemic involving extensive social distancing (teal, 45% reduction in social contacts), and an epidemic trajectory that involves extensive suppression (75% reduction in social contacts) followed by lifting of restrictions after 6 months, leading to resurgence (dark blue line). (B) The excess deaths associated with constraints on health care quality and quantity, including the deaths associated with a hypothetical setting with unlimited high-quality health care (green lines), settings where high-quality health care is available but limited (yellow lines), and settings where only limited, poorer-quality health care is available (orange lines). Pale lines show an unmitigated scenario, colored lines a mitigated scenario. (C) The multiple by which ICU demand exceeds capacity for each World Bank income strata for an unmitigated (gray) and mitigated (teal) epidemic. (D) The modeled IFR for different World Bank income strata under different scenarios of health care quality and quantity available, assuming a mitigated scenario in which baseline contacts are reduced by 45%. (E) The modeled deaths per million population for different World Bank income strata under different assumptions of health care quality and quantity available, assuming a mitigated scenario in which baseline contacts are reduced by 45%. Plots show medians (bars) and interquartile ranges (boxes), as well as points <1.5× the interquartile range (whiskers) and >1.5× (points) from 500 parameter draws.
Fig. 5
Fig. 5. The proportion of time that countries will need to spend in lockdown to remain within health-system critical care capacity.
Scenarios are generated using the stochastic SEIR model (see materials and methods). (A) The time period between lockdowns for a representative LIC setting, and how it varies with the extent of suppression during lockdown. Gray-shaded area denotes time period of first suppression (triggered at a threshold of 60 ICU cases per day), and brown (75% reduction) and green (85% reduction) vertical lines indicate the next time point at which suppression would be implemented (using the same threshold). (B) Time under suppression over the next 18 months for triggering thresholds of 30 (pale pink) and 500 (brighter pink) ICU cases per day, respectively. Gray-shaded areas indicate time in suppression (a 75% reduction in R0). (C) The proportion of time required to be spent in lockdown over the next 18 months as a function of the maximum ICU demand for a representative LIC, LMIC, UMIC, and HIC (colored purple lines). Colored points indicate the median ICU capacity for each of these different income strata. (D) The proportion of time required to be spent in lockdown over the next 18 months as a function of the number of deaths caused by the COVID-19 epidemic for a representative LIC, LMIC, UMIC, and HIC assuming comparable quality (but not quantity) of health care across all settings (colored purple lines), and when assuming a reduction in the quality of health care available in LICs and LMICs (red and orange dashed lines, respectively). (E) Modeled COVID-19 epidemic trajectories over the next 18 months for a representative LIC, LMIC, UMIC, and HIC where suppression is implemented at ICU incidence trigger thresholds to keep the maximum ICU demand beneath 50% of ICU capacity. The first triggering of suppression has been determined on the basis of the actual patterns of suppression timing observed across LICs, LMICs, UMICs, and HICs.

Comment in

Similar articles

Cited by

References

    1. WHO, “Coronavirus disease (COVID-19) Situation Report-127” (2020); www.who.int/docs/default-source/coronaviruse/situation-reports/20200526-....
    1. Remuzzi A., Remuzzi G., COVID-19 and Italy: What next? Lancet 395, 1225–1228 (2020). 10.1016/S0140-6736(20)30627-9 - DOI - PMC - PubMed
    1. Ginsburg A. S., Van Cleve W. C., Thompson M. I. W., English M., Oxygen and pulse oximetry in childhood pneumonia: A survey of healthcare providers in resource-limited settings. J. Trop. Pediatr. 58, 389–393 (2012). 10.1093/tropej/fmr103 - DOI - PubMed
    1. Cui J., Zhang Y., Feng Z., Influence of non-homogeneous mixing on final epidemic size in a meta-population model. J. Biol. Dyn. 13 (suppl. 1), 31–46 (2019). 10.1080/17513758.2018.1484186 - DOI - PubMed
    1. Verity R., Okell L. C., Dorigatti I., Winskill P., Whittaker C., Imai N., Cuomo-Dannenburg G., Thompson H., Walker P. G. T., Fu H., Dighe A., Griffin J. T., Baguelin M., Bhatia S., Boonyasiri A., Cori A., Cucunubá Z., FitzJohn R., Gaythorpe K., Green W., Hamlet A., Hinsley W., Laydon D., Nedjati-Gilani G., Riley S., van Elsland S., Volz E., Wang H., Wang Y., Xi X., Donnelly C. A., Ghani A. C., Ferguson N. M., Estimates of the severity of coronavirus disease 2019: A model-based analysis. Lancet Infect. Dis. 20, 669–677 (2020). 10.1016/S1473-3099(20)30243-7 - DOI - PMC - PubMed

Publication types