. 2020 Jun 12;5(48):eaba6087.
doi: 10.1126/sciimmunol.aba6087.

Single-cell transcriptomic analysis of allergen-specific T cells in allergy and asthma

Affiliations

Single-cell transcriptomic analysis of allergen-specific T cells in allergy and asthma

Grégory Seumois et al. Sci Immunol. .

Abstract

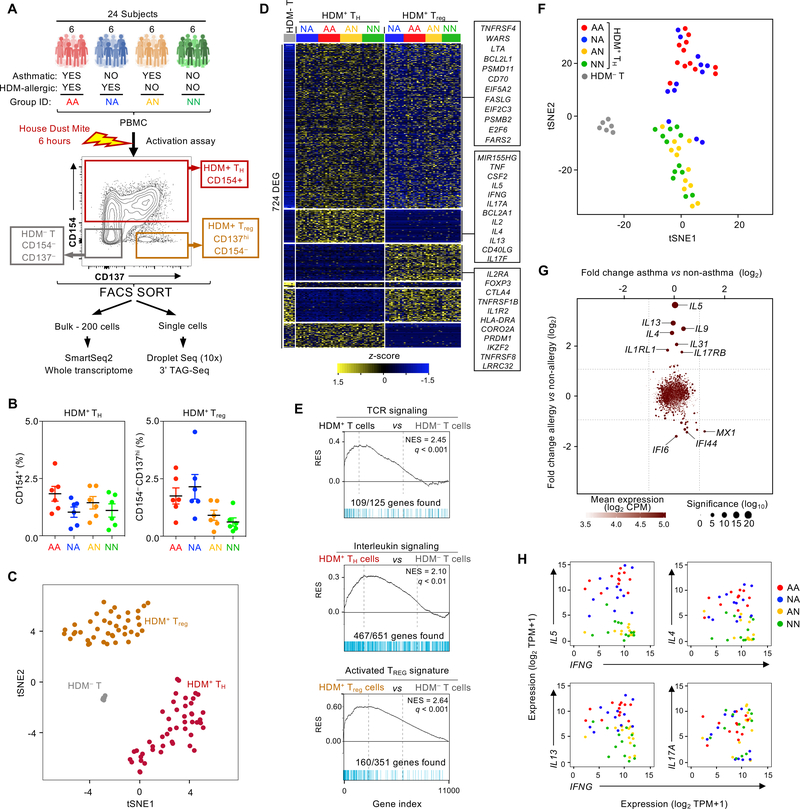
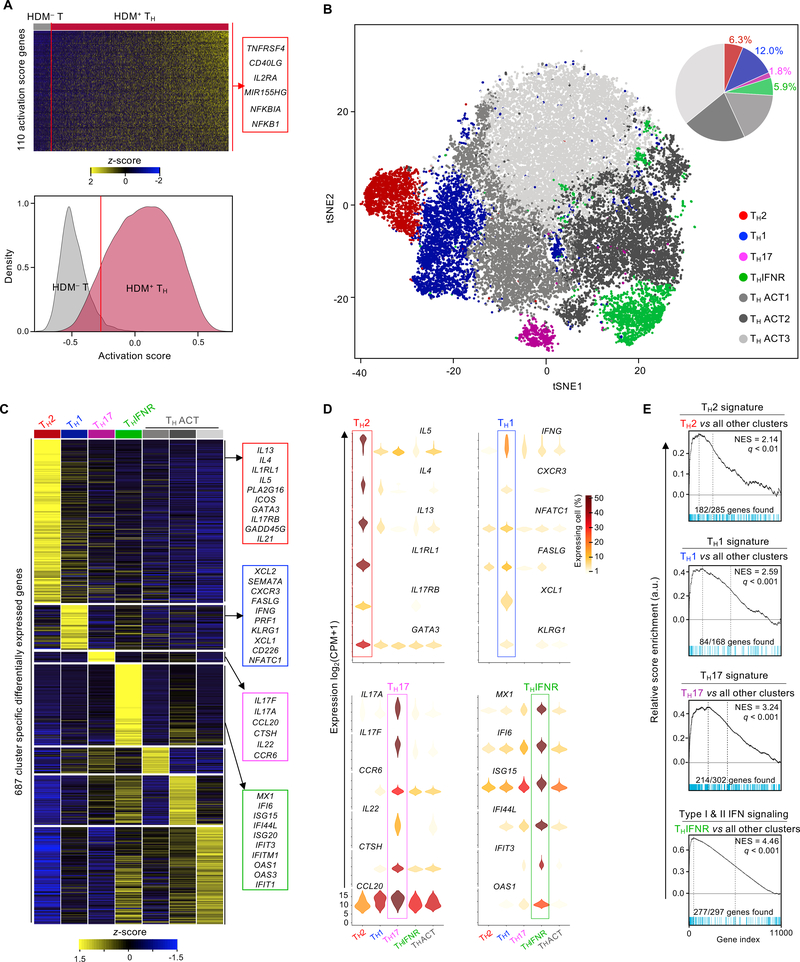
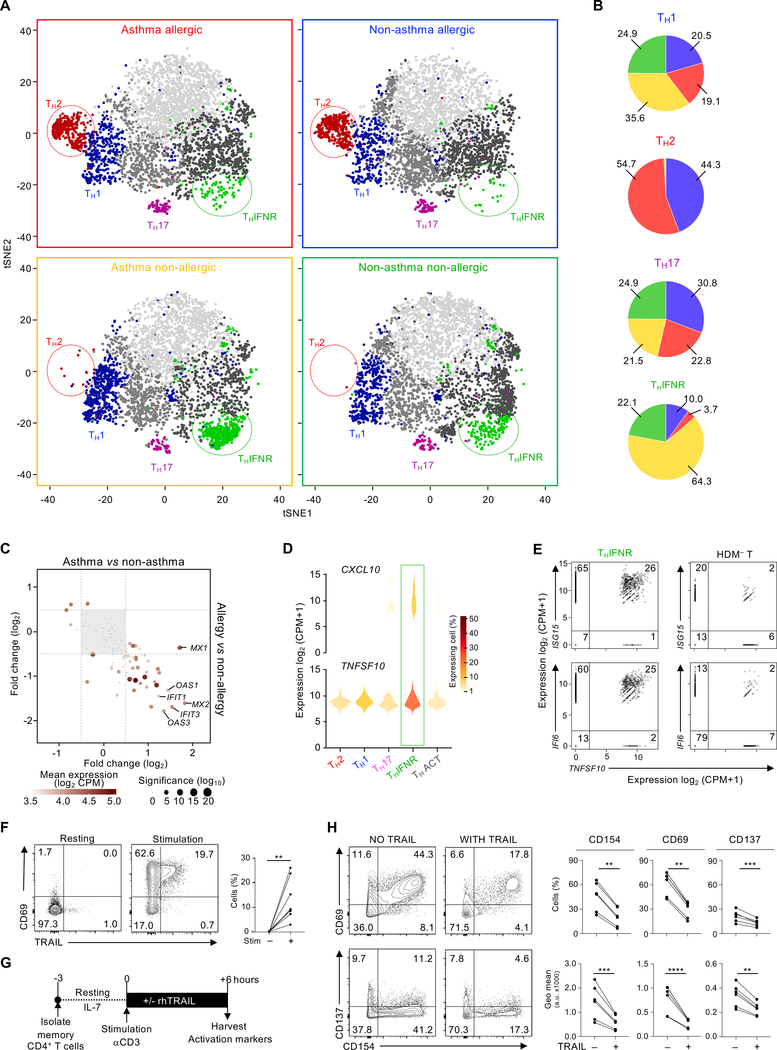
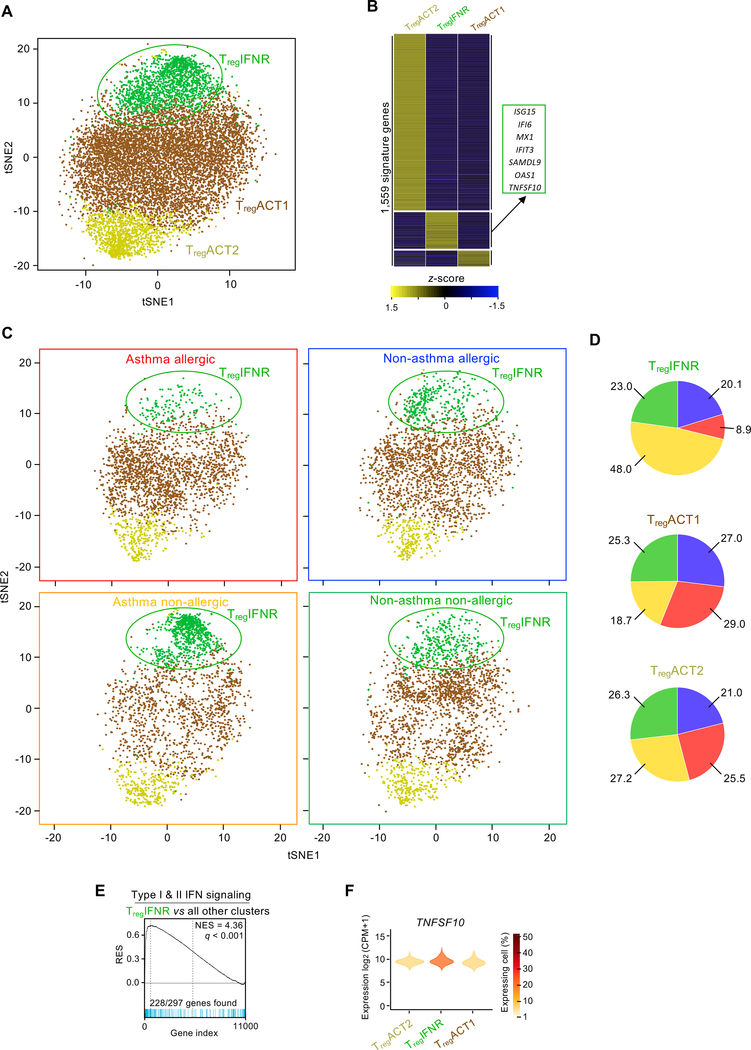
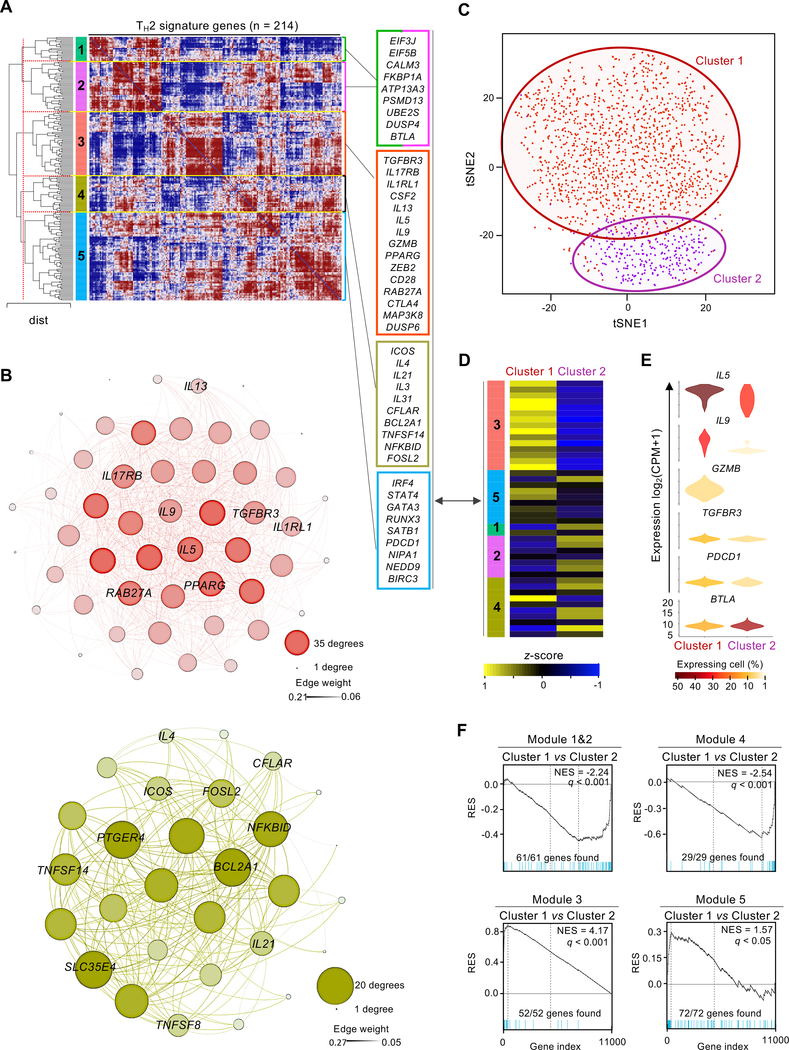
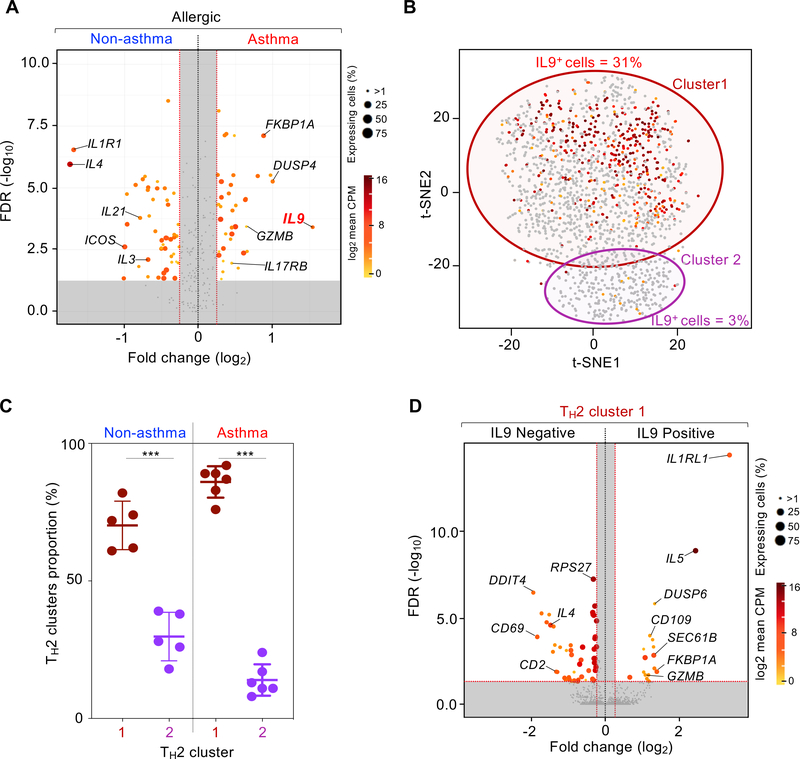
CD4+ T helper (TH) cells and regulatory T (Treg) cells that respond to common allergens play an important role in driving and dampening airway inflammation in patients with asthma. Until recently, direct, unbiased molecular analysis of allergen-reactive TH and Treg cells has not been possible. To better understand the diversity of these T cell subsets in allergy and asthma, we analyzed the single-cell transcriptome of ~50,000 house dust mite (HDM) allergen-reactive TH cells and Treg cells from asthmatics with HDM allergy and from three control groups: asthmatics without HDM allergy and nonasthmatics with and without HDM allergy. Our analyses show that HDM allergen-reactive TH and Treg cells are highly heterogeneous and certain subsets are quantitatively and qualitatively different in individuals with HDM-reactive asthma. The number of interleukin-9 (IL-9)-expressing HDM-reactive TH cells is greater in asthmatics with HDM allergy compared with nonasthmatics with HDM allergy, and this IL-9-expressing TH subset displays enhanced pathogenic properties. More HDM-reactive TH and Treg cells expressing the interferon response signature (THIFNR and TregIFNR) are present in asthmatics without HDM allergy compared with those with HDM allergy. In cells from these subsets (THIFNR and TregIFNR), expression of TNFSF10 was enriched; its product, tumor necrosis factor-related apoptosis-inducing ligand, dampens activation of TH cells. These findings suggest that the THIFNR and TregIFNR subsets may dampen allergic responses, which may help explain why only some people develop TH2 responses to nearly ubiquitous allergens.


Conflict of interest statement

Competing interests: P.V received research funding unrelated to this work from Pfizer. G.S. received a career development fellowship award from Kyowa Kirin Pharmaceutical Research Inc. to independently pursue research on IL-9 in severe asthma. P.V. and G.S. are listed as inventors on a provisional patent application covering findings reported in this manuscript. The other authors declare that they have no competing interests.

Figures

Fig. 1.
Fig. 1.
Bulk RNA-seq analysis of HDM allergen-reactive T cells does not identify asthma-specific features. (A) Schematic representation of the study summarizing the subject groups, activation assay, and sorting and sequencing strategies. (B) Dot plot showing the percentage of CD4 memory HDM-reactive T cells that were CD154+ (left) or CD154 CD137+ (right) for each subject group. Horizontal line mean; error bar, standard error. (C) t-SNE plot of bulk RNA-seq samples: 6 HDM T cells (from asthma-allergic patients), 24 HDM+ TH (from all patients), 18 HDM+ Treg (from all patients)). (D) Heatmap of row-wise z-score-normalized expression for 724 genes differentially expressed between the 3 groups of cells in Figure 1C. Each column represents data from one subject. (E) Gene set enrichment analysis (GSEA) of grouped bulk RNA-seq datasets presented in Figure 1C. q, false discovery rate; NES, normalized enrichment score; RES, relative enrichment score; list of genes provided in table S4. (F) t-SNE plot of bulk RNA-seq datasets for HDM T samples (N = 6) and TH samples colored by disease group, where each dot represents one RNA-seq data from one subject (N = 12 per group). (G) Scatter plot shows log2-fold change in expression of significantly differentially expressed genes between asthma (N = 24) versus non-asthma (N = 24) (x axis) and allergic (N = 24) versus non-allergic (N = 24) (y axis) TH samples. (H) Scatter plots show co-expression of the indicated canonical TH1 and TH2 cytokines in TH samples coded by disease group.
Fig. 2.
Fig. 2.
Single-cell RNA-seq clustering analysis reveals heterogeneity among HDM-reactive TH cells. (A) Top - heatmap of row-wise z-score-normalized expression for 110 genes used to establish the activation score (see Methods), rows are ordered by hierarchical clustering. Each column represents a single-cell RNA-seq data, ordered by activation score. Right - examples of genes included in the TH activation score. Bottom - histogram shows the density function of HDM T (N = 3,075, grey) and HDM+ TH (N = 31,105, red) cell activation scores (Methods). The red line indicates the threshold of selection (activation score of −0.27, 5 % of HDM). (B) t-SNE visualization of Seurat clustering analysis of approximately 28,313 single HDM+ TH cell transcriptomes obtained from all 24 subjects. IFNR, interferon response; ACT, biologically uncharacterized activated T cells (3 groups). Top right - pie chart shows the cell number proportion of each cluster. (C) Heatmap of row-wise z-score-normalized mean expression of cluster-specific differentially expressed genes. Columns represent the average expression for each cluster, ordered based on biological relevance. Right - lists of biologically relevant example genes for each cluster. Equal numbers of cells were sampled from each cluster. (D) Violin plots show log2 (CPM+1) normalized expression in each cluster (3 THACT clusters merged) for 24 cluster-specific signature genes (6 per cell type). Color scale represents the fraction of cells within each cluster expressing the given gene, excluding cells with no expression. (E) GSEA between each cluster and other clusters of single-cell transcriptome datasets presented in Figure 2B. q, false discovery rate; NES, normalized enrichment score; RES, relative enrichment score; list of genes provided in table S4.
Fig. 3.
Fig. 3.
Proportions of HDM-reactive TH subsets differ between allergic and non-allergic subjects. (A) t-SNE visualization of Seurat clustering analysis shown in Figure 2b, using equal cell numbers for each disease group (N = 3,720), obtained from all 6 subjects in each group. Cells are colored according to cluster as in Figure 2B. (B) Pie chart illustrating the relative proportion of cells from each disease group in the 4 biologically relevant clusters. (C) Scatter plot shows the log2-fold change of expression of THIFNR signature genes between asthmatic (N = 12) versus non-asthmatic (N = 12) (x-axis) and allergic (N = 12) versus non-allergic (N = 12) (y-axis) subjects among cells in the THIFNR cluster. Equal numbers of cells were sampled per group. Dotted lines indicate the threshold value of fold change for gene filtering. (D) Violin plots show log2(CPM+1) normalized expression of CXCL10 and TNFSF10 in each TH cluster. Cells with no expression were excluded. (E) Scatter plots show co-expression of TNFSF10 with the products of the THINFR signature genes IFI6 and ISG15 by THINFR cells (left) or HDM T cells (right). Each dot represents one cell. (F) Contour plots show the expression of CD69 versus TRAIL in memory CD4+ T cells before (left) and after 6 h (center) of TCR stimulation with anti-CD3 and anti-CD28. Both plots are representative of 5 independent experiments. Numbers indicate the percentage of cells in each quadrant. Right, quantification of each of the 6 experiments; bars represent the mean and standard error. (G) Diagram of the TRAIL functional assay. (H) Left, contour plots show the expression of the cell-activation markers CD154, CD69, and CD137 in memory CD4+ cells after 6 h of stimulation in the presence or absence of TRAIL. Data shown are from a representative experiment. Right, quantification of each of the 6 experiments; bars represent the mean and standard error. *, P < 0.1; **, P < 0.01, *** P < 0.001.
Fig. 4.
Fig. 4.
A subset of HDM-reactive Treg cells express the interferon response signature. (A) t-SNE visualization of Seurat clustering analysis of the transcriptomes of 10,526 single HDM-activated Treg cells obtained from all 24 subjects. (B) Heatmap showing hierarchical clustering of row-wise z-score-normalized mean expression of cluster-specific differentially expressed genes (N = 1,559) Columns represent each Treg cluster. Right - lists of biologically relevant examples genes for the TregIFNR cluster. Equal numbers of cells were sampled per disease group. (C) t-SNE visualization of Seurat clustering analysis shown in Figure 4A, using equal cell numbers for each subject group (n = 2,180) obtained from all 6 subjects. (D) Pie charts illustrate the relative proportion of cells from each subject group within each of the 3 Treg clusters. (E) GSEA between each TregIFNR and the 2 other Treg clusters. q, false discovery rate; NES, normalized enrichment score; RES, relative enrichment score; list of genes provided in table S4. (F) Violin plots show log2(CPM+1) normalized expression of TNFSF10 in each Treg cluster. Cells with no expression are excluded (see Materials and Methods).
Fig. 5.
Fig. 5.
HDM-reactive TH2 cells are enriched for transcripts linked to enhanced functionality. (A) Hierarchical clustering of Spearman correlation coefficient matrix for saver-imputed expression values of the 214 genes uniquely up-regulated in the TH2 cluster. Values are clustered with complete linkage. Dotted red line indicates Euclidian distance threshold value used to define the 5 modules of co-expressed genes. Right – list of example genes for each module (modules 1 and 2 merged). (B) Gephi visualization of weighted correlation network analysis (WGCNA) for genes co-expressed in modules 3 (top) and module 4 (bottom) from Figure 5A. Nodes correspond to a given gene and are sized based on the number of edges (connections); edges thickness correlates to strength degree of correlation. (C) t-SNE visualization of Seurat clustering analysis of single TH2 cluster cell transcriptomes (N = 1,751) obtained from 12 allergic subjects regardless of asthma status (red, TH2-cluster 1 (N = 1,440); purple, TH2-cluster 2 (N = 311)). Red and purple circling lines represent limits of each TH2 clusters 1 and 2, respectively. (D) Heatmap showing row-wise z-score-normalized mean expression of genes shown in Figure 5A between both TH2 sub-clusters (columns). (E) Violin plots show log2(CPM+1) normalized expression for genes biologically relevant between both TH2 sub-clusters. Color code represents the fraction of cells expressing the given gene in each TH2 sub-cluster; cells with no expression are not included. (F) GSEA between TH2 sub-clusters. Plots illustrate significative enrichment of module genes shown in Figure 5A between both TH2 sub-clusters. q, false discovery rate; NES, normalized enrichment score; RES, relative enrichment score; list of genes provided in table S4.
Fig. 6.
Fig. 6.
Asthma-specific TH2 single cells analysis. (A) Volcano plot shows statistical significance (-log10 adjusted P-value) in function of the log2-fold difference in expression for filtered genes (see Materials and Methods), when comparing expression between TH2 cells from asthma allergic (N = 6) versus non-asthma allergic (N = 6) subjects. Dots are colored accordingly to the average of expression (log2) and sized based on the fraction of cells expressing the given gene, both derived from the group in which the gene is upregulated. Equal numbers of cells where sampled in each group (N = 661). Grey dotted lines represent the threshold value for fold change (vertical, log2(|FC|) > 0.5-fold) and significance (horizontal, -log10(adjusted P-value) > 2). (B) t-SNE visualization of TH2 cluster cell transcriptomes shown in Figure 5C in which each dot is a cell is cell colored according to expression for IL9 (grey, none). Outlines represent TH2 sub-cluster limits. (C) Box and whisker plot shows percentage of TH2 cells in each sub-cluster in asthma allergic (N = 6) and non-asthma allergic (N = 5) subjects. Center line, median value; box, quartiles; whisker lines, 10th and 90th percentiles. **; P < 0.01. (D) Volcano plot similar to Figure 6A comparing expression between IL9-positive cells (N = 444) and IL9-negative cells (N = 444) in the asthma allergic TH2 cluster 1.

References

    1. Caminati M, Pham DL, Bagnasco D, Canonica GW, Type 2 immunity in asthma. World Allergy Organ J 11, 13 (2018). - PMC - PubMed
    1. Miller JD, The Role of Dust Mites in Allergy. Clin Rev Allergy Immunol 57, 312–329 (2019). - PubMed
    1. Larche M, Akdis CA, Valenta R, Immunological mechanisms of allergen-specific immunotherapy. Nat Rev Immunol 6, 761–771 (2006). - PubMed
    1. Kay AB, Allergy and allergic diseases. Second of two parts. N Engl J Med 344, 109–113 (2001). - PubMed
    1. Kay AB, Allergy and allergic diseases. First of two parts. N Engl J Med 344, 30–37 (2001). - PubMed

Publication types