. 2020 Jun 12;10(1):9536.
doi: 10.1038/s41598-020-66449-0.

The tumor immune microenvironmental analysis of 2,033 transcriptomes across 7 cancer types

Affiliations

The tumor immune microenvironmental analysis of 2,033 transcriptomes across 7 cancer types

Sungjae Kim et al. Sci Rep. .

Abstract

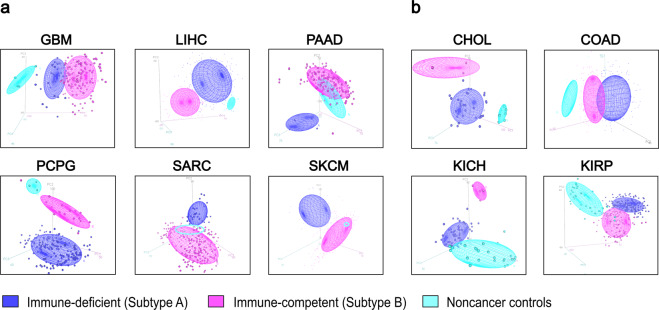
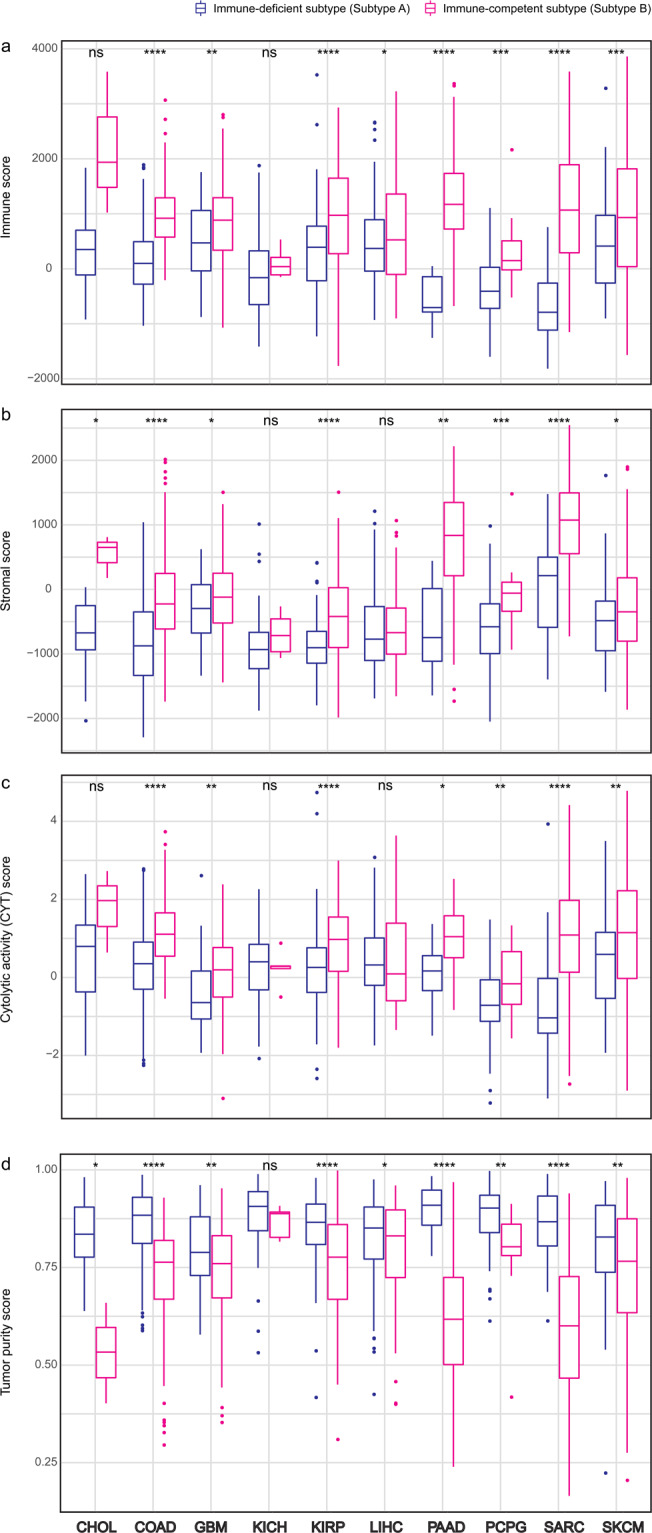
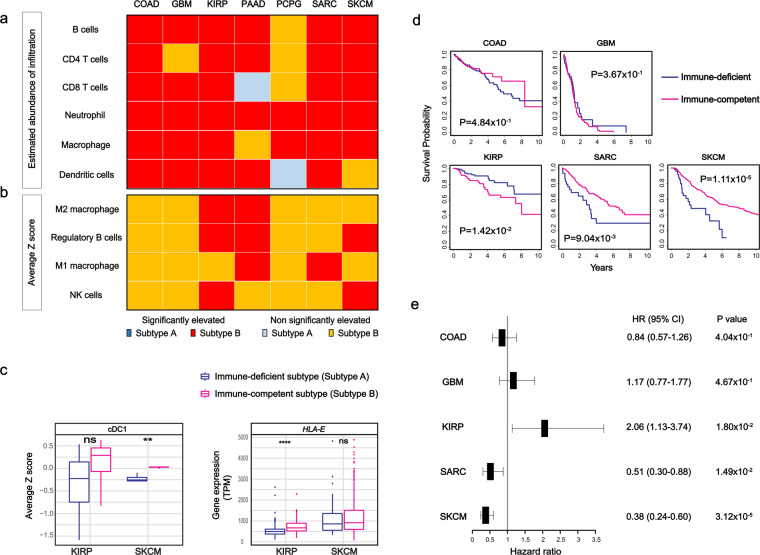
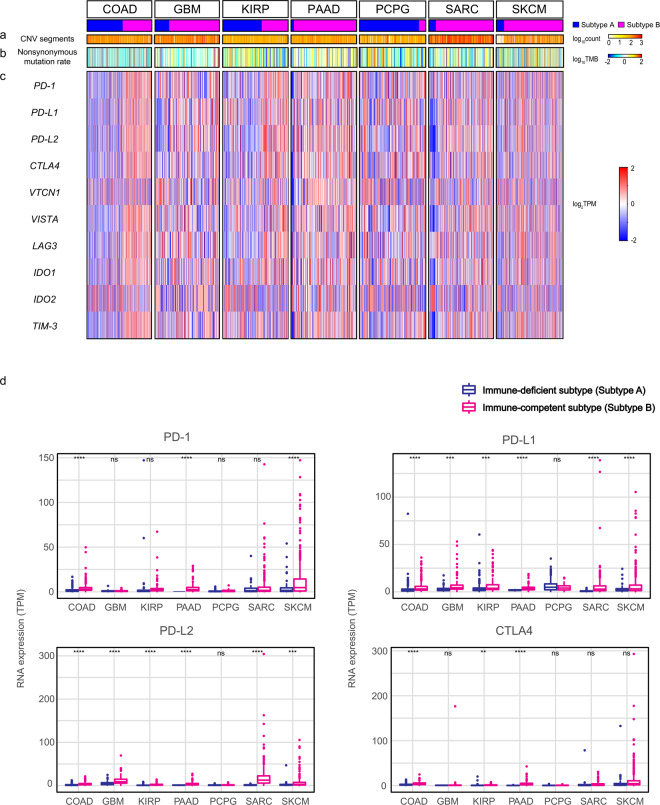
Understanding the tumor microenvironment is important to efficiently identify appropriate patients for immunotherapies in a variety of cancers. Here, we presented the tumor microenvironmental analysis of 2,033 cancer samples across 7 cancer types: colon adenocarcinoma, skin cutaneous melanoma, kidney renal papillary cell carcinoma, sarcoma, pancreatic adenocarcinoma, glioblastoma multiforme, and pheochromocytoma / paraganglioma from The Cancer Genome Atlas cohort. Unsupervised hierarchical clustering based on the gene expression profiles separated the cancer samples into two distinct clusters, and characterized those into immune-competent and immune-deficient subtypes using the estimated abundances of infiltrated immune and stromal cells. We demonstrated differential tumor microenvironmental characteristics of immune-competent subtypes across 7 cancer types, particularly immunosuppressive tumor microenvironment features in kidney renal papillary cell carcinoma with significant poorer survival rates and immune-supportive features in sarcoma and skin cutaneous melanoma. Additionally, differential genomic instability patterns between the subtypes were found across the cancer types, and discovered that immune-competent subtypes in most of cancer types had significantly higher immune checkpoint gene expressions. Overall, this study suggests that our subtyping approach based on transcriptomic data could contribute to precise prediction of immune checkpoint inhibitor responses in a wide range of cancer types.


Conflict of interest statement

The authors declare no competing interests.

Figures

Figure 1
Figure 1
Unsupervised hierarchical clustering separated cancer samples into two distinctive clusters. PCA at different number of clusters. In the plots, blue, purple and cyan represents immune-deficient (subtype A), immune-competent (subtype B) and non-cancer controls, respectively. (a), At k = 2. (b), At k = 3.
Figure 2
Figure 2
Comparison of predicted tumor microenvironmental related scores between immune subtypes across 10 cancer types. (a), Immune score. (b), Stromal score. (c), Tumor purity. (d), Cytolytic activity (CYT) score. The level of significance denoted as: ns., non-significant, *p < 0.05, **p < 0.01, ***p < 0.001 and ****p < 0.0001. Statistical significances between subtypes were measured by unpaired Student t test.
Figure 3
Figure 3
Estimated infiltration of immune cells, transcriptomic signatures for tumor microenvironment related immune cells and survival analysis of 7 cancer types. (a) Diagram of the estimated abundance of B cells, CD4+ T cells, CD8+ T cells, neutrophils, macrophages and dendritic cells inferred by TIMER were compared between the subtypes. Statistical significance was measured by Student t test. (b) Diagram showing the status of elevated expression of signature genes for M1 macrophage, M2 macrophage, regulatory B cell, and NK cell in immune-competent subtypes across 7 cancer types using the average z-scores of the genes. For subtype B, yellow color and red color squares represent elevation without and with statistical significance, respectively. For subtype A, blue color and sky blue color squares, respectively. Statistical significances between subtypes were measured by unpaired Student t test. (c) Expression pattern of NK antitumor activities in KIRP and SKCM. Average z-score for cDC1 and gene expression in TPM between the subtypes in KIRP and SKCM. ns., non-significant, *p < 0.05, **p < 0.01, ***p < 0.001 and ****p < 0.0001. Statistical significances between subtypes were measured by unpaired Student t test. d, Kaplan-Meier survival curves of COAD, GBM, KIRP, SARC and SKCM. Blue lines represent immune-deficient and magenta lines for immune-competent subtypes. Statistical significance was measured by log rank test. (e) Hazard ratio between subtypes by univariate Cox regression. Forest plot illustrates hazard ratio and 95% confidence intervals in COAD, GBM, KIRP, SARC and SKCM. Positive rates represent that subtype B is negatively associated with survival and negative rates represent that subtype A is negatively associated with survival.
Figure 4
Figure 4
Comparison of the genomic instability scores and the expressions of immune checkpoint genes between immune subtypes in 7 cancer types. (a), Comparison of the sCNV burden, measured by the log10-transformed total number of segments in each sample’s copy number profile between the subtypes across 7 cancer types. (b), Comparison of the log10-transformed the number of nonsynonymous mutations per Mb in the genome between the subtypes across 7 cancer types. (c), Heatmaps of the log2-transformed expression levels (TPM) of 10 immune checkpoint genes between the subtypes across 7 cancer types. (d), RNA expressions (TPM) of four immune checkpoint genes in immune-deficient and immune-competent subtypes across 7 cancers. The level of significance denoted as: ns., non-significant, *p < 0.05, **p < 0.01, ***p < 0.001 and ****p < 0.0001. Statistical significances of the genomic instability scores and the expression of the genes between subtypes were measured by unpaired Student t test.

References

    1. Wang M, et al. Role of tumor microenvironment in tumorigenesis. J Cancer. 2017;8:761–773. doi: 10.7150/jca.17648. - DOI - PMC - PubMed
    1. Salvatore V, et al. The tumor microenvironment promotes cancer progression and cell migration. Oncotarget. 2017;8:9608–9616. doi: 10.18632/oncotarget.14155. - DOI - PMC - PubMed
    1. Webster RM. The immune checkpoint inhibitors: where are we now? Nat Rev Drug Discov. 2014;13:883–884. doi: 10.1038/nrd4476. - DOI - PubMed
    1. Havel JJ, Chowell D, Chan TA. The evolving landscape of biomarkers for checkpoint inhibitor immunotherapy. Nat Rev Cancer. 2019;19:133–150. doi: 10.1038/s41568-019-0116-x. - DOI - PMC - PubMed
    1. Varn FS, Wang Y, Mullins DW, Fiering S, Cheng C. Systematic Pan-Cancer Analysis Reveals Immune Cell Interactions in the Tumor Microenvironment. Cancer Res. 2017;77:1271–1282. doi: 10.1158/0008-5472.CAN-16-2490. - DOI - PMC - PubMed