. 2020 Jun 12;3(1):305.
doi: 10.1038/s42003-020-1027-9.

Met-Flow, a strategy for single-cell metabolic analysis highlights dynamic changes in immune subpopulations

Affiliations

Met-Flow, a strategy for single-cell metabolic analysis highlights dynamic changes in immune subpopulations

Patricia J Ahl et al. Commun Biol. .

Abstract

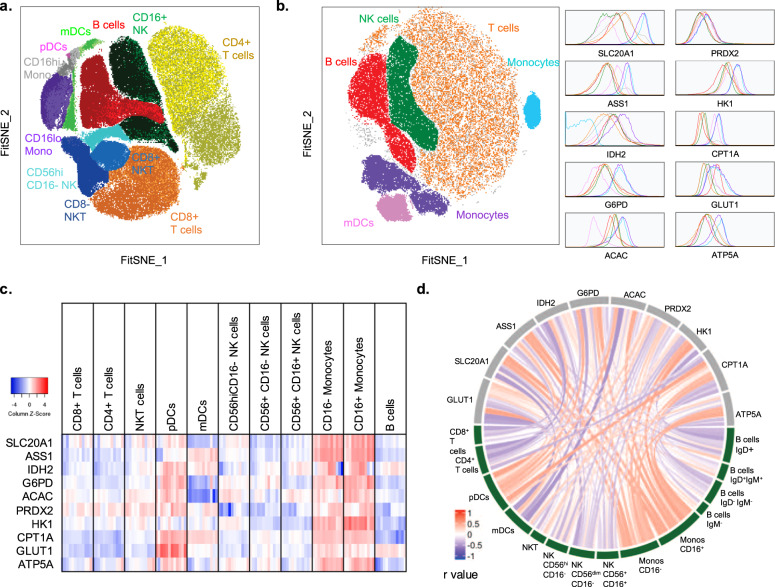
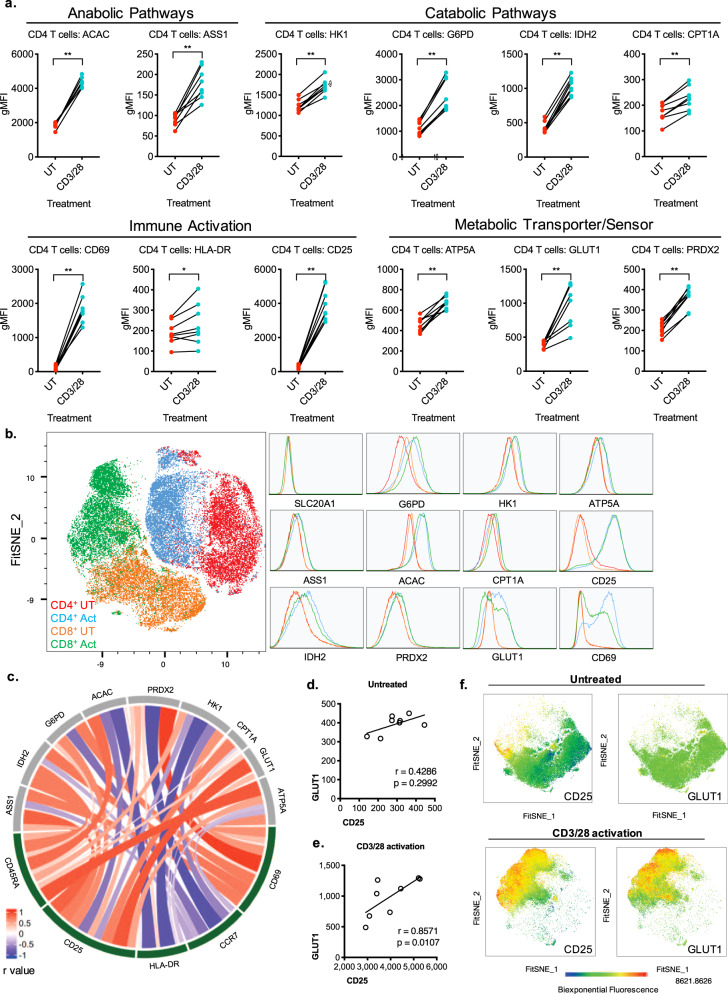
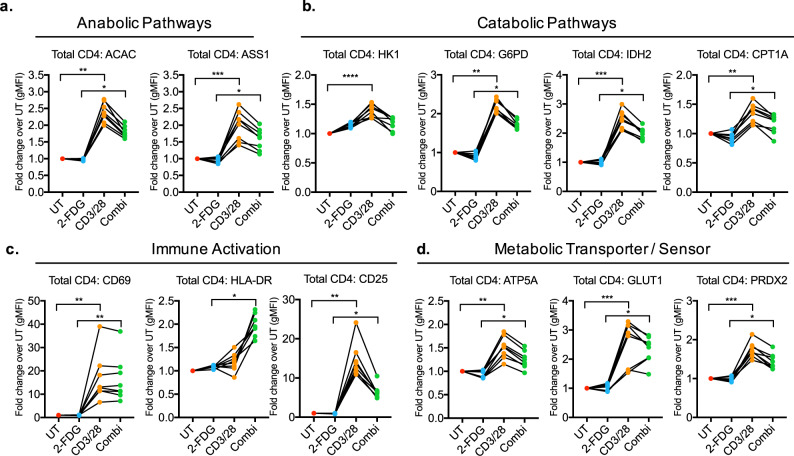
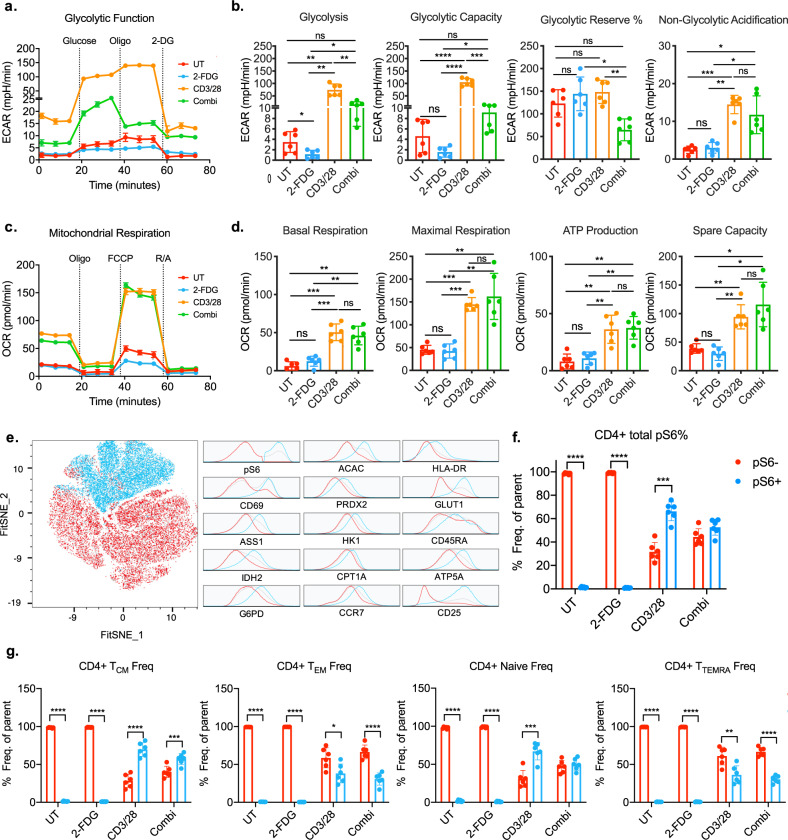
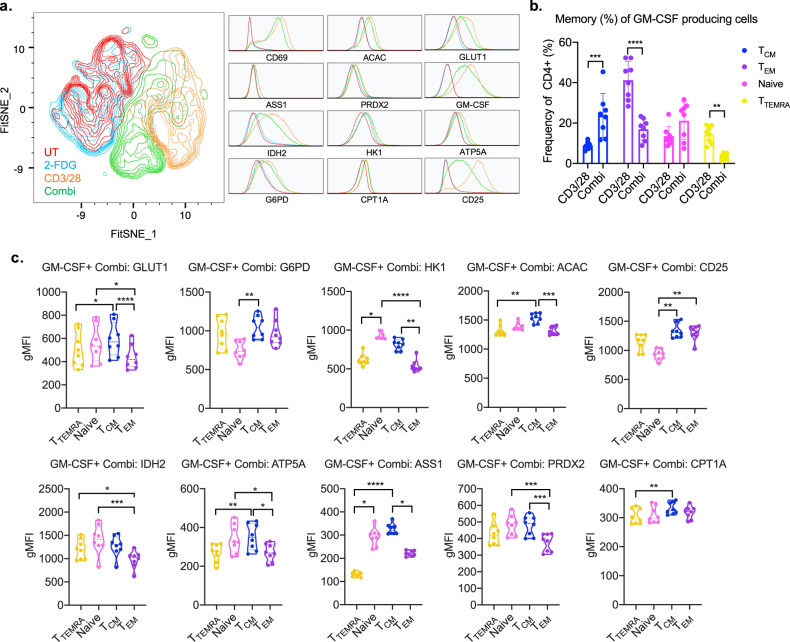
A complex interaction of anabolic and catabolic metabolism underpins the ability of leukocytes to mount an immune response. Their capacity to respond to changing environments by metabolic reprogramming is crucial to effector function. However, current methods lack the ability to interrogate this network of metabolic pathways at single-cell level within a heterogeneous population. We present Met-Flow, a flow cytometry-based method capturing the metabolic state of immune cells by targeting key proteins and rate-limiting enzymes across multiple pathways. We demonstrate the ability to simultaneously measure divergent metabolic profiles and dynamic remodeling in human peripheral blood mononuclear cells. Using Met-Flow, we discovered that glucose restriction and metabolic remodeling drive the expansion of an inflammatory central memory T cell subset. This method captures the complex metabolic state of any cell as it relates to phenotype and function, leading to a greater understanding of the role of metabolic heterogeneity in immune responses.


Conflict of interest statement

The authors R.A.H. and W.W.X. declare no competing non-financial interests, but the following competing financial interests; R.A.H. and W.W.X. are employed at Tessa Therapeutics Pte Ltd. The remaining authors P.J.A., B.A., N.K., A.M.F., and J.E.C. declare no competing financial or non-financial interests.

Figures

Fig. 1
Fig. 1. Protein-level analysis shows divergent metabolic profiles in leukocytes.
a FitSNE projection of both phenotypic and metabolic proteins, and b FitSNE projection of metabolic proteins only, with corresponding expression of each population, representing n = 12 samples from four independent experiments. c gMFI expression (log2) of each immune cell type (n = 12). d Chord visualization using spearman correlation between metabolic protein and immune phenotype. A positive correlation is presented in red, a negative correlation is presented in blue based on the r value (n = 9).
Fig. 2
Fig. 2. Activation induces extensive metabolic reprogramming in T cells.
Purified T cells were untreated (UT) or activated with anti-CD3/CD28 beads (CD3/28). a Geometric mean fluorescence intensity (gMFI) was measured for activation and metabolic proteins in CD4+ T cells. Each dot represents one donor, data representative of n = 8 donors, from three independent experiments. b FitSNE projection and corresponding expression of metabolic protein and activation markers in T cells, data acquired from n = 5 samples, with 10,000 cells per donor. c Chord visualization of correlation between immune and metabolic proteins in activated CD4+ T cells, representative of n = 8 donors. d Spearman correlation of GLUT1 and CD25 expression in untreated and e activated CD4+ T cells. f Heatmap of FitSNE projection of GLUT1 and CD25 expression in untreated and activated CD4+ T cells.
Fig. 3
Fig. 3. The activation and metabolic states of CD4+ T cells are altered by glycolytic inhibition.
Fold change of metabolic protein and activation markers (gMFI) was measured in CD4+ T cells untreated (UT), with 2-FDG, CD3/28, and combination of 2-FDG with CD3/28 (Combi). Metabolic proteins are grouped by a anabolic pathways, including fatty-acid synthesis and arginine metabolism, and b catabolic pathways, including glycolysis, oxidative PPP, TCA cycle, and fatty-acid oxidation. c Activation markers and d the ATP synthase protein critical for OXPHOS, glucose transporter, and the antioxidant protein were measured. Each dot represents one donor sample, total n = 8 donors from three independent experiments.
Fig. 4
Fig. 4. T-cell memory subsets differentially respond to glycolytic inhibition.
a FitSNE projection of resting state CD4+ memory populations, data represent n = 5 donor samples. b Metabolic protein expression of resting state CD4+ memory subsets by gMFI, data represent n = 8 donor samples. c Gating strategy of CD4+ memory subsets by CCR7 and CD45RA. d Cell count of CD4+ T memory populations across treatments. e FitSNE of CD4+ CM populations across treatments, data represent five donor samples from two independent experiments, with 20,000 cells per samples.
Fig. 5
Fig. 5. Respiration and mTOR signaling increase with T-cell activation.
a Glycolytic function across untreated (UT), 2-FDG treated, CD3/28 activated, and combination treated (2-FDG+CD3/28) donor samples. Graph depicts one representative sample from a single donor. b Glycolytic parameters measured by extracellular acidification rate (ECAR) across treatments. c Mitochondrial respiration measured by oxygen consumption rate (OCR) in purified T cells across treatments and its associated d mitochondrial parameters. Respiration data represent n = 6 donor samples from two independent experiments. Statistical analysis was performed using one-way ANOVA with Tukey’s multiple comparisons test. e CD4+ T cells phosphorylation status of phospho-S6 (pS6) and respective levels of metabolic and activation markers. Data shown represent n = 6 by FitSNE analysis. f Phosphorylation status across different treatments in total CD4+ T cells. g Phosphorylation status across memory subsets with treatment. Statistical analysis was performed using multiple t test and Holm-Sidak multiple comparisons.
Fig. 6
Fig. 6. Glucose restriction and metabolic remodeling drive the expansion of inflammatory memory T subpopulation.
a FitSNE projection of GM-CSF producing total CD4+ T cells. b Comparison of activation and combi (CD3/28+2-FDG) treated memory subset frequency. c Differential expression of metabolic proteins across T-cell memory subsets with glycolytic inhibition during CD3/28 activation (combi). All data represents n = 8 donors, and statistical analysis was performed using T test or Friedman’s test with Dunn’s multiple comparisons.

References

    1. Chang C-H, et al. Posttranscriptional control of T cell effector function by aerobic glycolysis. Cell. 2013;153:1239–1251. - PMC - PubMed
    1. Jones, N. et al. Akt and STAT5 mediate naive human CD4+ T-cell early metabolic response to TCR stimulation. Nat. Commun.10, 20–42 (2019). - PMC - PubMed
    1. Everts B, et al. TLR-driven early glycolytic reprogramming via the kinases TBK1-IKKɛ supports the anabolic demands of dendritic cell activation. Nat. Immunol. 2014;15:323–332. - PMC - PubMed
    1. Gotoh K, et al. Mitochondrial p32/C1qbp is a critical regulator of dendritic cell metabolism and maturation. Cell Rep. 2018;25:1800–1815.e4. - PubMed
    1. Krawczyk CM, et al. Toll-like receptor-induced changes in glycolytic metabolism regulate dendritic cell activation. Blood. 2010;115:4742–4749. - PMC - PubMed

Publication types

MeSH terms