Review
. 2020 Sep;21(9):526-540.
doi: 10.1038/s41576-020-0244-x. Epub 2020 Jun 12.

A decade of advances in transposon-insertion sequencing

Affiliations
Review

A decade of advances in transposon-insertion sequencing

Amy K Cain et al. Nat Rev Genet. 2020 Sep.

Abstract

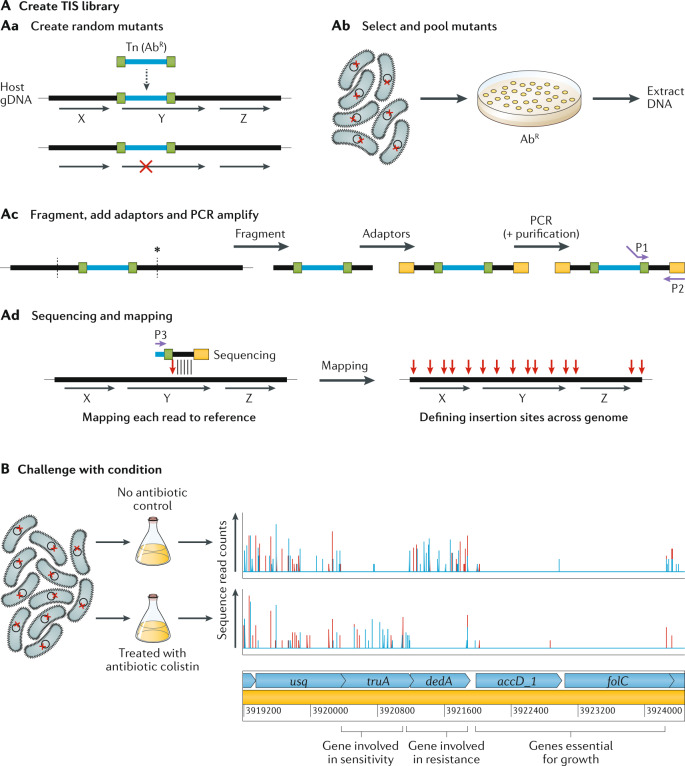
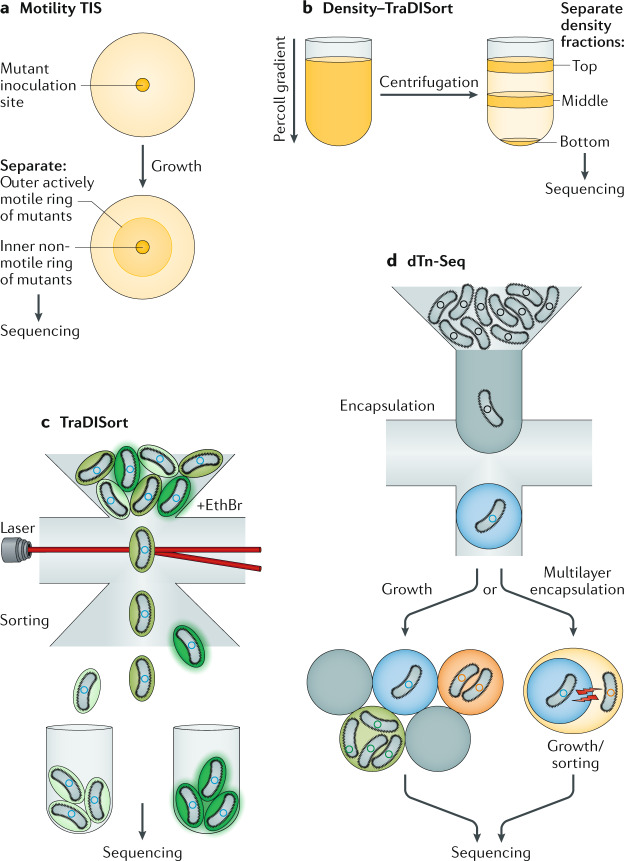
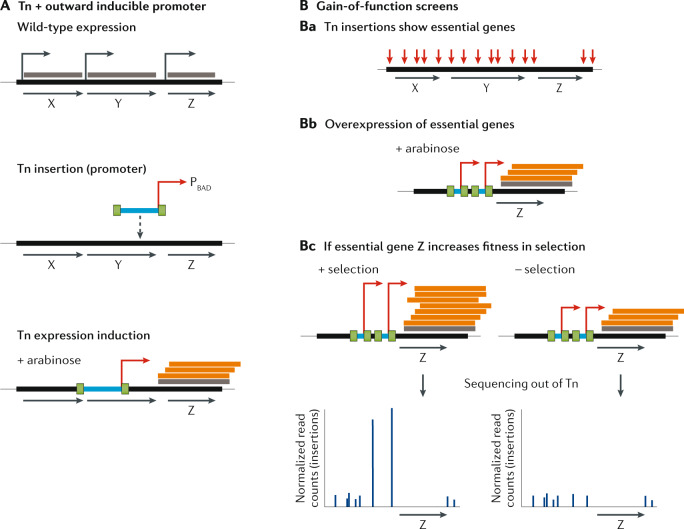
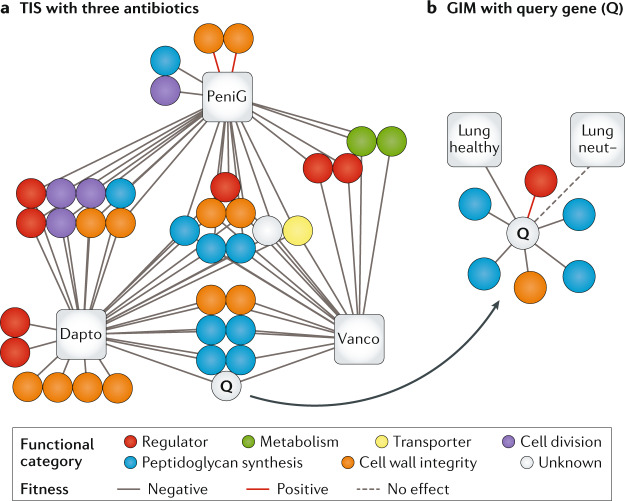
It has been 10 years since the introduction of modern transposon-insertion sequencing (TIS) methods, which combine genome-wide transposon mutagenesis with high-throughput sequencing to estimate the fitness contribution or essentiality of each genetic component in a bacterial genome. Four TIS variations were published in 2009: transposon sequencing (Tn-Seq), transposon-directed insertion site sequencing (TraDIS), insertion sequencing (INSeq) and high-throughput insertion tracking by deep sequencing (HITS). TIS has since become an important tool for molecular microbiologists, being one of the few genome-wide techniques that directly links phenotype to genotype and ultimately can assign gene function. In this Review, we discuss the recent applications of TIS to answer overarching biological questions. We explore emerging and multidisciplinary methods that build on TIS, with an eye towards future applications.


Conflict of interest statement

The authors declare no competing interests.

Figures

Fig. 1
Fig. 1. Basic TIS method overview.
A | Creation of the transposon-insertion sequencing (TIS) library has four steps. The first is to create random transposon (Tn) mutants (part Aa). The horizontal black lines and arrows represent the host’s genomic DNA (gDNA) and the coding regions of genes are marked ‘X’, ‘Y’ and ‘Z’. The horizontal blue line is the transposon containing an antibiotic resistance (AbR) selection marker and bounded by inverted repeats, shown in green. When the transposon inserts itself into the gDNA, the disruption in a gene (gene Y in this example) is shown by a red cross. The second step is to select and pool mutants (part Ab). The red cross represents a single mutation in each cell; these cells are selected, for instance on antibiotic-containing agar plates, and pooled and DNA is extracted. The third step is fragmentation, addition of adaptors and PCR amplification (part Ac). Fragmentation (vertical dashed lines) can be enzymatic or by shearing (depending on the version of TIS). Sequencing adaptors (yellow rectangles) are then added, and primers (purple arrows) P1 and P2 are used for PCR amplification. Step 4 is sequencing and mapping (part Ad). Sequences out from the transposon end (using primer P3) are mapped onto the reference genome and the transposon insertion point is determined (vertical red arrow) and mapped for each mutant. Genes that cannot tolerate insertions (gene Z in this example) will not have any TIS reads mapped. B | Challenging the TIS library — in this example with an antibiotic, colistin (bottom row), compared with an untreated control (top row) (data from ref.). The vertical lines denote the density of insertions at each insertion site, and red and blue denote forward or reverse insertion direction, respectively. Below are the predicted genes, in light blue. The first gene (usq) has equivalent numbers of insertions in the treated and untreated samples and thus has no effect on fitness in colistin. The next gene (truA) has relatively more insertions in the treated sample compared with the control (its mutants have increased fitness in colistin) and thus is considered a sensitivity gene. The next gene (dedA) is an experimentally confirmed resistance gene and it has decreased insertions in the treated sample (mutants have decreased fitness in colistin). The last two genes (accD_1 and folC) have no insertions in either the treated sample or the untreated sample and are thus considered essential for growth.
Fig. 2
Fig. 2. Extensions to the TIS method.
a | Physical separation of mutant populations based on motility. This includes assaying genes for motility by inoculating transposon-insertion sequencing (TIS) mutants on an agar plate (yellow circle and beige spot) and separating the inner mutant pool (less motile) from the outer mutant pool (more motile). b | In density–TraDISort, mutant populations can be separated into top, middle and bottom fractions (shown by horizontal orange bands) on the basis of their increased or decreased cellular density using a Percoll gradient and centrifugation. c | Separation of single mutants using fluorescence (TraDISort). The mutant pool is treated with the fluorescent marker ethidium bromide (EthBr) and subjected to fluorescence-activated cell sorting, where each cell is sorted with use of a laser (horizontal red line) on the basis of its fluorescence (shown as green), reporting on efflux activity. d | Encapsulation, growth and sorting with microfluidics of single mutants in droplets for droplet transposon sequencing (dTn-Seq). Each single mutant with different growth rates (in the schematic on the left, low, medium and high levels of growth are represented as blue, orange and green background colours, respectively) will grow independently within its own droplet (grey circle), eliminating the effects of interactions between mutants. A final sorting step, based on cell fluorescence or microscopy, can also be added. Alternatively, cell-containing droplets (blue droplet on the right) can undergo multiple layers of re-encapsulation, so that an encapsulated mutant can be encapsulated within another droplet containing a different cell (shown in yellow; this can be another mutant, another bacterial cell or a host cell) and signals can freely diffuse between the layers (shown as red bolts) to allow cell interactions to be investigated by sorting those cell combinations that have altered fitness and grow at different rates, or those that can be separated by sorting based on markers, such as alterations of cell morphology observed with a microscope.
Fig. 3
Fig. 3. TIS to assay the functions of essential genes.
A | An inducible promoter (right-angled red arrow), such as PBAD, is positioned facing out of each transposon (Tn) to overexpress all genes, including essential genes, so that their function can be assayed. Orange bars indicate transposon-induced transcription on top of wild-type expression (grey bars). B | In traditional transposon-insertion sequencing (TIS) approaches, essential genes can be identified as those that cannot tolerate insertions (part Ba). In gain-of-function screens, when transposons in the transposon pool are induced, for example with arabinose (part Bb), high expression of essential gene Z is achieved. When selection is applied, involvement of essential genes in the condition can now be assayed (part Bc) by monitoring relative differences in the number of transposons that influence expression levels. In this example, after exposure to the condition and sequencing out of the transposon, an increase in the number of transposon insertions that increase gene Z’s expression is observed. Therefore, mutants that overexpress gene Z have increased fitness within the overall population during selection, indicating that gene Z’s expression is beneficial in that condition. All other features are as in Fig. 1.
Fig. 4
Fig. 4. Mapping complex genotype–phenotype relationships.
a | A gene–antibiotic network for three antibiotics (based on refs,). Each node (circle) depicts a gene, whereas each edge indicates a negative (solid grey line), neutral (dashed grey line) or positive (solid red line) effect on fitness between the genes in the presence of antibiotics as determined by transposon-insertion sequencing (TIS). All three antibiotics — penicillin G (PeniG), vancomycin (Vanco) and daptomycin (Dapto) — affect cell wall integrity but TIS uncovers a wide variety of genes involved, many of which are not direct targets of the antibiotic. In this case, the unknown gene Q is likely to be involved in peptidoglycan synthesis/membrane integrity on the basis of the function of other genes with similar fitness profiles. b | By mutation of gene Q and construction of a transposon library in this mutant background, genetic interactions can be identified (based on concepts from ref.). In this case, the genes uncovered in the mutant background, as depicted in the gene interaction map (GIM), further support a role in peptidoglycan synthesis, that it may function in the cell membrane and that it may be controlled by a particular regulator. Additionally, in vivo TIS data with the mutant library performed in healthy mice and mice depleted of neutrophils (neut−) indicate that gene Q is needed to establish lung infection but is dispensable in the absence of neutrophils. Adapted from ref., CC BY 4.0 (https://creativecommons.org/licenses/by/4.0/).
Fig. 5
Fig. 5. Bottleneck and realism trade-off in TIS infection models.
Different animal models of infection (top) can induce strong bottleneck effects (bottom) in infecting bacterial populations, which can confound transposon-insertion sequencing (TIS) analysis. This bottleneck effect is particularly pronounced in models where bacteria must overcome barrier defences (for example oral infection models of Salmonella enterica subsp. enterica serovar Typhimurium). Organoid models can provide a complex environment while limiting bottlenecks, but technical limitations in culture may limit the total population size screened. Finally, cell culture screens can be scaled to arbitrary sizes, allowing screening of extremely large collections of mutants, but they often provide insight into only a particular aspect of disease.
Fig. 6
Fig. 6. TIS to assay microorganism–microorganism interactions.
a | Transposon-insertion sequencing (TIS) of Staphylococcus aureus (SA) mutants alone (orange circles) compared with coculture of SA and Pseudomonas aeruginosa (PA) wild-type strain (green rods) can identify community-dependent essential genes that are needed only during coculture. Other features are as in Fig. 1. b | Using TIS to identify type VI secretion system (T6SS) toxin immunity pairs by growing cells with close cell-to-cell contact, and performing TIS so that genes involved in protection of T6SS-depending killing (depicted as a yellow bolt) can be detected. In this example, genes in PA encoding immunity proteins (Tsi; orange diamond) that protect from neighbour killing by toxins (Tse; red square) become essential only in a T6SS-active (retS; bottom panel) background but not in the inactive (H1_retS; top panel) cellular background.
Fig. 7
Fig. 7. Integrating TIS with RNA-seq data.
A | An example of combining RNA sequencing (RNA-seq; depicted in green throughout) and transposon-insertion sequencing (TIS; depicted in red throughout) to identify antagonistic interactions between the antibiotics polymyxin B (PolyB) and gentamicin (Gent) or tobramycin (Tobr) in Pseudomonas aeruginosa. TIS data indicate that genes mexY and mexX are involved in intrinsic resistance in P. aeruginosa to gentamicin and tobramycin, indicated by the red edges between the antibiotics and the genes. When these genes are disrupted by a transposon insertion, the bacterium becomes more sensitive to these antibiotics. Moreover, RNA-seq data reveal that polymyxin B induces expression of these genes, as indicated by the green arrows. This led to the hypothesis that polymyxin B, owing to its transcriptional activation of mexY and mexX, will make the bacterium less sensitive to either gentamycin or tobramycin. The study authors confirmed experimentally that these antibiotics work in an antagonistic manner, which highlights the strength of probing response networks from different perspectives to extract biological meaning. B | Measurement of TIS and RNA-seq responses under the same conditions (part Ba) has shown that the transcriptional responses to a specific environment (Δ expression) are often not accurate predictors of gene deletion phenotypes, as expression and fitness do not correlate well (Δ fitness; part Bb). However, by overlaying these datasets over a known network (for example, a metabolic network; part Bc), network analyses can identify patterns between TIS and RNA-seq. In this example a small part of a metabolic network is depicted; grey circles are metabolites and arrows are genes encoding enzymes that mediate each reaction. Red arrows are phenotypically important genes in a specific environment identified by TIS, whereas green arrows are genes that change transcriptionally in the same environment, identified by RNA-seq. The distance between two genes in a metabolic network is the number of reactions between them, and can be calculated for all pairs across the network. In part Bd, the left network is an example where distances between pairs of fitness and expression changes are small, whereas the right network illustrates larger distances. An adapted response to an environment is characterized by fitness and expression changes that are relatively small (distance to neighbour) and correlated (Δ fitness × expression). Exposure to stress conditions to which a bacterium is not adapted leads to a loss in correlation between genes that change in transcription and those have a fitness effect (part Bd). Importantly, such associations can be used to make predictions on antibiotic susceptibility. Part B is adapted with permission from ref., Elsevier.

References

    1. van Opijnen T, Bodi KL, Camilli A. Tn-seq: high-throughput parallel sequencing for fitness and genetic interaction studies in microorganisms. Nat. Methods. 2009;6:767–772. - PMC - PubMed
    1. Langridge GC, et al. Simultaneous assay of every Salmonella Typhi gene using one million transposon mutants. Genome Res. 2009;19:2308–2316. - PMC - PubMed
    1. Goodman AL, et al. Identifying genetic determinants needed to establish a human gut symbiont in its habitat. Cell Host Microbe. 2009;6:279–289. - PMC - PubMed
    1. Gawronski JD, et al. Tracking insertion mutants within libraries by deep sequencing and a genome-wide screen for Haemophilus genes required in the lung. Proc. Natl Acad. Sci. USA. 2009;106:16422–16427. - PMC - PubMed
    1. van Opijnen T, Camilli A. Transposon insertion sequencing: a new tool for systems-level analysis of microorganisms. Nat. Rev. Microbiol. 2013;11:435–442. - PMC - PubMed

Publication types

Substances