

Altered gut bacterial-fungal interkingdom networks in patients with current depressive episode
- PMID: 32533650
- PMCID: PMC7428472
- DOI: 10.1002/brb3.1677
Altered gut bacterial-fungal interkingdom networks in patients with current depressive episode
Abstract
Introduction: Bacterial dysbiosis has been described in patients with current depressive episode (CDE); however, the fungal composition in the gut has not been investigated in these patients.
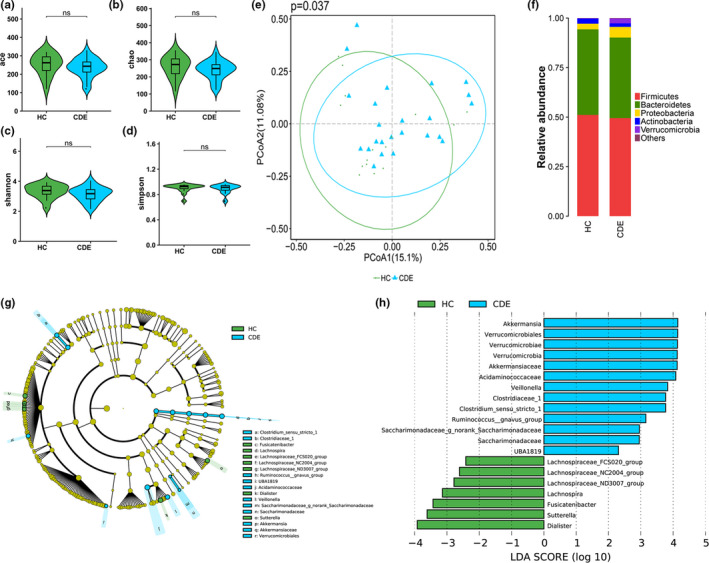
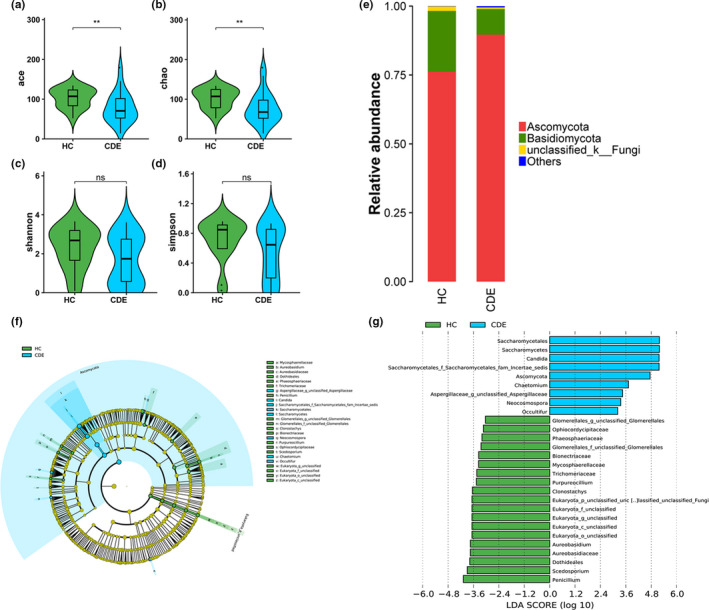
Methods: Here, we characterized the fungal gut mycobiota in patients with CDE. We systematically characterized the microbiota and mycobiota in fecal samples obtained from 24 patients with CDE and 16 healthy controls (HC) using 16S rRNA gene- and ITS1-based DNA sequencing, respectively.
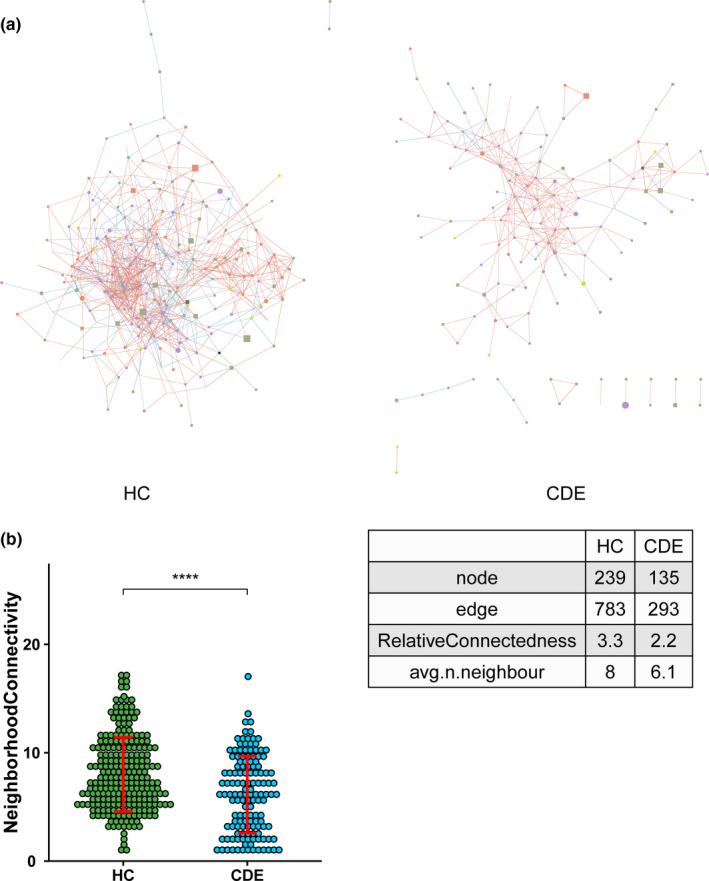
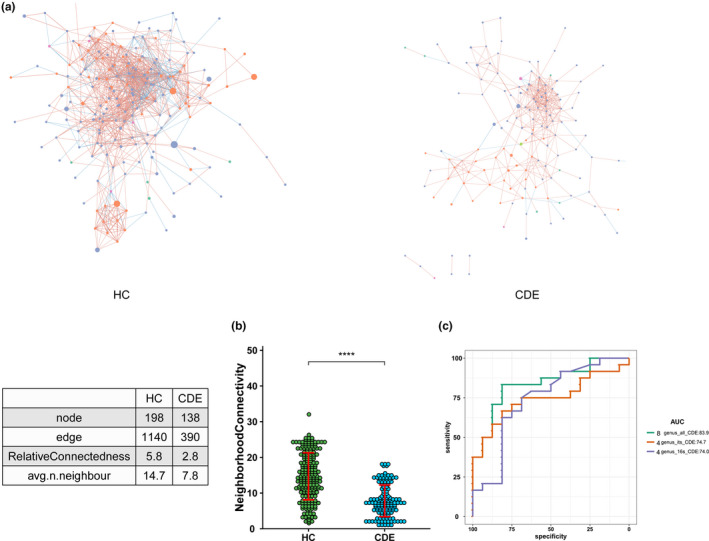
Results: In patients with CDE, bacterial dysbiosis was characterized by an altered composition and reduced correlation network density, and the gut mycobiota was characterized by a relative reduction in alpha diversity and altered composition. Most notably, the CDE group had higher levels of Candida and lower level of Penicillium than the HC group. Compared with the HC group, the gut microbiota in patients with CDE displayed a significant disruption in the bacteria-fungi correlation network suggestive of altered interkingdom interactions. Furthermore, a gut microbial index based on the combination of eight genera (four bacterial and four fungal CDE-associated genera) distinguished CDE patients from controls with an area under the curve of approximately 0.84, suggesting that the gut microbiome signature is a promising tool for disease classification.
Conclusions: Our findings suggest that both bacteria and fungi contribute to gut dysbiosis in patients with CDE. Future studies involving larger cohorts and metagenomic or metabolomic analyses may clarify the structure and potential roles and functions of the gut mycobiome and its impact on the development of CDE.
Keywords: dysbiosis; fungi; gut microbiota-brain; mental.
© 2020 The Authors. Brain and Behavior published by Wiley Periodicals LLC.
Conflict of interest statement
The authors declare that they have no competing interests. The funders had no role in study design, data collection, and analysis, decision to publish, or preparation of the manuscript.
Figures
Similar articles
-
Analysis of gut mycobiota in first-episode, drug-naïve Chinese patients with schizophrenia: A pilot study.Behav Brain Res. 2020 Feb 3;379:112374. doi: 10.1016/j.bbr.2019.112374. Epub 2019 Nov 20. Behav Brain Res. 2020. PMID: 31759045
-
Gut fungal dysbiosis and altered bacterial-fungal interaction in patients with diarrhea-predominant irritable bowel syndrome: An explorative study.Neurogastroenterol Motil. 2020 Nov;32(11):e13891. doi: 10.1111/nmo.13891. Epub 2020 May 25. Neurogastroenterol Motil. 2020. PMID: 32449259
-
Gut Mycobiota Dysbiosis in Pulmonary Tuberculosis Patients Undergoing Anti-Tuberculosis Treatment.Microbiol Spectr. 2021 Dec 22;9(3):e0061521. doi: 10.1128/spectrum.00615-21. Epub 2021 Dec 15. Microbiol Spectr. 2021. PMID: 34908436 Free PMC article.
-
Diabetic foot exacerbates gut mycobiome dysbiosis in adult patients with type 2 diabetes mellitus: revealing diagnostic markers.Nutr Diabetes. 2024 Sep 3;14(1):71. doi: 10.1038/s41387-024-00328-9. Nutr Diabetes. 2024. PMID: 39223127 Free PMC article. Review.
-
Gut Mycobiota and Fungal Metabolites in Human Homeostasis.Curr Drug Targets. 2019;20(2):232-240. doi: 10.2174/1389450119666180724125020. Curr Drug Targets. 2019. PMID: 30047327 Review.
Cited by
-
Cognitive-Behavioural Correlates of Dysbiosis: A Review.Int J Mol Sci. 2020 Jul 8;21(14):4834. doi: 10.3390/ijms21144834. Int J Mol Sci. 2020. PMID: 32650553 Free PMC article. Review.
-
Molecular Biomarkers for Pediatric Depressive Disorders: A Narrative Review.Int J Mol Sci. 2021 Sep 17;22(18):10051. doi: 10.3390/ijms221810051. Int J Mol Sci. 2021. PMID: 34576215 Free PMC article. Review.
-
Perturbations in Gut Microbiota Composition in Psychiatric Disorders: A Review and Meta-analysis.JAMA Psychiatry. 2021 Dec 1;78(12):1343-1354. doi: 10.1001/jamapsychiatry.2021.2573. JAMA Psychiatry. 2021. PMID: 34524405 Free PMC article.
-
Gut mycobiome and neuropsychiatric disorders: insights and therapeutic potential.Front Cell Neurosci. 2025 Jan 8;18:1495224. doi: 10.3389/fncel.2024.1495224. eCollection 2024. Front Cell Neurosci. 2025. PMID: 39845646 Free PMC article. Review.
-
Supplementation with Lactobacillus helveticus NS8 alleviated behavioral, neural, endocrine, and microbiota abnormalities in an endogenous rat model of depression.Front Immunol. 2024 Sep 13;15:1407620. doi: 10.3389/fimmu.2024.1407620. eCollection 2024. Front Immunol. 2024. PMID: 39346901 Free PMC article.
References
-
- Anhe, F. F. , Roy, D. , Pilon, G. , Dudonne, S. , Matamoros, S. , Varin, T. V. , … Marette, A. (2015). A polyphenol‐rich cranberry extract protects from diet‐induced obesity, insulin resistance and intestinal inflammation in association with increased Akkermansia spp. population in the gut microbiota of mice. Gut, 64(6), 872–883. 10.1136/gutjnl-2014-307142 - DOI - PubMed
-
- Botschuijver, S. , Roeselers, G. , Levin, E. , Jonkers, D. M. , Welting, O. , Heinsbroek, S. E. M. , … van den Wijngaard, R. M. (2017). Intestinal fungal dysbiosis is associated with visceral hypersensitivity in patients with irritable bowel syndrome and rats. Gastroenterology, 153(4), 1026–1039. 10.1053/j.gastro.2017.06.004 - DOI - PubMed
Publication types
MeSH terms
Substances
Grants and funding
LinkOut - more resources
Full Text Sources
