. 2020 Jul 23;182(2):463-480.e30.
doi: 10.1016/j.cell.2020.05.037. Epub 2020 Jun 12.

Determinants of Base Editing Outcomes from Target Library Analysis and Machine Learning

Affiliations

Determinants of Base Editing Outcomes from Target Library Analysis and Machine Learning

Mandana Arbab et al. Cell. .

Abstract

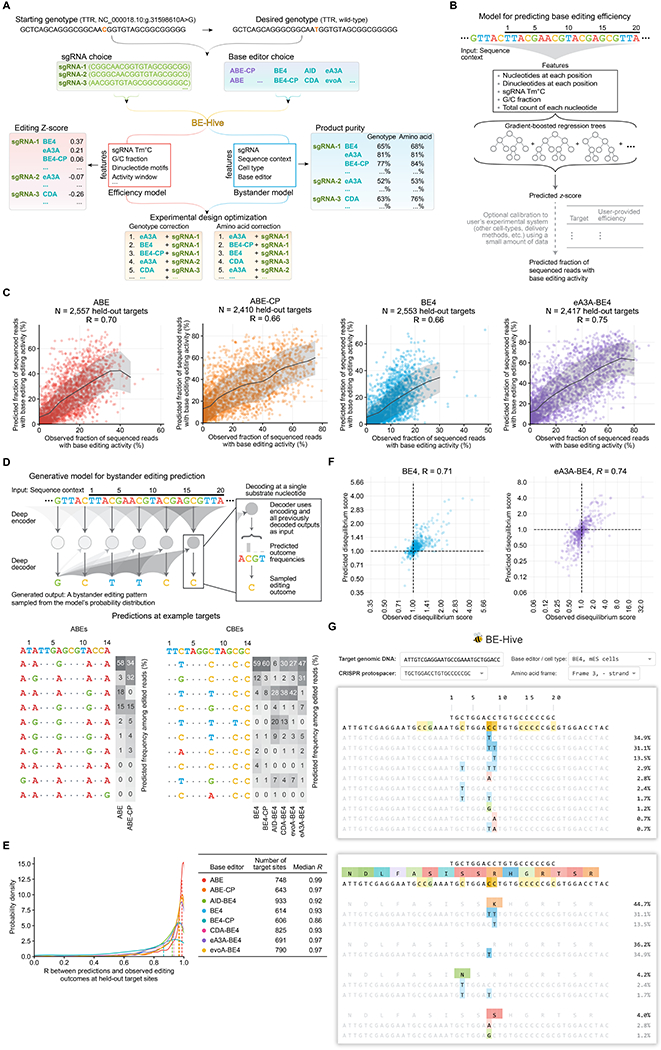
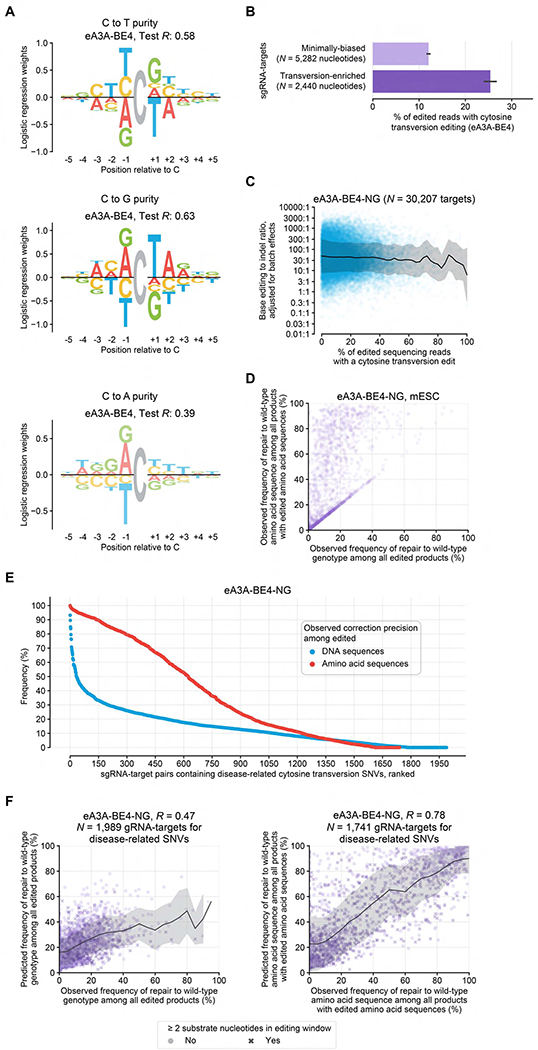
Although base editors are widely used to install targeted point mutations, the factors that determine base editing outcomes are not well understood. We characterized sequence-activity relationships of 11 cytosine and adenine base editors (CBEs and ABEs) on 38,538 genomically integrated targets in mammalian cells and used the resulting outcomes to train BE-Hive, a machine learning model that accurately predicts base editing genotypic outcomes (R ≈ 0.9) and efficiency (R ≈ 0.7). We corrected 3,388 disease-associated SNVs with ≥90% precision, including 675 alleles with bystander nucleotides that BE-Hive correctly predicted would not be edited. We discovered determinants of previously unpredictable C-to-G, or C-to-A editing and used these discoveries to correct coding sequences of 174 pathogenic transversion SNVs with ≥90% precision. Finally, we used insights from BE-Hive to engineer novel CBE variants that modulate editing outcomes. These discoveries illuminate base editing, enable editing at previously intractable targets, and provide new base editors with improved editing capabilities.

Keywords: base editing; disease correction; machine learning; precision genome editing; transversion base editing.


Conflict of interest statement

Declaration of Interests D.R.L. is a consultant and co-founder of Beam Therapeutics, Prime Medicine, Editas Medicine, and Pairwise Plants, companies that use genome editing technologies. The authors have filed a patent application on aspects of this work.

Figures

Figure 1
Figure 1. Systematic Characterization of Base Editing Activity at Thousands of Target Sites
(A) Overview of genome-integrated target library assay. Pairs of thousands of sgRNAs and corresponding target sites are integrated into mammalian cells and treated with base editors. Edited cells are enriched by antibiotic selection, and library cassettes are amplified for high-throughput sequencing. (B) Base editor activity profiles. Values reflect editing efficiencies of the outcomes specified at the bottom of each heat map, normalized to a maximum of 100, at the protospacer positions shown at each row. Red indicates canonical base editing activity (C to T for CBEs and A to G for ABEs), blue indicates other mutation activity at the canonical substrate nucleotide (C for CBEs and A for ABEs), and gray indicates other rare mutations. Positions with values ≥50% of maximum are outlined and ≥30% of maximum are shaded purple.
Figure 2
Figure 2. Sequence Motifs for Base Editing Outcomes and Characterization of Indels
(A-D) Sequence motifs for various base editing activities from logistic regression models. The sign of each learned weight indicates a contribution above (positive sign) or below (negative sign) the mean activity. Logo opacity is proportional to the motif’s Pearson’s R or AUC on held-out sequence contexts. (E) Heat map of indel frequencies among edited reads by position and length. Frequencies are normalized (divided) by indel length. (F) Heat map of insertion frequencies among all insertions by insert length and number of repeats. (G) Base editing:indel ratio distributions. The table lists geometric mean and interquartile range (IQR).
Figure 3
Figure 3. BE-Hive: Machine Learning Models of Base Editing Efficiency and Outcomes
(A) Decision tree for base editing experiment design. See also Table S1. (B) Model design for predicting base editing efficiency z-scores which are approximately normally distributed. (C) Comparison of predicted versus observed base editing efficiency at held-out target sites. (D) Design of a deep conditional autoregressive model, a general approach for learning bystander base editing patterns from experimental data. Given a target sequence, sgRNA, base editor, and cell-type, the model can be queried with any possible editing outcome to predict its frequency among edited reads. Tables show predicted outcomes at an example target site across eight different base editors. (E) Bystander editing model performance at N ≥614 held-out target sites. (F) Comparison of predicted versus observed disequilibrium scores, which reflect the tendency of substrate nucleotide pairs to be edited together or separately. (G) The web application for BE-Hive, which predicts the frequency of bystander editing patterns in the DNA sequence (top) or translated amino acid sequence (bottom). The web application also predicts base editing efficiency (not shown).
Figure 4
Figure 4. Precise Base Editing Correction of Pathogenic Alleles
(A) Comparison of predicted versus observed correction precision of disease-related SNVs in mES cells. Trend lines and shading show the rolling mean and standard deviation. (B-H) Observed frequency of correcting disease-related SNVs to wild-type among edited reads. See also Table S2–3. (B) Disease-related SNVs with at least two substrate nucleotides, or any number of substrate nucleotides, in the editing window of each base editor. Error bars depict standard error of the mean. Distribution plot depicts the protospacer positions of SNVs. (C) Disease-related SNVs with bystander nucleotides in the editing window of each base editor. (D) Disease-related SNVs positioned at C6 with no other bystander nucleotides in the editing window and edited by BE4 in mES cells. (E and F) Disease-related SNVs edited by BE4 (E) and ABE (F). Scatter plots compare predicted to observed correction precisions. B = C, G, or T; and D = A, G, or T. (G and H) Disease-related SNVs corrected by various base editors. Scatter plots compare observed to predicted correction precisions. D = A, G, or T.
Figure 5
Figure 5. Sequence Determinants of CBE-Mediated Transversions
(A) Sequence motifs for the purity of C editing to A, G, and T. Logo opacity is proportional to the motif’s Pearson’s R or AUC on held-out sequence contexts. (B) Comparison of average cytosine transversion product purity in mES cells at minimally biased targets versus targets predicted by BE-Hive to be enriched for transversion edits. Error bars depict the standard error of the mean. (C) Relationship between BE:indel ratio and cytosine transversion purity in mES cells. (D) Relationship between correction precision among edited genotypes and edited amino acid sequences in mES cells. (E) Observed correction precision of disease-related transversion SNVs among edited DNA (blue) or edited amino acid sequences (red) in mES cells. See also Table S4. (F) Comparison of predicted versus observed correction precision of disease-related transversion mutations by cytosine base editing among edited DNA (left) or edited amino acid sequences (right) in mES cells. In C and F, trend lines and shading show the rolling mean and standard deviation, respectively.
Figure 6
Figure 6. Mutations to Conserved APOBEC Residues Increase Cytosine Transversion Purity
(A) Evolutionary tree of adenine and cytosine deaminase families. (B) Structural alignment of AID, A3A and homology model of the APOBEC1 deaminase domains (Theseus). Arrows show amino acids homologous to T27 or S38 in AID. (C) Comparison of average transversion purity by eA3A-BE4 and mutant variants and target sequence groups. Error bars show the standard error of the mean. (D) Comparison of average editing efficiency between eA3A-BE4 and mutant variants. Error bars depict standard error of the mean. (E) Correction precision of disease-related transversion SNVs among edited DNA (blue) or edited amino acid sequences (red) in mES cells. See also Table S4. (F) Comparison of predicted versus observed correction precision of disease-related transversion mutations by cytosine base editing among edited DNA (left) or edited amino acid sequences (right) in mES cells. Trend lines and shading show the rolling mean and standard deviation.
Figure 7
Figure 7. Mutations to Conserved APOBEC Residues Increase CBE Product Purity
(A-H) Characterization of EA-BE4 compared to BE4 (A-D) and eA3A-BE5 compared to eA3A-BE4 (EH). (A and E) Comparison of transversion frequency by base editor variants with mutations at conserved deaminase residues in BE4 and eA3A-BE4. Error bars depict standard error of the mean. In (A), * P < 0.02; ** P = 2.0×10⁻⁶, N = 3,636 and 1,208 substrate nucleotides. 95% CI: 18-35% reduction. In (E), * P < 0.07; ** P = 2.5×10⁻⁵, Welch’s T-test, N = 1,837 and 685 substrate nucleotides. 95% CI: 17-36% reduction. (B and F) Base editor mutation activity profiles in HEK293T cells, depicted as in Figure 1. (C and G) Sequence motif for base editing efficiency in HEK293T cells. (D and h) Comparison of base editing efficiency between BE4 and EA-BE4, and between eA3A-BE4 and eA3A-BE5. Error bars depict the standard error of the mean. (I) Pareto frontier showing the tradeoff between cytosine transversion purity and editing window size by base editor. Scatter plot densities show bootstrap samples of the mean. Single-nucleotide base editing precision was simulated by choosing the substrate nucleotide closest to the position with maximum base editing efficiency as the target substrate. The distribution plot shows the position of target nucleotides used in the simulated precision task.

Comment in

References

    1. Adli M (2018). The CRISPR tool kit for genome editing and beyond. Nat. Commun 9, 1911. - PMC - PubMed
    1. Adolph MB, Love RP, Feng Y, and Chelico L (2017). Enzyme cycling contributes to efficient induction of genome mutagenesis by the cytidine deaminase APOBEC3B. Nucleic Acids Res. 45, 11925–11940. - PMC - PubMed
    1. Allen F, Crepaldi L, Alsinet C, Strong AJ, Kleshchevnikov V, De Angeli P, Páleníková P, Khodak A, Kiselev V, Kosicki M, et al. (2019). Predicting the mutations generated by repair of Cas9-induced double-strand breaks. Nat. Biotechnol 37, 64–82. - PMC - PubMed
    1. Anzalone AV, Randolph PB, Davis JR, Sousa AA, Koblan LW, Levy JM, Chen PJ, Wilson C, Newby GA, Raguram A, et al. (2019). Search-and-replace genome editing without double-strand breaks or donor DNA. Nature. - PMC - PubMed
    1. Arbab M, Srinivasan S, Hashimoto T, Geijsen N, and Sherwood RI (2015). Cloning-free CRISPR. Stem Cell Rep. 5, 1–10. - PMC - PubMed

Publication types