Review
. 2020 Aug;125(8):738-753.
doi: 10.1007/s11547-020-01236-5. Epub 2020 Jun 13.

The lung ultrasound: facts or artifacts? In the era of COVID-19 outbreak

Affiliations
Review

The lung ultrasound: facts or artifacts? In the era of COVID-19 outbreak

Marco Di Serafino et al. Radiol Med. 2020 Aug.

Abstract

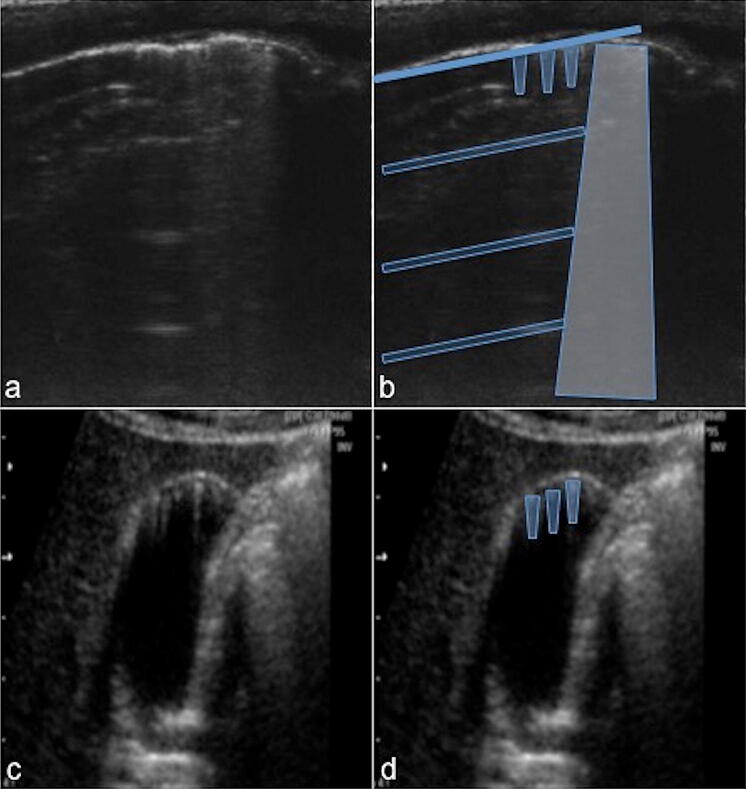
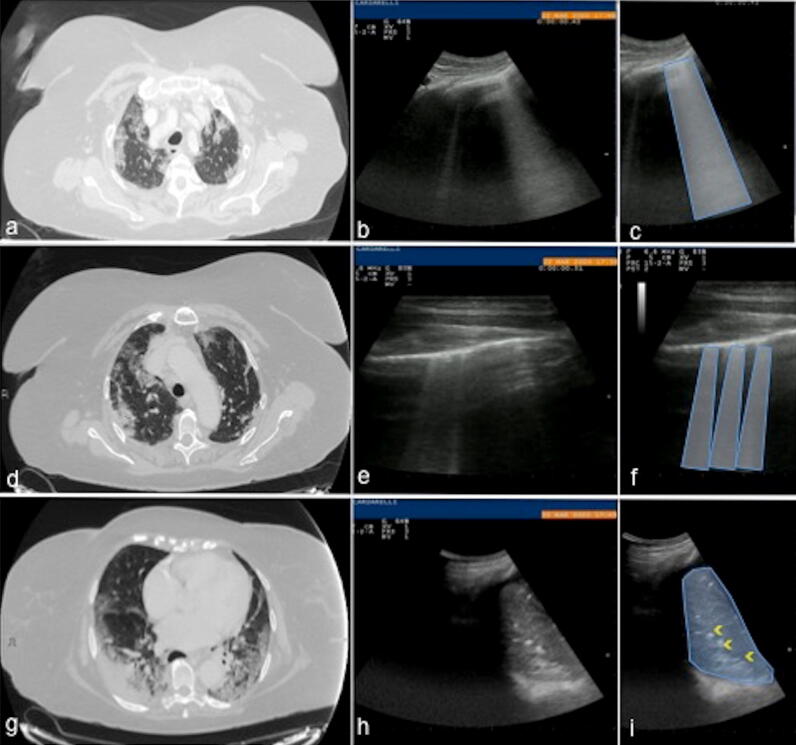
Ultrasound is the most disruptive innovation in intensive care life, above all in this time, with a high diagnostic value when applied appropriately. In recent years, point-of-care lung ultrasound has gained significant popularity as a diagnostic tool in the acutely dyspnoeic patients. In the era of Sars-CoV-2 outbreak, lung ultrasound seems to be strongly adapting to the follow-up for lung involvement of patients with ascertaining infections, till to be used, in our opinion emblematically, as a screening test in suspected patients at the emergency triage or at home medical visit. In this brief review, we discuss the lung ultrasound dichotomy, certainties and uncertainties, describing its potential role in validated clinical contexts, as a clinical-dependent exam, its limits and pitfalls in a generic and off-label clinical context, as a virtual anatomical-dependent exam, and its effects on the clinical management of patients with COVID-19.

Keywords: COVID-19; Dyspnoea; Lung ultrasound; Point of care ultrasound; Sars-CoV-2.


Conflict of interest statement

The Authors declare that they have no conflict of interest.

Figures

Fig. 1
Fig. 1
Schematic representation of the chest ultrasound zone (a) and chest ultrasound examination performed with a high-frequency linear probe (15–7 MHz) (b, c). 8 zones of the chest—4 on each side (2 anterior and 2 lateral) (a): the anterior zones (1, 2, 5, 6) are delimited medially by the hemi-clavicular line and laterally by the anterior axillary line whereas the lateral ones (3, 4, 7, 8) are included between the anterior and posterior axillary lines. The sub-mammary line divides the upper and lower zones. Thoracic anatomy, longitudinal view acquired with linear probe (b), and schematic representation (c): there is a good anatomical definition of the pleural hyperechoic reflection (pleural line, c) between the two ribs (c, 1) and their shadow cone artifacts (c, 2). They outline an area of sub-pleural pulmonary artifacts (c, 3). The cutaneous (c, 4), subcutaneous (c, 5) and muscular planes (c, 6) are well represented
Fig. 2
Fig. 2
Lung ultrasound examination performed with a high-frequency linear probe (15–7 MHz) in healthy adults (ad), longitudinal view. A-lines (a) with schematic representation (b): there is a good anatomical definition of the pleural hyperechoic reflection (b thickened blue line) with evidence of multiple horizontal reverberation artifacts or A-lines (b, transparent blue boxes) parallel to the hyperechoic “pleural line” and equidistant between them. B-lines (c) with schematic representation (d): multiple hyperechogenic linear structures or ring-down artifacts (c) come from the hyperechoic pleural line (d thickened blue line) caudally for several cm (d blue vertical trapezoids)
Fig. 3
Fig. 3
Chest ultrasound examination performed with a high-frequency linear probe (15–7 MHz) in an adult patient with heart failure (ad). Up to 3 B-lines (a) with schematic representation (b) in an interstitial congestive heart failure: multiple hyperechoic linear structures or ring-down artifacts (a) in a septal rockets configuration come from the hyperechoic pleural line (b thickened blue line) caudally for several cm (b blue vertical trapezoids). Many B-lines (c) with schematic representation (d) in an alveolar-interstitial congestive heart failure (same patient as before at follow-up): multiple hyperechogenic linear structures or ring-down artifacts (c) in a ground-glass rockets configuration come from the hyperechoic pleural line (d thickened blue line) caudally for several cm (d blue vertical trapezoids)
Fig. 4
Fig. 4
Integrated ultrasound (a, c) and chest X-ray (b) with schematic representation (d, e, f) of an elderly patient admitted for acute decompensated heart failure: the opacity at the right base on chest X-ray (b, e—blue area) corresponds to a pleural effusion on lung ultrasound (a, d—blue area); a ground-glass rockets configuration (c, f—blue vertical trapezoid; pleural line: thickened blue line) was also observed in all lung fields (b, e). The blue box (e) represents a detail of the lung ultrasound scan (c, f), with the probe longitudinally placed. The integrated imaging orients for interstitial-alveolar oedema
Fig. 5
Fig. 5
Chest ultrasound examination performed with a low-frequency convex probe (5–10 MHz). Consolidative area (a) with schematic representation (b) in bacterial pneumonia: the tissue like sign (b blue area) with hyperechoic spots inside (b yellow arrowheads)
Fig. 6
Fig. 6
Lung field of view on CT (a) compared with ultrasound (b). The blue box (a) schematizes the ultrasound field of view (b) in relation to the CT
Fig. 7
Fig. 7
Chest ultrasound convex multi-frequency probe (a) with schematic representation (b) of inferior right lobar pneumonia: inhomogeneous consolidation adhered to the pleura (blue area, b) with infected pleural effusion (circled area, b). Enhanced chest CT (c, mediastinal window) clearly demonstrates drainage tube with a better visualization of the pleural effusion and extensive right lobar consolidation with air and fluid bronchogram in context
Fig. 8
Fig. 8
Chest ultrasound examination performed with a high-frequency linear probe (15–7 MHz). Z-line (a) and B-line (c) with schematic representation (bd) in two different healthy patient (a, c): hyperechogenic linear structures (a arrow) come from the hyperechoic pleural line (b thickened blue line) caudally for few cm (b transparent blue vertical trapezoid) without deleting the A-lines (b transparent blue box). Otherwise, the B-lines extend deeper than Z-line (d blue vertical trapezoid) and deletes the A-lines (d transparent blue box)
Fig. 9
Fig. 9
Chest ultrasound linear multi-frequency probe (a) and convex multi-frequency probe (b) with schematic representation (c, d) in patient affected by miliary tuberculosis: marked irregularity and notched appearance of pleural line (cd irregular thickened blue line) with multiple B-lines (cd blue vertical trapezoids) that realize a non-specific pattern. Chest CT (e lung window) clearly demonstrates multiple very small nodules in both lungs in a patient with miliary tuberculosis
Fig. 10
Fig. 10
Chest ultrasound linear multi-frequency probe (a) and convex multi-frequency probe (b) with schematic representation (c, d) in patient affected by chronic hypersensitivity pneumonia (CHP): marked irregularity and thickened appearance of pleural line (c, d irregular thickened blue line) with multiple B lines (c, d blue vertical trapezoid) with a “coalescence” appearances that realizes a non-specific pattern. Chest CT (e lung window) shows the ‘headcheese pattern’ in CHP. Ground-glass opacities (high-attenuation areas) are simultaneously highlighted together with less affected parenchyma (low-attenuation areas). It is also visible thickening of the interlobular septa in subpleural space. The imaging pattern reflects variable lung attenuation that results in a heterogeneous appearance of the parenchyma
Fig. 11
Fig. 11
Chest ultrasound linear multi-frequency probe (a, b) with schematic representation (c, d) and chest X-ray (e) in patient affected by respiratory distress syndrome: on the left (a) inhomogeneous consolidation (c transparent blue areas) adhered to the pleura with multiple B-lines in “coalescence aspect” (c circled area); on the right (b) multiple small consolidation (d blue areas) closely connected to the pleura in aspiration pneumonia (milk) with shred sign (d circled area). Chest X-ray shows extensive opacity in right lower filed (e blue box) related to aspiration pneumonia (milk) in Down syndrome
Fig. 12
Fig. 12
Chest ultrasound examination performed with a high-frequency linear probe (15–7 MHz). Pneumothorax (a) with schematic representation (b): normal pleural lung sliding (double heads thickened arrow) with B-lines (b blue vertical trapezoids) and a lung point (b bolt) with fixed pleura (b thickened line) due to pneumothorax; the A-lines (b blue box) underlies the pneumothorax
Fig. 13
Fig. 13
Mirror image artifact (a), showing a similar tissue-like pattern in comparison with the liver (b blue area). Hyperechoic diaphragmatic line (b curved dotted line)
Fig. 14
Fig. 14
Comet tail artifact (ad). Chest ultrasound examination performed with a high frequency linear probe (15–7 MHz) in healthy adult (a, b). Comet tail artifacts (a) with schematic representation (b). Small linear hyperechogenic artifacts come from the “pleural line” (b thickened line) and progress caudally for a few mm (b blue truncated cone). B lines (b blue vertical trapezoids) and A-lines (b blue box) are also represented. Gallbladder ultrasound performed with a low frequency convex probe (5–10 MHz) (c, d). Comet tail artifacts (c) with schematic representation (d): comet tail artifacts are the result of cholesterol crystals deposited in Rokitansky–Aschoff sinuses (d blue truncated cone)
Fig. 15
Fig. 15
Axial chest CT scan in lung window view (a, d, g) at the pulmonary apices (a), upper lobes (d) and lower lobes (g) of a 65 years-old female patient with fever shows: multiple, extensive areas of ground glass opacities in both lung (a, d), coexisting with consolidative opacities and “dark bronchogram sign” (g), consistent with COVID-19 rapid progression stage (positive for COVID-19 nasal-pharyngeal swap RT-PCR). The corresponding ultrasound scans with low-frequency convex probe at right apex (b), linear high-frequency probe at right upper chest zone (e) and convex low-frequency probe at the right lower chest zone (h) show: vertical artifacts originate from the pleura line with a coalescence aspect similar to “white lung” pattern (blue trapezoid, c) at the right apex (b); multiple B lines (f blue trapezoids) at the right superior lobe (e); area of consolidation (i blue area) with air bronchogram (i yellow arrowheads) at the right base (h)

References

    1. Henwood PC. Imaging an outbreak—ultrasound in an Ebola treatment unit. N Engl J Med 4. 2019;381(1):6–9. doi: 10.1056/nejmp1902830. - DOI - PubMed
    1. Soldati G, Smargiassi A, Inchingolo R, et al. Proposal for international standardization of the use of lung ultrasound for COVID-19 patients; a simple, quantitative, reproducible method. J Ultrasound Med. 2020 doi: 10.1002/jum.15285. - DOI - PMC - PubMed
    1. Sofia S, Boccatonda A, Montanari M, et al. Thoracic ultrasound and SARS-COVID-19: a pictorial essay. J Ultrasound. 2020 doi: 10.1007/s40477-020-00458-7. - DOI - PMC - PubMed
    1. Secco G, Delorenzo M, Zattera C, Giacomuzzi Moore B, Demitry L, Vezzoni G, Resta F, Barcella B, Cappa G, Perrone T, Salinaro F, Perlini S. Lung ultrasound in COVID-19: a useful diagnostic tool. Emer Care J. 2020 doi: 10.4081/ecj.2020.9017. - DOI
    1. Ticinesi A, Lauretani F, Nouvenne A, et al. Lung ultrasound and chest X-ray for detecting pneumonia in an acute geriatric ward. Medicine (Baltimore) 2016;95(27):e4153. doi: 10.1097/MD.0000000000004153. - DOI - PMC - PubMed

LinkOut - more resources