

Interaction between ω 6 and ω 3 fatty acids of different chain lengths regulates Atlantic salmon hepatic gene expression and muscle fatty acid profiles
- PMID: 32536300
- PMCID: PMC7333962
- DOI: 10.1098/rstb.2019.0648
Interaction between ω 6 and ω 3 fatty acids of different chain lengths regulates Atlantic salmon hepatic gene expression and muscle fatty acid profiles
Abstract
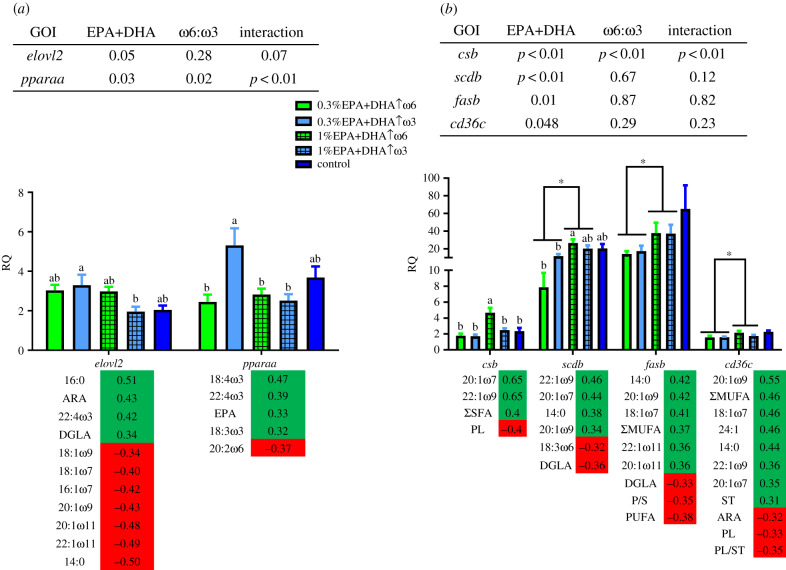
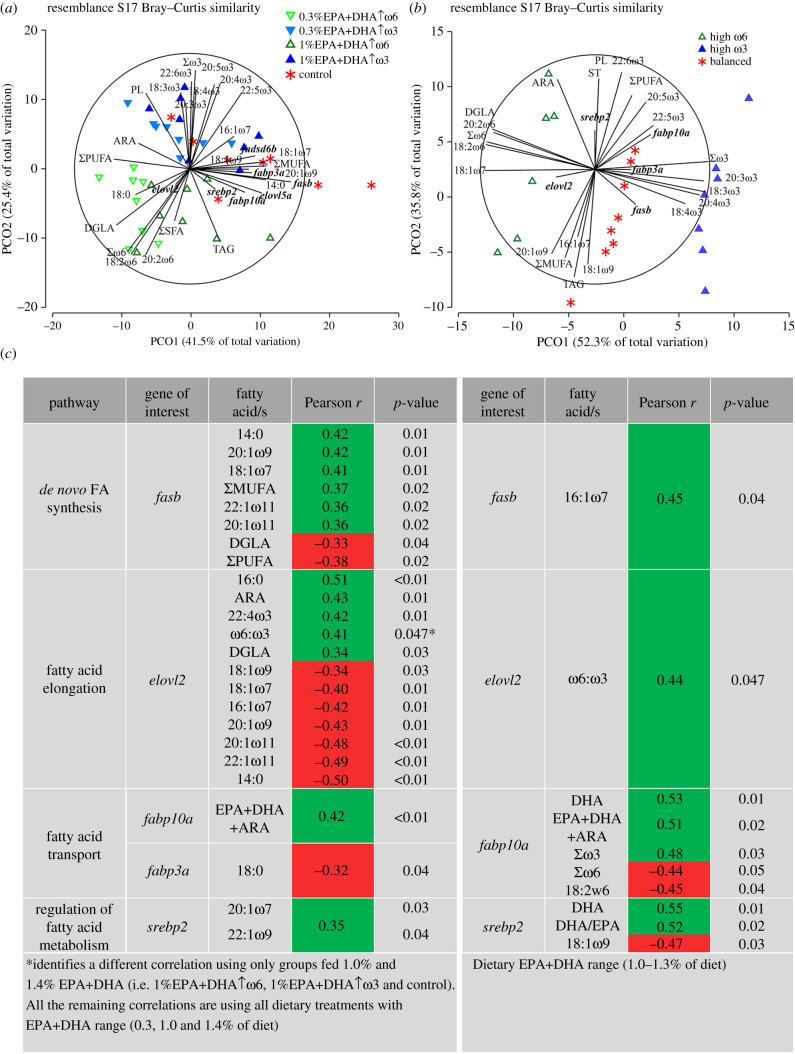
Atlantic salmon smolts (approx. 20-months old) were fed experimental diets with different combinations of omega-6:omega-3 fatty acids (FAs) (high-ω6, high-ω3, or balanced) and eicosapentaenoic acid plus docosahexaenoic acid (EPA + DHA) levels (0.3, 1.0 or 1.4%) for 12 weeks. Muscle FA (% total FA) reflected dietary C18-polyunsaturated FA; however, muscle EPA per cent and content (mg g-1) were not different in salmon fed high-ω3 or balanced diets. Muscle DHA per cent was similar among treatments, while DHA content increased in fish fed 1.4% EPA + DHA, compared with those fed 0.3-1.0% EPA + DHA combined with high-ω6 FA. Muscle 20:3ω6 (DGLA) content was highest in those fed high-ω6 with 0.3% EPA + DHA. Quantitative polymerase chain reaction analyses on liver RNA showed that the monounsaturated FA synthesis-related gene, scdb, was upregulated in fish fed 1.0% EPA + DHA with high-ω6 compared to those fed 0.3% EPA + DHA. In high-ω3-fed salmon, liver elovl2 transcript levels were higher with 0.3% EPA + DHA than with 1.0% EPA + DHA. In high-ω6-fed fish, elovl2 did not vary with EPA + DHA levels, but it was positively correlated with muscle ARA, 22:4ω3 and DGLA. These results suggest dietary 18:3ω3 elongation contributed to maintaining muscle EPA + DHA levels despite a two- to threefold change in dietary proportions, while 18:2ω6 with 0.3% EPA + DHA increased muscle DGLA more than arachidonic acid (ARA). Positive correlations between hepatic elovl2 and fabp10a with muscle ω6:ω3 and EPA + DHA + ARA, respectively, were confirmed by reanalysing data from a previous salmon trial with lower variations in dietary EPA + DHA and ω6:ω3 ratios. This article is part of the theme issue 'The next horizons for lipids as 'trophic biomarkers': evidence and significance of consumer modification of dietary fatty acids'.
Keywords: EPA and DHA; diet; lipid metabolism biomarkers; ω6:ω3 ratio.
Conflict of interest statement
We declare we have no competing interests.
Figures
References
-
- Tocher DR. 2015. Omega-3 long-chain polyunsaturated fatty acids and aquaculture in perspective. Aquaculture 449, 94–107. (10.1016/j.aquaculture.2015.01.010) - DOI
-
- Tocher DR. 2003. Metabolism and functions of lipids and fatty acids in teleost fish. Rev. Fish. Sci. 11, 107–184. (10.1080/713610925) - DOI
-
- Katan T, Caballero-Solares A, Taylor RG, Rise ML, Parrish CC. 2019. Effect of plant-based diets with varying ratios of ω6 to ω3 fatty acids on growth performance, tissue composition, fatty acid biosynthesis and lipid-related gene expression in Atlantic salmon (Salmo salar). Comp. Biochem. Physiol. D 30, 290–304. (10.1016/j.cbd.2019.03.004) - DOI - PubMed
Publication types
MeSH terms
Substances
Associated data
LinkOut - more resources
Full Text Sources
Research Materials
Miscellaneous
