Multicenter Study
. 2021 Mar;70(3):499-510.
doi: 10.1136/gutjnl-2020-321106. Epub 2020 Jun 14.

Ranking microbiome variance in inflammatory bowel disease: a large longitudinal intercontinental study

Affiliations
Multicenter Study

Ranking microbiome variance in inflammatory bowel disease: a large longitudinal intercontinental study

Adam G Clooney et al. Gut. 2021 Mar.

Abstract

Objective: The microbiome contributes to the pathogenesis of inflammatory bowel disease (IBD) but the relative contribution of different lifestyle and environmental factors to the compositional variability of the gut microbiota is unclear.

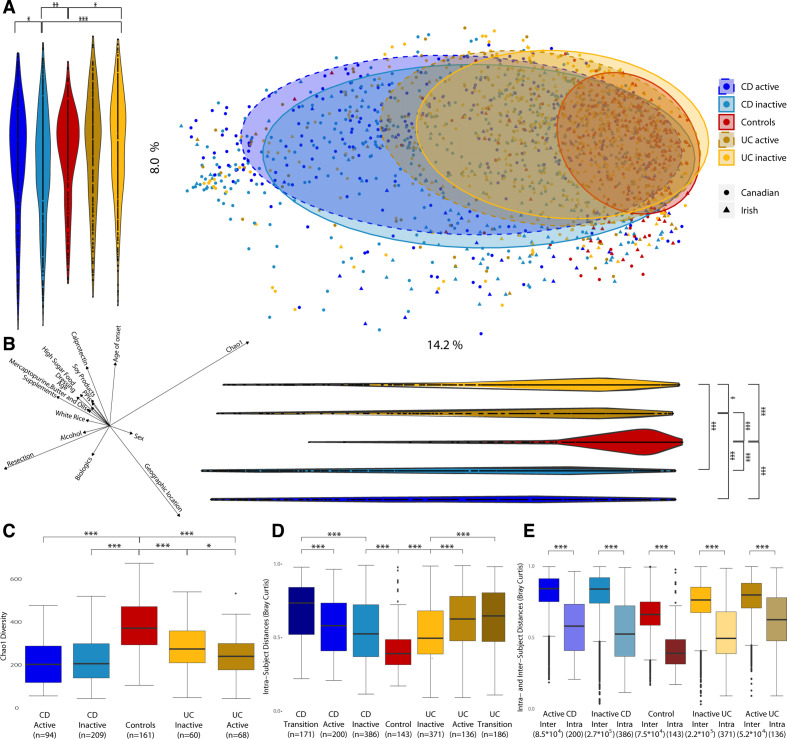
Design: Here, we rank the size effect of disease activity, medications, diet and geographic location of the faecal microbiota composition (16S rRNA gene sequencing) in patients with Crohn's disease (CD; n=303), ulcerative colitis (UC; n = 228) and controls (n=161), followed longitudinally (at three time points with 16 weeks intervals).

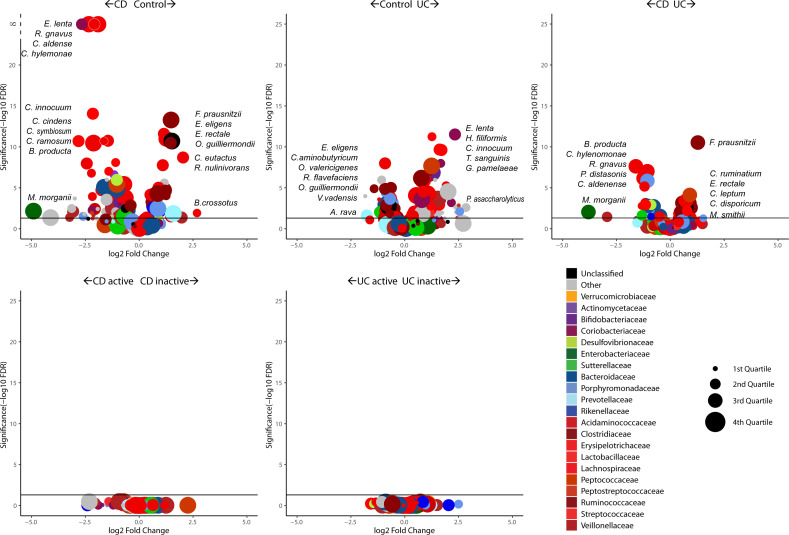
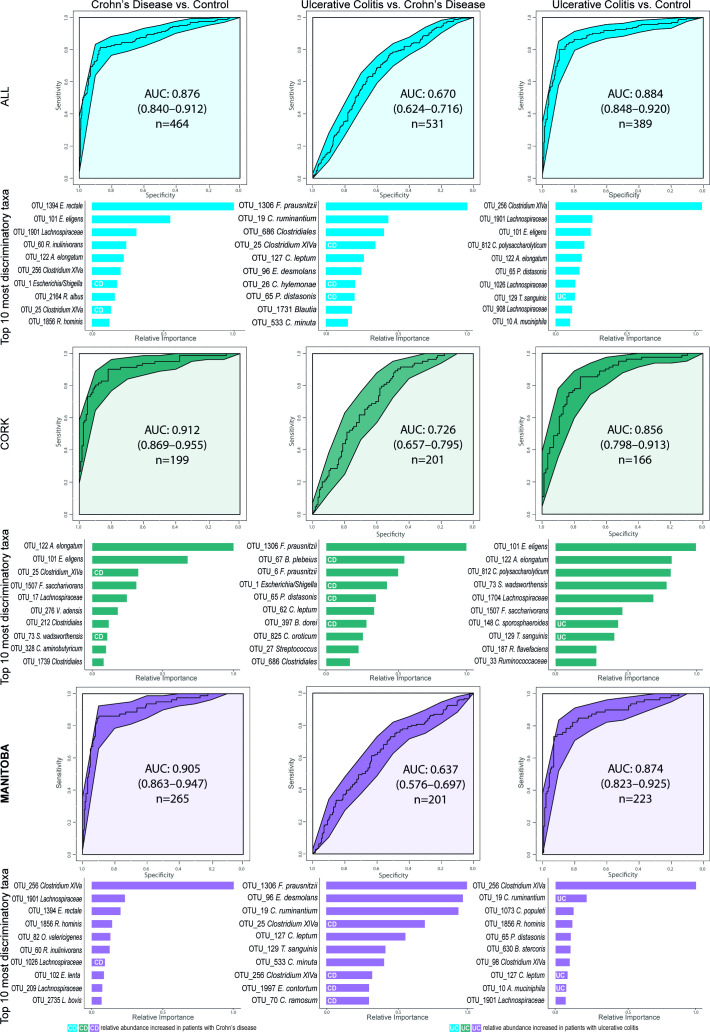
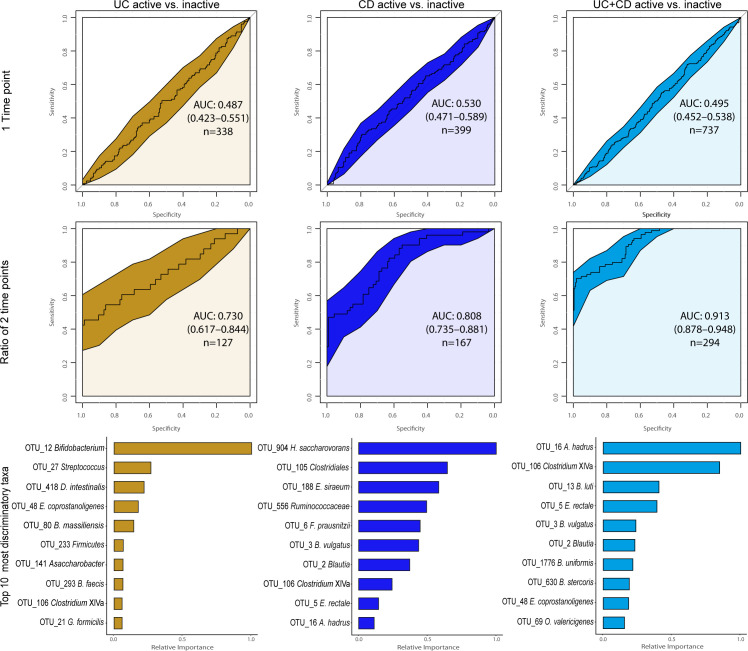
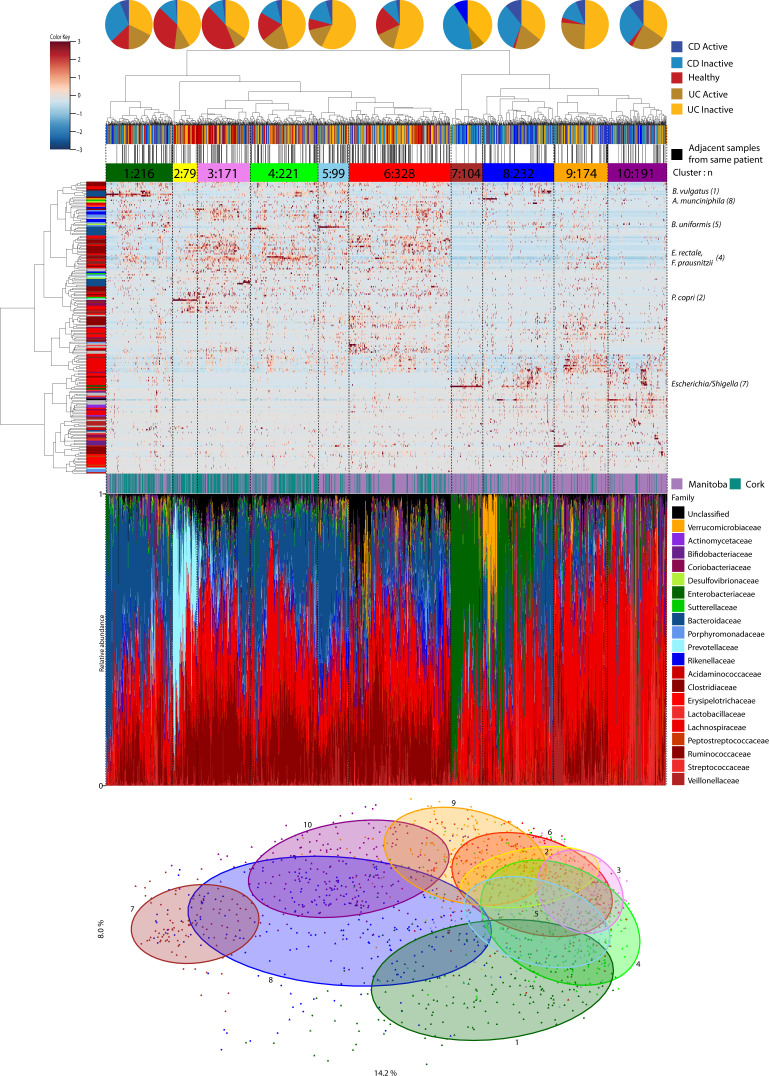
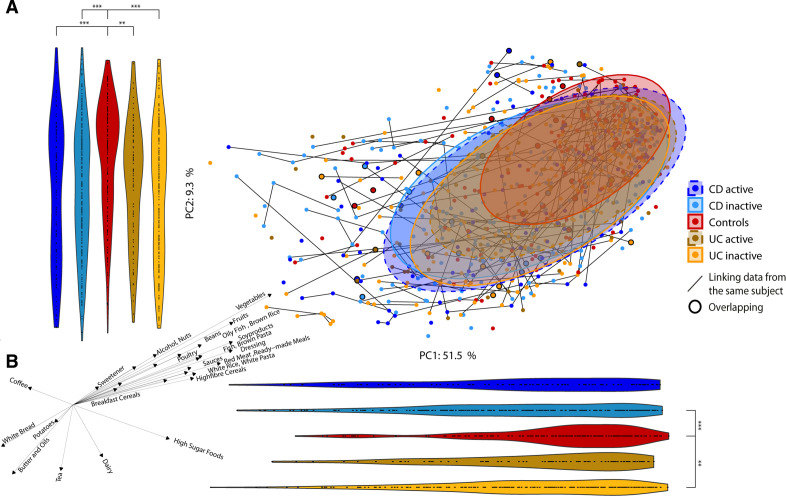
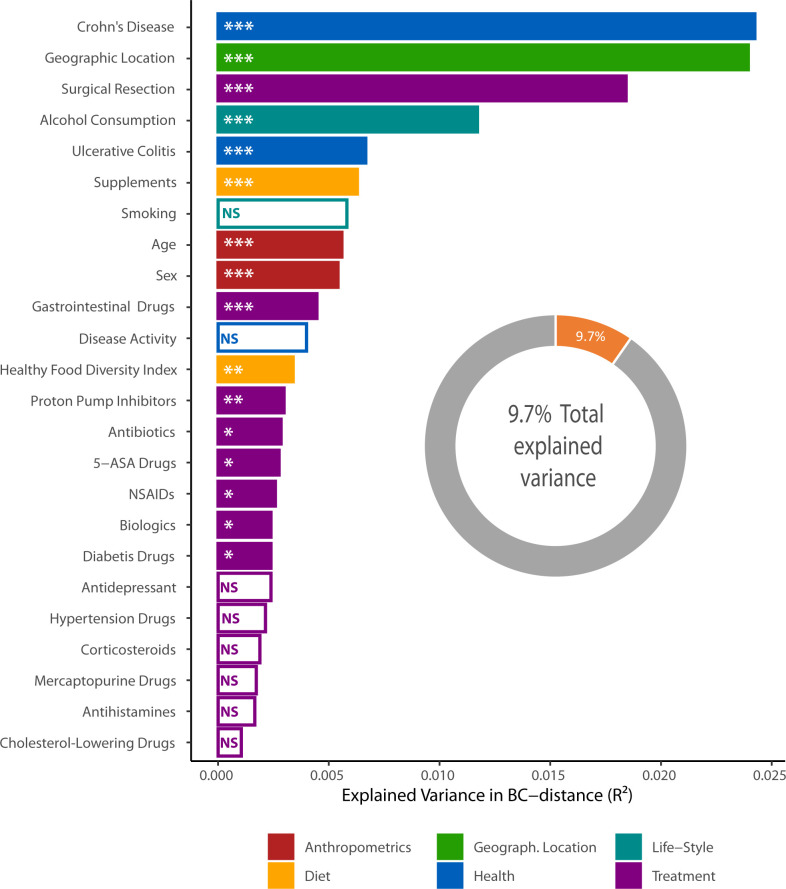
Results: Reduced microbiota diversity but increased variability was confirmed in CD and UC compared with controls. Significant compositional differences between diseases, particularly CD, and controls were evident. Longitudinal analyses revealed reduced temporal microbiota stability in IBD, particularly in patients with changes in disease activity. Machine learning separated disease from controls, and active from inactive disease, when consecutive time points were modelled. Geographic location accounted for most of the microbiota variance, second to the presence or absence of CD, followed by history of surgical resection, alcohol consumption and UC diagnosis, medications and diet with most (90.3%) of the compositional variance stochastic or unexplained.

Conclusion: The popular concept of precision medicine and rational design of any therapeutic manipulation of the microbiota will have to contend not only with the heterogeneity of the host response, but also with widely differing lifestyles and with much variance still unaccounted for.

Keywords: Crohn's disease; colonic microflora; diet; ulcerative colitis.


Conflict of interest statement

Competing interests: MTB reports grants and personal fees from AbbVie Canada, grants and personal fees from Janssen Canada, grants and personal fees from Pfizer Canada, grants from Shire Canada, grants and personal fees from Takeda Canada, personal fees from Mylan Pharmaceuticals, other from AbbVie, Janssen, Pfizer, Boerhinger Ingelheim, Celgene, outside the submitted work; FS reports other from Alimentary Health/Precision Biotics, other from 4D pharma, Cork, other from Atlantia Food Clinical Trials, personal fees from Kaleido Biosciences, outside the submitted work; MJC reports personal fees from Mars PetCare, other from Second Genome, outside the submitted work.

Figures

Figure 1
Figure 1
Microbiota composition and diversity in Crohn’s disease (CD), ulcerative colitis (UC) and control subjects. (a) Principal coordinates analysis (PCoA) based on Bray-Curtis distances with proportional normalisation on all operational taxonomic units (OTUs) present in >5% of samples, with samples grouped by disease and activity state. Violin plots show projections of PCoA points into PC1 and PC2. (b) Spearman’s correlations between PC axes and food groups/metadata and alpha diversity. Only categories with significant correlations are represented. The direction and length of the arrows indicate the direction and strength of the correlation. (c) Comparison of Chao1 alpha diversity for disease type and status of patients with IBD vs healthy controls.(d) Comparison of distances between time points from the same subject based on intra-individual Bray-Curtis distances. (e) Comparison of intra-individual and inter-individual Bray-Curtis distances. *p<0.05; **p<0.01; ***p<0.001.
Figure 2
Figure 2
Differential species abundances (volcano plots) between disease groups and disease state. Points above the horizontal line are significant while the X-axis position of each point indicates the direction of fold change. The size of each point refers to the abundance of the species across the cohort while the colour indicates the family rank. CD, Crohn’s disease;UC, ulcerative colitis.
Figure 3
Figure 3
Machine learning classification of the subject cohorts, first combined and then separated by geographic location. Receiver operating characteristic curves (ROC) for the boosted tree models on the bases of proportional normalised operational taxonomic units (OTUs) present in >5% of samples. Below each ROC curve, variable importance plots show the relative importance for the 10 OTUs with the highest gain for each comparison alongside their highest known classification. The white UC and CD labels within the bars indicate which OTUs are increased in their respective patient group, bars without mark indicate that their respective taxon is increased in the other class of the model. A model with an area under the curve (AUC) of 0.5 has no discriminatory capacity, whereas an AUC of 1 indicates perfect separation of the response variables.
Figure 4
Figure 4
Single and dual time-point machine learning classification of disease activity for patients with Crohn’s disease (CD) and ulcerative colitis (UC) separately and combined cohorts based on proportional normalised operational taxonomic units (OTUs) present in >5% of samples. The receiver operating characteristics (ROC) curves for the boosted tree models on the second row were generated based on the ratio of each OTU between two consecutive time points. Only subjects that did not transition between disease states were included, Canadian and Irish combined. Below each ROC curve are variable importance displayed indicating the relative importance for the 10 OTUs with the highest gain for each model.
Figure 5
Figure 5
Hierarchical clustering of stool microbiota. Heatplot of operational taxonomic units (OTUs) classified at species level with Spearman’s correlations and ward-linkage clustering. The vertical colour bar represents the family of each species. The samples were divided into 10 clusters (tertiary horizontal colour bar) using dynamicTreeCut. The first horizontal colour bar indicates the disease and status of each sample, the second horizontal bar shows samples of the same patient that clustered adjacent to each other. The species names on the right of the plot, along with the cluster number, are the drivers of the clustering. The bar chart shows the taxonomic composition at family level of each sample ordered by phylum. The principal coordinates analysis (PCoA) at the bottom is the same as figure 1 but labelled by the 10 clusters. CD, Crohn’s disease; UC, ulcerative colitis.
Figure 6
Figure 6
Food composition in Crohn’s disease (CD), ulcerative colitis (UC) and control subjects. (a) Principal component analysis (PCA) of the food groups coloured by disease and disease status. Violin plots represent the points in the PCA projected to the principal component (PC)1 and PC2 axes to assess shifts in the groups. Patients with greater than one identical questionnaire are indicated by black circles. (b) Spearman’s correlations between PC axis of PCA and food groups/metadata. Only features with significant correlations are represented. The direction and length of the arrows indicate the direction and strength of the correlation. *p<0.05; **p<0.01; ***p<0.001.
Figure 7
Figure 7
Factors explaining microbiota variance. Association between 25 tested environmental factors and the microbiota beta diversity of n=650 individuals (291 Crohn’s disease (CD), 236 ulcerative colitis (UC), 120 controls; one randomly chosen time point per subject) at operational taxonomic unit (OTU) level in terms of explained fraction of the variance in Bray-Curtis dissimilarity. Of available 692 subjects, 42 were excluded due to missing values in the metadata. Adjusted permutational multivariate analysis of variance p values: *p<0.05; **p<0.01; ***p<0.001. 5-ASA, 5-aminosalicylic acid; NSAID, non-steroidal anti-inflammatory drug; NS, not significant.

Comment in

References

    1. Bernstein CN, Forbes JD. Gut microbiome in inflammatory bowel disease and other chronic immune-mediated inflammatory diseases. Inflamm Intest Dis 2017;2:116–23. 10.1159/000481401 - DOI - PMC - PubMed
    1. Nishida A, Inoue R, Inatomi O, et al. . Gut microbiota in the pathogenesis of inflammatory bowel disease. Clin J Gastroenterol 2018;11:1–10. 10.1007/s12328-017-0813-5 - DOI - PubMed
    1. Sheehan D, Shanahan F. The gut microbiota in inflammatory bowel disease. Gastroenterol Clin North Am 2017;46:143–54. 10.1016/j.gtc.2016.09.011 - DOI - PubMed
    1. Zuo T, Kamm MA, Colombel J-F, et al. . Urbanization and the gut microbiota in health and inflammatory bowel disease. Nat Rev Gastroenterol Hepatol 2018;15:440–52. 10.1038/s41575-018-0003-z - DOI - PubMed
    1. Ryan FJ, Ahern AM, Fitzgerald RS, et al. . Colonic microbiota is associated with inflammation and host epigenomic alterations in inflammatory bowel disease. Nat Commun. In Press 2020;11:1512. 10.1038/s41467-020-15342-5 - DOI - PMC - PubMed

Publication types