. 2020 May 6;7(5):191972.
doi: 10.1098/rsos.191972. eCollection 2020 May.

On age-specific selection and extensive lifespan beyond menopause

Affiliations

On age-specific selection and extensive lifespan beyond menopause

Tin Yau Pang. R Soc Open Sci. .

Abstract

Standard evolutionary theory of ageing predicts weaker purifying selection on genes critical to later life stages. Prolonged post-reproductive lifespan (PPRLS), observed only in a few species like humans, is likely a result of disparate relaxation of purifying selection on survival and reproduction in late life stages. While the exact origin of PPRLS is under debate, many researchers agree on hypotheses like mother-care and grandmother-care, which ascribe PPRLS to investment into future generations-provision to one's descendants to enhance their overall reproductive success. Here, we simulate an agent-based model, which properly accounts for age-specific selection, to examine how different investment strategies affect the strength of purifying selection on survival and reproduction. We observed in the simulations that investment strategies that allow a female individual to remain contributive to its own descendants (infants and adults) at late life stages may lead to differential relaxation of selection on survival and reproduction, and incur the adaptive evolution of PPRLS.

Keywords: ageing; kin selection; menopause; population genetics.


Conflict of interest statement

We declare we have no competing interest.

Figures

Figure 1.
Figure 1.
Illustration of the genome structure of an agent. A genome has two chromosomes. Each chromosome has a set of 192 male loci and another set of 192 females loci. The 192 loci within a set map to 99 survival rates, si, life stages i = 2, …, 100, and 93 reproduction rates, ri i = 8, …, 100.
Figure 2.
Figure 2.
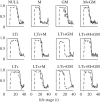
Distribution of PrR of conditions NULL, M, GM, M+GM, LTr, LTr+M, LTr+GM, LTr+M+GM, LTs, LTs+M, LTs+GM and LTs+M+GM; their PrR are 0.06 ± 0.02, 0.13 ± 0.02, 0.10 ± 0.07, 0.11 ± 0.04, 0.05 ± 0.02, 0.07 ± 0.02, 0.23 ± 0.06, 0.06 ± 0.02, 0.07 ± 0.03, 0.12 ± 0.03, 0.28 ± 0.09 and 0.11 ± 0.02, respectively. Broken line corresponds to PrR=0.20—the cut-off value for PPRLS in this study. Only LTr+GM and LTs+GM have a PrR distribution with a mean unambiguously beyond 0.20.
Figure 3.
Figure 3.
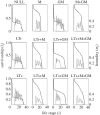
Female intrinsic rate of survival si (solid curve) and reproduction ri (broken curve). Each curve is an average over every chromosome at the end of five simulations. The curves of both si and ri decrease sharply and simultaneously, signalling the simultaneous relaxation of purifying selection on survival and reproduction, at late life in all conditions except for LTr+GM and LTs+GM. For the conditions LTr+GM and LTs+GM, the sharp decrease of si happens substantially later than the sharp decrease of ri, as the relaxation of purifying selection on survival happens later than the relaxation of selection on reproduction.
Figure 4.
Figure 4.
Survivorship li (black) and individual-fecundity mi (grey) of female individuals. Each curve is inferred from the statistics sampled at the end of five different simulations. Both li and mi drop to zero almost simultaneously, except for LTr+GM and LTs+GM.
Figure 5.
Figure 5.
(a) Fertility (defined as mtot: total lifetime fecundity), (b) the product of fertility and infant survival rate (l2), and (c) the end-of-reproduction life stage (E) plotted against the infant survival rate, defined as l2, i.e. the probability to survive to stage 2. Circle markers are data from conditions that have PPRLS, dots are conditions that involve mother-care, and crosses are the other tested conditions. The solid curve in (a) is y = 2.33/x. The broken curve in (b) is y = 2.33.
Figure 6.
Figure 6.
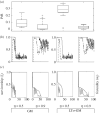
(a) Distribution of PrR, (b) intrinsic rate of survival si (solid curve) and reproduction ri (broken curve) averaged over every chromosome at the end of simulations, and (c) survivorship li (black) and individual-fecundity mi (grey) inferred from the statistics sampled at the end of the simulations, for the conditions GM and LTs+GM, with ratio between beneficial and deleterious mutation, η, equals 0.5 (default) and 0.9. At η = 0.9, relaxation of purifying selection on survival happens substantially later than relaxation of selection on reproduction on both GM and LTs+GM (b). The PrR of both conditions, however, is <0.20 because the mildly deleterious mutation allows the reproduction rates ri at late stages to stay substantially above 0 even without purifying selection.

References

    1. Lee RD. 2003. Rethinking the evolutionary theory of aging: transfers, not births, shape senescence in social species. Proc. Natl Acad. Sci. USA 100, 9637–9642. (10.1073/pnas.1530303100) - DOI - PMC - PubMed
    1. Charlesworth B. 2000. Fisher, Medawar, Hamilton and the evolution of aging. Genetics 156, 927–931. - PMC - PubMed
    1. Haldane JBS. 1942. New paths in genetics. London, UK: George Allen & Unwin.
    1. Hamilton WD. 1966. The moulding of senescence by natural selection. J. Theor. Biol. 12, 12–45. - PubMed
    1. Medawar P. 1952. An unsolved problem of biology: an inaugural lecture delivered at University College, London, 6 December, 1951. London, UK: H.K. Lewis and Company.

LinkOut - more resources