. 2020 Jun 3;6(23):eabb2236.
doi: 10.1126/sciadv.abb2236. eCollection 2020 Jun.

Flux, toxicity, and expression costs generate complex genetic interactions in a metabolic pathway

Affiliations

Flux, toxicity, and expression costs generate complex genetic interactions in a metabolic pathway

Harry Kemble et al. Sci Adv. .

Abstract

Our ability to predict the impact of mutations on traits relevant for disease and evolution remains severely limited by the dependence of their effects on the genetic background and environment. Even when molecular interactions between genes are known, it is unclear how these translate to organism-level interactions between alleles. We therefore characterized the interplay of genetic and environmental dependencies in determining fitness by quantifying ~4000 fitness interactions between expression variants of two metabolic genes, starting from various environmentally modulated expression levels. We detect a remarkable variety of interactions dependent on initial expression levels and demonstrate that they can be quantitatively explained by a mechanistic model accounting for catabolic flux, metabolite toxicity, and expression costs. Complex fitness interactions between mutations can therefore be predicted simply from their simultaneous impact on a few connected molecular phenotypes.


Figures

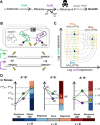
Fig. 1
Fig. 1. Quantitative mapping of fitness interactions between expression variants of two metabolic genes in expression-modifying environments.
(A) l-Arabinose pathway of E. coli. (B) araA and araB were placed under the control of inducible promoters, making their expression sensitive to the concentration of their respective inducers, anhydrotetracycline (aTc) and isopropyl β-d-1-thiogalactopyranoside (IPTG). A barcoded library of mutant promoter combinations was constructed, with mutations targeting the −35 and −10 RNA polymerase-binding hexamers (black letters). Underlined bases are annotated repressor binding sites. (C) Competitive fitness was measured under different inducer concentrations defining three environments. PLtetO-1 single mutants, green; PLlacO-1 single mutants, purple; double mutants, orange. Contours are hypothetical fitness isoclines. (D) Epistasis was quantified for all mutant promoter pairs across environments. Epistasis can be categorized as either magnitude or sign type. Sign epistasis is further categorized as simple (effect of one mutation changes sign in presence of the other) or reciprocal (effects of both mutations change sign in the presence of the other). Capitalized letters represent mutant alleles of PLtetO-1-araA and PLlacO-1-araB. Superscript plus and minus denote that individual alleles are beneficial or deleterious, respectively.
Fig. 2
Fig. 2. Fitness effects of promoter mutations across backgrounds and environments.
(A) Genotypes are colored according to the natural logarithm of their fitness relative to the WT (Frel). Gray denotes unquantifiable fitness effects. Letters show WT bases, and the three mutations at each position are ordered alphabetically as in (B). Single promoter mutants make up the right-most column (araA) and top row (araB). Inducer concentrations were aTc (20 ng/ml) and 30 μM IPTG (Env1), aTc (5 ng/ml) and no IPTG (Env2), and aTc (200 ng/ml) and no IPTG (Env3). (B) Fitness changes when an allele of one promoter is added to alleles of the second promoter. Large points indicate the “background” promoter is WT. Red, blue, and gray points indicate positive, negative, and nonsignificant fitness changes, respectively. Red, blue, and gray rectangles indicate that, in that environment, an allele can be beneficial but never deleterious, deleterious but never beneficial, or both beneficial and deleterious. G7A of PLtetO-1-araA (*) is the only allele conferring a qualitatively consistent fitness effect (beneficial) across all backgrounds and environments.
Fig. 3
Fig. 3. Strength, types, and trends of epistasis across environments.
(A) Violins show epistasis for different kinds of mutation pairs (white point, median; black point, mean). Mutation pairs may contain mutations that are individually both beneficial (A+ B+), both deleterious (A B), or mixed (A+ B and A B+), or one of which confers an undetectable effect (A0 B+/− and A+/− B0). The number of each such pair is provided. Stacked bars show fractions of different epistasis types (colors as in Fig. 1D, with white where epistasis could not be computed). Scatterplots show fitness of double mutants against that expected if mutation effects combined additively. Points colored as in Fig. 1D. (B) Relationship between background fitness and the fitness change induced by mutations in the second promoter in Env1. Top: araA promoter mutations added to existing araB promoter mutations. Bottom: Inverse case. Colored points highlight particular alleles. Top: PLtetO-1-araA alleles T2C (red) and G7C (blue). Bottom: PLlacO-1-araB alleles T1A (red) and C11A (blue). Large points show effects in the WT background.
Fig. 4
Fig. 4. Mechanistic basis of heterogeneous, environmentally dependent epistasis.
(A) Fitted activity fitness model. Spheres are positioned according to predicted activity levels and observed Frel (Env1–3: red, blue, and orange, respectively). Three largest spheres are WT, intermediate-sized spheres are single mutants, and small pale spheres are double mutants. (B) Upper plots recapitulate Fig. 3B. Lower plots show highlighted genotypes within fitness landscape (black point is WT; other large points are single mutants, gray for the gene considered as carrying the background alleles). (C) Fitness surface on log activity scale colored by predicted intergenic epistasis type (colors as in Fig. 1D; determined as nonsignificant (gray) if magnitude is <0.01). Large black point is WT. Smaller, opaque blue, red, and black points are single mutants, colored by observed Frel (deleterious, beneficial, and neutral, respectively). Transparent points are double mutants, colored by observed epistasis type and sized by epistasis strength. (D) Dark gray marks area below a hypothetical disease threshold (40% of maximum fitness). Points are four genotypes in Env2 (blue) and Env3 (orange): WT (largest), C11A of PLtetO-1-araA and G7T of PLlacO-1-araB (intermediate size), and the resulting double mutant (smallest). Green arrow represents a change in activity levels caused by nongenetic factors like aging or environment. A disease state results here from one combination of alleles and environment (pale orange).

References

    1. Scriver C. R., Waters P. J., Monogenic traits are not simple: Lessons from phenylketonuria. Trends Genet. 15, 267–272 (1999). - PubMed
    1. Badano J. L., Katsanis N., Beyond Mendel: An evolving view of human genetic disease transmission. Nat. Rev. Genet. 3, 779–789 (2002). - PubMed
    1. Cooper D. N., Krawczak M., Polychronakos C., Tyler-Smith C., Kehrer-Sawatzki H., Where genotype is not predictive of phenotype: Towards an understanding of the molecular basis of reduced penetrance in human inherited disease. Hum. Genet. 132, 1077–1130 (2013). - PMC - PubMed
    1. Argmann C. A., Houten S. M., Zhu J., Schadt E. E., A next generation multiscale view of inborn errors of metabolism. Cell Metab. 23, 13–26 (2016). - PMC - PubMed
    1. Manolio T. A., Collins F. S., Cox N. J., Goldstein D. B., Hindorff L. A., Hunter D. J., McCarthy M. I., Ramos E. M., Cardon L. R., Chakravarti A., Cho J. H., Guttmacher A. E., Kong A., Kruglyak L., Mardis E., Rotimi C. N., Slatkin M., Valle D., Whittemore A. S., Boehnke M., Clark A. G., Eichler E. E., Gibson G., Haines J. L., Mackay T. F. C., McCarroll S. A., Visscher P. M., Finding the missing heritability of complex diseases. Nature 461, 747–753 (2009). - PMC - PubMed

Publication types