. 2020 Sep 7;217(9):e20192080.
doi: 10.1084/jem.20192080.

Layilin augments integrin activation to promote antitumor immunity

Affiliations

Layilin augments integrin activation to promote antitumor immunity

Kelly M Mahuron et al. J Exp Med. .

Abstract

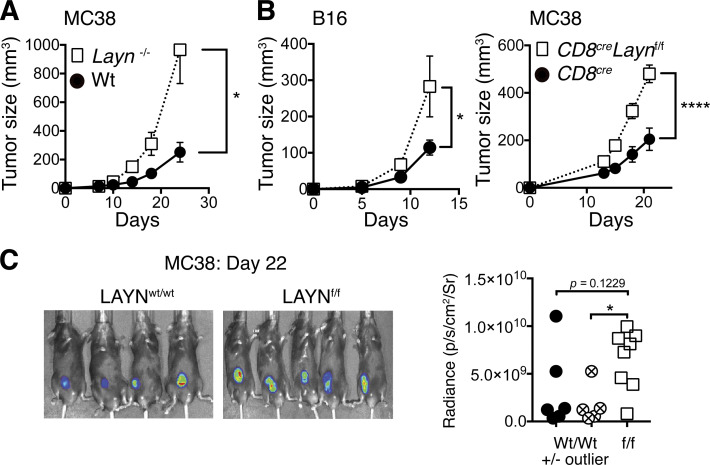
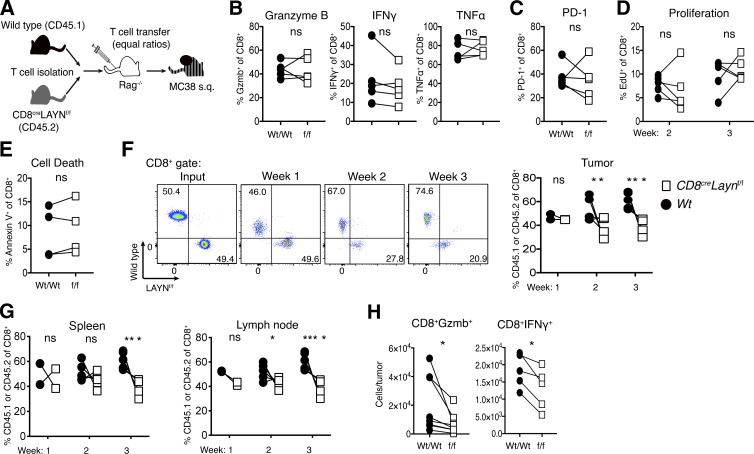
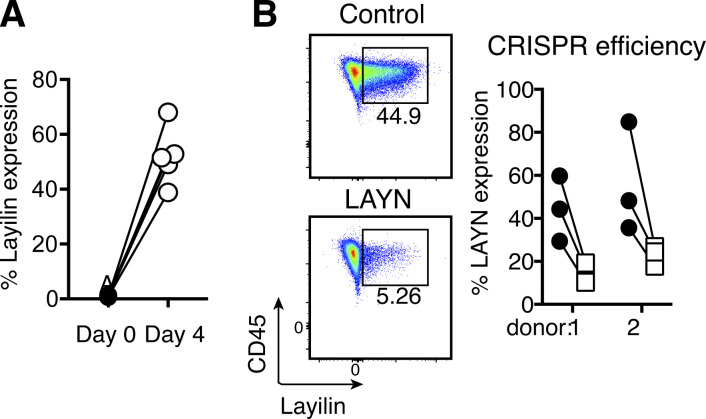
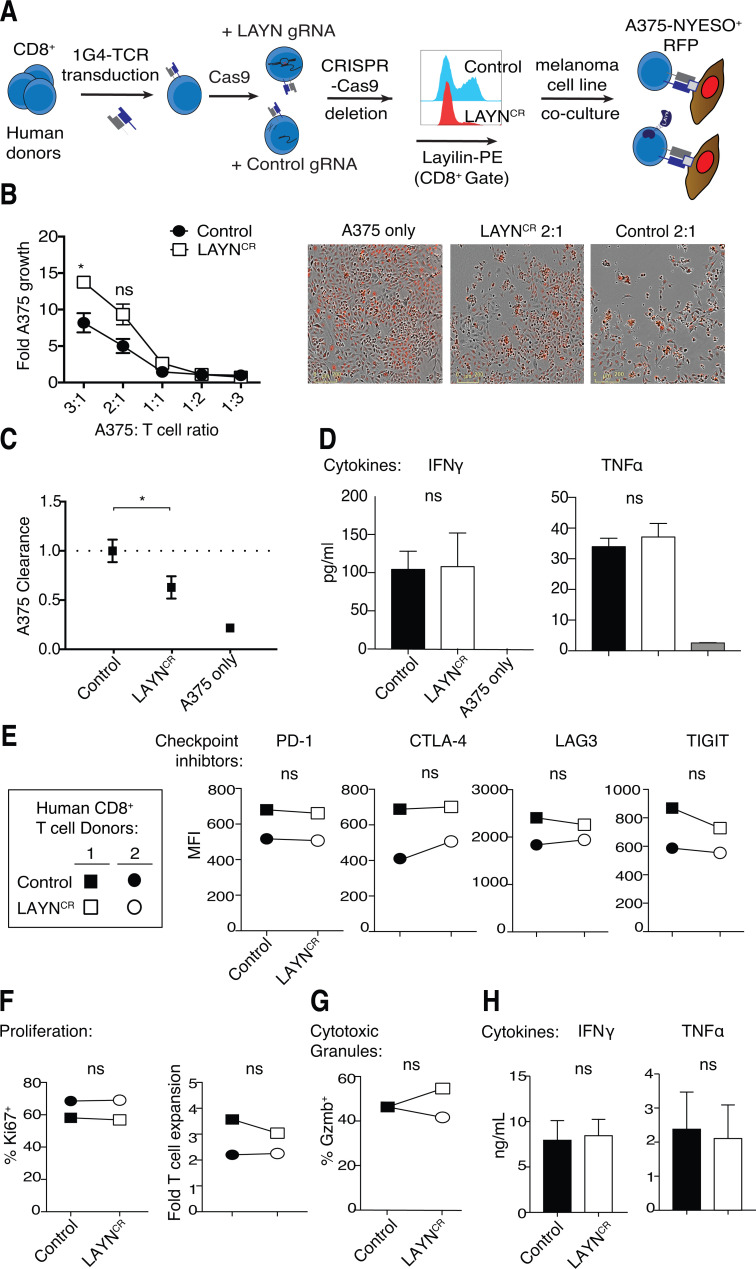
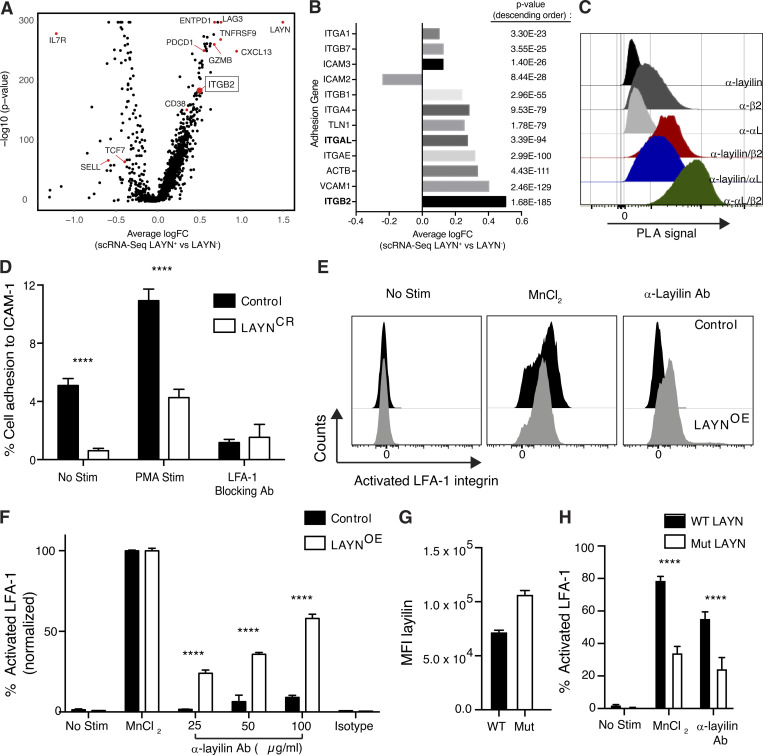
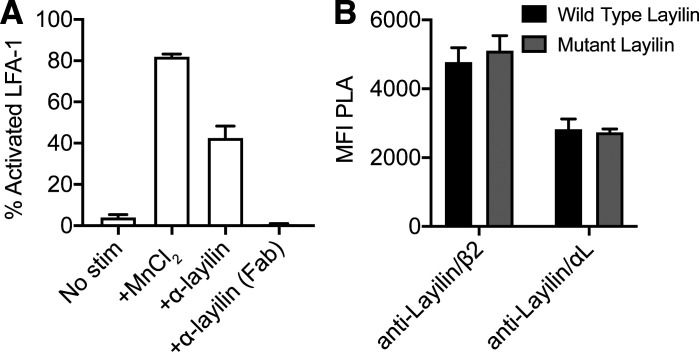
Tumor-infiltrating CD8+ T cells mediate antitumor immune responses. However, the mechanisms by which T cells remain poised to kill cancer cells despite expressing high levels of inhibitory receptors are unknown. Here, we report that layilin, a C-type lectin domain-containing membrane glycoprotein, is selectively expressed on highly activated, clonally expanded, but phenotypically exhausted CD8+ T cells in human melanoma. Lineage-specific deletion of layilin on murine CD8+ T cells reduced their accumulation in tumors and increased tumor growth in vivo. Congruently, gene editing of LAYN in human CD8+ T cells reduced direct tumor cell killing ex vivo. On a molecular level, layilin colocalized with integrin αLβ2 (LFA-1) on T cells, and cross-linking layilin promoted the activated state of this integrin. Accordingly, LAYN deletion resulted in attenuated LFA-1-dependent cellular adhesion. Collectively, our results identify layilin as part of a molecular pathway in which exhausted or "dysfunctional" CD8+ T cells enhance cellular adhesiveness to maintain their cytotoxic potential.


Conflict of interest statement

Disclosures: K.M. Mahuron reported grants from TRex Bio, Inc. during the conduct of the study; in addition, K.M. Mahuron had a patent to compositions and methods involving layilin pending. J.M. Moreau reported grants from TRex Bio, Inc. during the conduct of the study; in addition, J.M. Moreau had a patent to compositions and methods involving layilin pending. M.L. Pauli reported grants from TRex Bio, Inc. during the conduct of the study; personal fees from TRex Bio, Inc. outside the submitted work; and has been a consultant for TRex Bio, Inc. since January 2019. R.M. Feldman reported personal fees from TRex Bio, Inc. during the conduct of the study and personal fees from TRex Bio, Inc. outside the submitted work. P. Mehta reported grants from TRex Bio, Inc. during the conduct of the study; in addition, P. Mehta had a patent to compositions and methods involving layilin pending. M.M. Lowe reported a patent to UCSF/TRex Bio, Inc. pending. A. Marson reported personal fees from Arsenal Biosciences, Spotlight Therapeutics, PACT Pharma, Trizell, Juno Therapeutics, Health Advances, Lonza, Bernstein, AbbVie, Genentech, Merck, Illumina, Arcus, Jackson Laboratories, Nanostring Technologies, GLG, and Rupert Case Management; grants from Juno Therapeutics, Epinomics, Sanofi, and Gilead; non-financial support from Illumina; grants from Parker Institute for Cancer Immunotherapy; personal fees from AlphaSights, ALDA, and Amgen; "other" from ThermoFisher outside the submitted work; and reporting an inventorship on IP licensed to Arsenal Biosciences, Juno Therapeutics, and Fate Therapeutics. J. Wells reported grants from TRex Bio, Inc. during the conduct of the study, grants from Celgene, and personal fees from Cytomix outside the submitted work. R. Jupp was an employee of TRex Bio, Inc. at the time of the study. A.I. Daud reported "other" from TRex Bio, Inc. during the conduct of the study; grants from Merck, BMS, Roche, and Novartis; "other" from Genentech; grants from Checkmate and Incyte; personal fees from Array; and grants from Xencor, Curis, and OncoSec outside the submitted work. M.D. Rosenblum reported grants from TRex Bio, Inc. during the conduct of the study; personal fees from TRex Bio, Inc. outside the submitted work; and had a patent to UCSF/TRex Bio, Inc. pending. No other disclosures were reported.

Figures

Figure S1.
Figure S1.
Flow cytometric gating and sorting strategy. (A) Gating strategy for isolation of CD8+ TILs (live CD45+ CD3+ CD8+). (B) Representative flow cytometric plot to quantify CTLA-4 and PD-1 expression on CD8+ TILs. (C) Sorting strategy demonstrating how an intracellular staining control including CTLA-4 was used to set the PD-1 gate so that >80% of the sorted PD-1hiCTLA-4hi population expressed high levels of both markers. FSC-A, forward scatter area; FSC-H, forward scatter height; FSC-W, forward scatter width; SSC-A, side scatter area; SSC-H, side scatter height; SSC-W, side scatter width.
Figure 1.
Figure 1.
Layilin is highly expressed on CD8+PD-1hiCTLA-4hi TILs in human metastatic melanoma. (A) Schematic of the project design and approach. (B) Heatmap from bulk RNA-seq comparing highest differentially expressed genes between sort-purified PD-1hiCTLA-4hi and PD-1loCTLA-4lo CD8+ TILs. (C) Quantification of LAYN RNA counts from bulk RNA-seq; n = 5 patients. (D) Representative flow cytometric plot and quantification of cell surface layilin protein expression of PD-1hiCTLA-4hi versus PD-1loCTLA-4lo CD8+ TILs from 10 human melanoma samples. Each symbol represents an individual patient; mean and SEM are shown. Statistical significance was determined by paired two-tailed t tests. *, P< 0.05; ****, P< 0.001.
Figure S2.
Figure S2.
Comparative scRNA-seq analysis of human melanoma CD8+ TIL subsets. (A) Gene set enrichment analysis showing enrichment of exhaustion, tissue-resident memory, and activation and effector function signatures genes within the ranked gene expression of PD-1hiCTLA-4hi compared with PD-1loCLTA-4lo CD8+ TILs from human melanoma (n = 5). NES, normalized enrichment score. (B) Matched tissue scRNA-seq of CD8+ T cells isolated from patient K-411. (C) UMAP plots generated from scRNA-seq and scTCR-seq demonstrating LAYN expression and clone size from K-409 primary tumor. Clones are defined as sets of cells with perfect matches for all called TCR α and β chains from single-cell TCR data. (D) Coxcomb plots showing the 20 most expanded LAYN+ and LAYN clones in K-409 primary tumor. Each pie slice represents a unique CD8+ T cell clonotype, and pie slice height is proportional to clone size. FDR, false discovery rate.
Figure 2.
Figure 2.
Layilin expression is enriched on highly activated, clonally expanded CD8+ TILs. (A) Feature plots of scRNA-seq; n = 20,018 cells from four human melanoma samples. (B) Heatmaps comparing selected differentially expressed genes in LAYN-positive (+) and LAYN-negative (−) cells from scRNA-seq analysis. (C) scRNA-seq analysis of LAYN expression in peripheral blood, metastatic LNs (involved LN), and primary tumor from patient K-409. (D) UMAP plots generated from scRNA-seq and scTCR-seq demonstrating LAYN expression and clone size from K-409–involved LN. Clones are defined as sets of cells with perfect matches for all called TCR α and β chains from single-cell TCR data. (E) Coxcomb plots showing the 20 most expanded LAYN+ and LAYN clones in K-409 involved LN. Each pie slice represents a unique CD8+ T cell clonotype, and pie slice height is proportional to clone size. (F) Representative flow cytometric plot and quantification of cell surface layilin and CD39 protein expression of CD8+ TILs from eight human melanoma samples. Each symbol represents an individual patient; mean and SEM are shown. Statistical significance was determined by paired two-tailed t tests. *, P < 0.05; ***, P < 0.01; ****, P < 0.001.
Figure S3.
Figure S3.
Layilin expressed on mouse CD8+ T cells protects against tumor growth. (A) Schematic depiction of our strategy to generate conditional Layn knockout mice specific to CD8+ cells. (B) CD8+ T cell frequencies in CD8creLaynf/f mice were compared with littermate wild-type counterparts across several tissues. Symbols represent individual mice. (C) Quantitative PCR analysis was performed on CD8+TCRβ+ T cells isolated by FACS from MC38 tumors or spleens. Each symbol corresponds to an individual mouse. Data are representative of two independent experiments. (D) CD8+TCRβ+ T cells isolated by FACS from MC38 tumors and spleens were analyzed by Western blot. (E) Rag−/− mice were simultaneously challenged with B16.F10 melanoma cells and i.v. injected with 5 × 10⁶ purified T cells from either CD8creLaynf/f or CD8creLaynwt/wt donors. CD8+ and CD4+ T cells were coinjected at a 2:1 ratio. n = 6 animals per group. (F) 3 wk following MC38 engraftment and T cell adoptive transfer into Rag−/− hosts, tumor-infiltrating T cells were analyzed by flow cytometry. Data are representative of two independent experiments; paired symbols represent single tumors from individual mice, and error bars are standard deviation. Statistical significance was determined by two-way ANOVA (E). *, P < 0.05.
Figure 3.
Figure 3.
Layilin augments CD8+ TIL-mediated antitumor immunity. (A) Layn−/− or wild-type animals were injected subcutaneously with the MC38 tumor cell line and tumor growth quantified by caliper measurements. Symbols and error bars represent mean and SEM at each time point; n = 7 per group. Data are representative of two independent experiments. (B) CD8creLaynf/f and CD8creLaynwt/wt mice were injected subcutaneously with B16.F10 or MC38 tumor cell lines. Symbols and error bars represent mean and SEM at each time point; n = 6–10 per group. Data are representative of three independent experiments. (C) Representative images and quantification of in vivo luciferin bioluminescence imaging taken of mice bearing MC38-LUC2 tumors. Symbols correspond to individual mice. Statistical significance was determined by two-way ANOVA (A and B) or unpaired two-tailed t tests (C). *, P < 0.05; ****, P < 0.0001.
Figure 4.
Figure 4.
Expression of layilin promotes the accumulation of cytotoxic CD8+ T cells in tumors. (A) Competitive adoptive transfer tumor model to elucidate layilin activity on TILs in vivo. (B–H) 2 and 3 wk following MC38 engraftment and T cell adoptive transfer into Rag−/− hosts, tumor-infiltrating and peripheral T cells were analyzed by flow cytometry. Data are representative of two independent experiments; paired symbols represent individual mice. Statistical significance was determined by unpaired two-tailed t test (D–G); *, P < 0.05; **, P < 0.01; ***, P < 0.001; ****, P < 0.0001. ns, not significant.
Figure S4.
Figure S4.
Layilin expression and gene editing in human CD8+ T cells. (A) Layilin expression on CD8+ T cells enriched from human donor peripheral blood samples and cultured 4 d in the presence of anti-CD3/CD28 activation. Symbol pairs correspond to individual donors. (B) Efficiency of CRISPR-Cas9 deletion of LAYN.
Figure 5.
Figure 5.
Layilin enhances human CD8+ T cell cytotoxicity without affecting cellular proliferation, cytokine production or inhibitory receptor expression. (A) Schematic outlining our strategy for CRISPR-Cas9 electroporation-mediated LAYN deletion and introduction of the 1G4 TCR to human CD8+ T cells. Representative flow cytometric plot of layilin protein expression between LAYN guide treated and nontargeted guide (Control) is shown. (B and C) Quantification and representative images of A375 growth and clearance when cocultured with CRISPR control or LAYN deleted 1G4+ T cells. Data are a composite from two donors and representative of three independent experiments; mean and SEM are shown, and scale bars indicate 200 µm. (D) A375 melanoma-T cell coculture supernatants were collected on day 5 and measured for IFN-γ and TNF-α secretion by multiplex ELISA. Data are representative of two independent experiments; mean and SD are shown. (E–H) Human CD8+ T cells activated with anti-CD3/CD28 were electroporated with Cas9 preloaded with control or LAYN targeting gRNA, cultured for 4 d, and analyzed by flow cytometry for surface receptor expression (E), proliferation (F), intracellular granzyme B (G), and IFN-γ and TNF-α secretion (H). Data are representative of three experiments; mean and SD are shown for D. Statistical significance was determined by two-way ANOVA. *, P < 0.05. ns, not significant.
Figure 6.
Figure 6.
Layilin enhances LFA-1 activation to promote cellular adhesion. (A) scRNA-seq analysis comparing differentially expressed genes in LAYN+ and LAYN in CD8+ melanoma TILs. (B) Comparison of differentially expressed genes coding for adhesion molecules between LAYN+ and LAYN cells. (C) Proximity ligation assay (PLA) on activated primary human CD8+ T cells. Representative of three experiments. (D) Static adhesion assay comparing LAYN-deleted and control primary human CD8+ T cells adhering to ICAM-1–coated plates under the following conditions: no stimulation, PMA stimulation, and with addition of an LFA-1–specific blocking antibody. Data are representative of three independent experiments; mean and SEM are shown. (E and F) Quantification and representative flow cytometric plots of the percentage of activated integrin LFA-1 (as detected by clone m24) between control and LAYN-overexpressing Jurkat cells under the following conditions: no stimulation, MnCl2 stimulation, dose–response of addition of an anti-layilin cross-linking antibody (25, 50, and 100 µg/ml), and with addition of a isotype (100 µg/ml) control for the layilin antibody. Data are representative of two independent experiments and normalized to MnCl2-positive control; mean and SEM are shown. (G and H) Flow cytometric quantification of layilin and m24 levels following addition of MnCl2 or 50 ug/ml anti-layilin. Data are representative of two independent; mean and SEM shown. Statistical significance determined by two-way ANOVA. ****, P < 0.0001. MFI, mean fluorescence intensity.
Figure S5.
Figure S5.
Human layilin can be cross-linked and does not require the talin for localization with LFA-1. (A) LFA-1 activation following addition of full-length anti-layilin or a derivative antigen-binding fragment (Fab). (B) Proximity ligation assay signal intensity of layilin with LFA-1 on Jurkat cells expressing either wild-type human layilin or layilin mutated to truncate the talin-binding domain. Data are representative of two independent experiments; mean and SEM are shown.

References

    1. Abram C.L., and Lowell C.A.. 2009. The ins and outs of leukocyte integrin signaling. Annu. Rev. Immunol. 27:339–362. 10.1146/annurev.immunol.021908.132554 - DOI - PMC - PubMed
    1. Alfei F., Kanev K., Hofmann M., Wu M., Ghoneim H.E., Roelli P., Utzschneider D.T., von Hoesslin M., Cullen J.G., Fan Y., et al. . 2019. TOX reinforces the phenotype and longevity of exhausted T cells in chronic viral infection. Nature. 571:265–269. 10.1038/s41586-019-1326-9 - DOI - PubMed
    1. Anikeeva N., Somersalo K., Sims T.N., Thomas V.K., Dustin M.L., and Sykulev Y.. 2005. Distinct role of lymphocyte function-associated antigen-1 in mediating effective cytolytic activity by cytotoxic T lymphocytes. Proc. Natl. Acad. Sci. USA. 102:6437–6442. 10.1073/pnas.0502467102 - DOI - PMC - PubMed
    1. Bono P., Rubin K., Higgins J.M., and Hynes R.O.. 2001. Layilin, a novel integral membrane protein, is a hyaluronan receptor. Mol. Biol. Cell. 12:891–900. 10.1091/mbc.12.4.891 - DOI - PMC - PubMed
    1. Borowsky M.L., and Hynes R.O.. 1998. Layilin, a novel talin-binding transmembrane protein homologous with C-type lectins, is localized in membrane ruffles. J. Cell Biol. 143:429–442. 10.1083/jcb.143.2.429 - DOI - PMC - PubMed

Publication types

MeSH terms