. 2020 Jun 3;61(6):28.
doi: 10.1167/iovs.61.6.28.

Downregulation of MST4 Underlies a Novel Inhibitory Role of MicroRNA Let-7a in the Progression of Retinoblastoma

Affiliations

Downregulation of MST4 Underlies a Novel Inhibitory Role of MicroRNA Let-7a in the Progression of Retinoblastoma

Xinli Zhang et al. Invest Ophthalmol Vis Sci. .

Abstract

Purpose: Retinoblastoma (RB) is the most common intraocular malignancy in children. Deregulation of several microRNAs (miRNAs) has been identified in RB. However, the specific effect of let-7a on RB remains unclear. The present study aims to explore the effect of let-7a on malignant biological behaviors of RB cells and angiogenesis in RB.

Methods: The expressions of let-7a and mammalian sterile-20 like kinase 4 (MST4) in RB were determined with the use of real-time quantitative polymerase chain reaction (RT-qPCR) and Western blot analysis. Next, in order to explore effects of let-7a and MST4 on RB cellular functions, RB cells were transfected with let-7a-mimic, let-7a inhibitor, si-MST4, or co-transfected with let-7a-mimic and oe-MST4 plasmids. Subsequently, the interaction among let-7a, MST4, and the MAPK signaling pathway was evaluated by RT-qPCR, dual-luciferase reporter gene assay, and Western blot analysis. Finally, the effects of let-7a and MST4 were further confirmed in vivo by injecting nude mice with RB cells stably expressing let-7a agomir or sh-MST4.

Results: Rb tissues and cells presented with downregulated Let-7a and upregulated MST4. Let-7a negatively targeted MST4 to block the activation of the MAPK signaling pathway. Upregulation of let-7a promoted apoptosis, and facilitated proliferation, angiogenesis, migration, and invasion of RB cells by decreasing MST4. Elevation of let-7a or silencing MST4 restricted angiogenesis and tumorigenesis in RB mice.

Conclusions: Taken together, let-7a inhibits angiogenesis in RB by silencing MST4 and inhibiting the MAPK signaling pathway.


Conflict of interest statement

Disclosure: X. Zhang, None; L. Song, None; Y. Huang, None; S. Han, None; M. Hou, None; H. Li, None

Figures

Figure 1.
Figure 1.
MST4 is identified to be upregulated in RB. (A) The heatmap of differential expressed genes in RB microarray data. Y-axis represents logFC, and X-axis represents log10 P value. Each point indicates one gene, with upregulated gene in red and downregulated gene in green. (B) The analysis of MST4 expression in RB samples with or without LOH on 16q from microarray data GSE5222. The gene expression level is represented by Y-axis, whereas grouping information is represented by the X-axis. (C) The expression of let-7a in RB tissues determined by RT-qPCR. * P < 0.05 compared with normal retinal samples. The above data were measurement data, expressed as mean ± SD, and analyzed by unpaired t-test (n = 28). RB, retinoblastoma; MST4, Mammalian sterile-20 like kinase 4; MARK, mitogen-activated protein kinase; LOH 16q, loss of heterozygosity on chromosome 16q.
Figure 2.
Figure 2.
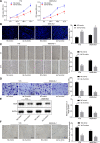
Let-7a overexpression represses malignant biological behaviors of RB cells. RB cell lines Y79 and WERI-RB-1 were transfected with let-7a-mimic or NC-mimic for in vitro functional experiments. (A) The cell viability at various time points detected by CCK-8 assay. (B) The representative images and quantitative analysis of cell apoptosis assessed by TUNEL assay (200 ×, scale bar = 50 µm). (C) The representative images and quantitative analysis of cell migration evaluated by scratch test. (D) The representative images and quantitative analysis of cell invasion examined by Transwell assay (200 ×, scale bar = 50 µm). (E) Western blot analysis of VEGF expression in Y79 and WERI-RB-1 cells normalized to GAPDH. The band intensity was quantified. (F) The representative images of in vitro tube formation and the quantitative analysis of the relative length of formed tubes (200 ×, scale bar = 50 µm). * P < 0.05 compared with cells transfected with NC-mimic. The results were measurement data, and expressed by mean ± SD. Unpaired t-test was used for the comparisons between the two groups. Repeated measurement ANOVA was utilized for comparisons of data among multiple groups at different time points, followed by Bonferroni post hoc test. Values were obtained from three independent experiments in triplicate. CCK-8, Cell Counting Kit-8; TUNEL, TdT-mediated dUTP-biotin nick end-labeling; RB, retinoblastoma; VEGF, vascular endothelial growth factor; ANOVA, analysis of variance; NC, negative control.
Figure 3.
Figure 3.
Let-7a targets MST4, which exhibits a high expression in RB tissues. (A) The binding site of let-7a on MST4 predicted by biological website and mutant sites were shown in bold italic font. (B) The binding relationship between let-7a and MST4 verified by dual-luciferase reporter assay. * P < 0.05 compared with the co-transfection of NC-mimic and WT-MST4. (C) The expression of MST4 in Y79 and WERI-RB-1 cells after transfection with let-7a-mimic or inhibitor determined by RT-qPCR. (D) Western blot analysis of MST4 expression in Y79 and WERI-RB-1 cells normalized to GAPDH after transfection with let-7a-mimic or inhibitor. The band intensity was quantified. In panels C and D, * P < 0.05 compared with the treatment of NC-mimic. #P < 0.05 compared with the treatment of NC-inhibitor. (E) The expression of MST4 in RB tissues and normal retinal samples determined by RT-qPCR (n = 28). (F) Western blot analysis of MST4 expression in RB tissues and normal retinal samples normalized to GAPDH. The band intensity was quantified (n = 28). In panels E and F, * P < 0.05 compared with normal retinal samples. (G) Pearson's correlation analysis of the correlation between let-7a expression (data from Fig. 1C) and MST4 mRNA expression (data from Fig. 3E) in RB tissues (n = 28). The results were measurement data, and expressed by mean ± SD. Unpaired t-test was used for the comparisons between the two groups, and one-way ANOVA was used for the comparisons among multiple groups, followed by Tukey's post hoc test. Pearson correlation analysis was used for between let-7a and MST4 expression. Values were obtained from three independent experiments in triplicate. RB, retinoblastoma; MST4, Mammalian sterile-20 like kinase 4; RT-qPCR, reverse transcription quantitative polymerase chain reaction; NC, negative control.
Figure 4.
Figure 4.
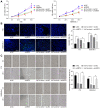
Let-7a suppresses malignant biological behaviors of RB cells by negatively regulating MST4. Y79 and WERI-RB-1 cells were transfected with si-MST4 or si-NC, or co-transfected with let-7a-mimic and oe-NC, or let-7a-mimic and oe-MST4. (A) The viability of Y79 and WERI-RB-1 cells at various time points assessed by CCK-8 assay. (B) The representative images and quantitative analysis of apoptosis of Y79 and WERI-RB-1 cells detected by TUNEL assay (200 ×, scale bar = 50 µm). (C) The representative images and quantitative analysis of cell migration of Y79 and WERI-RB-1 cells examined by scratch test. (D) The representative images and quantitative analysis of cell invasion of Y79 and WERI-RB-1 cells evaluated by Transwell assay (200 ×, scale bar = 50 µm). (E) Western blot analysis of VEGF expression in Y79 and WERI-RB-1 cells normalized to GAPDH. The band intensity was quantified. (F) The representative images of in vitro tube formation and the quantitative analysis of the relative length of formed tubes (200 ×, scale bar = 50 µm). * P < 0.05 compared with cells transfected with NC-mimic. # P < 0.05 compared with cells co-transfected with let-7a-mimic and oe-NC. The above data were measurement data, and expressed by mean ± SD. Unpaired t-test was used for the comparisons between the two groups. Repeated measurement ANOVA was utilized for comparisons of data among multiple groups at different time points, followed by Bonferroni post hoc test. Values were obtained from three independent experiments in triplicate. CCK-8, Cell Counting Kit-8; TUNEL, TdT-mediated dUTP-biotin nick end-labeling; RB, retinoblastoma; ANOVA, analysis of variance; NC, negative control.
Figure 4.
Figure 4.
Continued.
Figure 5.
Figure 5.
Let-7a exerts an inhibitory effect on MAPK signaling pathway by targeting MST4. Y79 and WERI-RB-1 cells were transfected with NC-mimic or let-7a-mimic. (A) The gray value of protein bands (JNK, ERK, p38, and JNK, ERK, and p38 phosphorylation) in Y79 and WERI-RB-1 cells. (B) The protein expression of JNK, ERK, p38, and the extents of JNK, ERK, and p38 phosphorylation normalized to GAPDH in Y79 cells. (C) The protein expression of JNK, ERK, p38, and the extents of JNK, ERK, and p38 phosphorylation normalized to GAPDH in WERI-RB-1 cells. In panels B and C, * P < 0.05 compared with cells transfected NC-mimic. Next, Y79 and WERI-RB-1 cells were treated with si-MST4, si-NC, or co-transfected with let-7a-mimic or oe-NC, or let-7a-mimic and oe-MST4. (D) The gray value of protein bands (JNK, ERK, p38, and JNK, ERK, and p38 phosphorylation) in Y79 and WERI-RB-1 cells. (E) The protein expression of JNK, ERK, p38, and the extents of JNK, ERK, and p38 phosphorylation normalized to GAPDH in Y79 cells. (F) The protein expression of JNK, ERK, p38, and the extents of JNK, ERK, and p38 phosphorylation normalized to GAPDH in WERI-RB-1 cells. In panels E and F, * P < 0.05 compared with cells transfected with si-NC. # P < 0.05 compared with cells co-transfected with let-7a-mimic and oe-NC. The above data were measurement data, and expressed by mean ± SD. Comparisons between two groups were analyzed by unpaired t-test. Values were obtained from three independent experiments in triplicate. MST4, mammalian sterile-20 like kinase 4; MARK, mitogen-activated protein kinase; JNK, c-Jun N-terminal kinase; ERK, extracellular-signal-regulated kinases; NC, negative control.
Figure 6.
Figure 6.
Overexpression of let-7a or silencing MST4 represses tumor formation and angiogenesis in vivo. The nude mice were injected with Y79 and WERI-Rb-1 cells stably infected with lentivirus expressing let-7a agomir or sh-MST4 (n = 5). (A) The representative image of tumors in nude mice 40 days after xenograft transplantation in nude mice. (B) The quantitative analysis of the tumor volume in nude mice. (C) The quantitative analysis of the tumor weight in nude mice. (D) The representative image and quantitative analysis of the expression of MST4 and VEGF in xenograft tumors detected by immunohistochemistry (400 ×, scale bar = 25 µm). (EG) Western blot analysis of the expression of JNK, ERK, p38, and the extent of JNK, ERK, and p38 phosphorylation in xenograft tumors normalized to GAPDH. The band intensity was quantified. * P < 0.05 compared with the treatment of cells stably infected with lentivirus expressing NC-agomir. # P < 0.05 compared with the treatment of cells stably infected with lentivirus expressing sh-NC. The above data were measurement data, and expressed by mean ± SD. Comparisons between two groups were analyzed by unpaired t-test. MST4, mammalian sterile-20 like kinase 4; JNK, c-Jun N-terminal kinase; ERK, extracellular-signal-regulated kinases; NC, negative control; VEGF, vascular endothelial growth factor.
Figure 7.
Figure 7.
Mechanism of let-7a in the regulation of RB progression with involvement of MST4 and the MAPK signaling pathway. Let-7a inhibits MST4 and the MAPK signaling pathway to inhibit proliferation, invasion, migration, and angiogenesis of RB cells and to promote cell apoptosis, thus ultimately repressing RB development.

References

    1. Dimaras H. Retinoblastoma genetics in India: from research to implementation. Indian J Ophthalmol. 2015; 63: 219–226. - PMC - PubMed
    1. Benavente CA, Dyer MA.. Genetics and epigenetics of human retinoblastoma. Annu Rev Pathol. 2015; 10: 547–562. - PubMed
    1. Kent OA, Mendell JT.. A small piece in the cancer puzzle: microRNAs as tumor suppressors and oncogenes. Oncogene. 2006; 25: 6188–6196. - PubMed
    1. Golabchi K, Soleimani-Jelodar R, Aghadoost N, et al. .. MicroRNAs in retinoblastoma: potential diagnostic and therapeutic biomarkers. J Cell Physiol. 2018; 233: 3016–3023. - PubMed
    1. Sung V, Luo W, Qian D, et al. .. The Ste20 kinase MST4 plays a role in prostate cancer progression. Cancer Res. 2003; 63: 3356–3363. - PubMed

Publication types

MeSH terms