

Institutional delivery service utilization and associated factors in Ethiopia: a systematic review and META-analysis
- PMID: 32539698
- PMCID: PMC7296650
- DOI: 10.1186/s12884-020-03032-5
Institutional delivery service utilization and associated factors in Ethiopia: a systematic review and META-analysis
Abstract
Background: There is wide variation in the utilization of institutional delivery service in Ethiopia. Various socioeconomic and cultural factors affect the decision where to give birth. Although there has been a growing interest in the assessment of institutional delivery service utilization and its predictors, nationally representative evidence is scarce. This study was aimed to estimate the pooled national prevalence of institutional delivery service utilization and associated factors in Ethiopia.
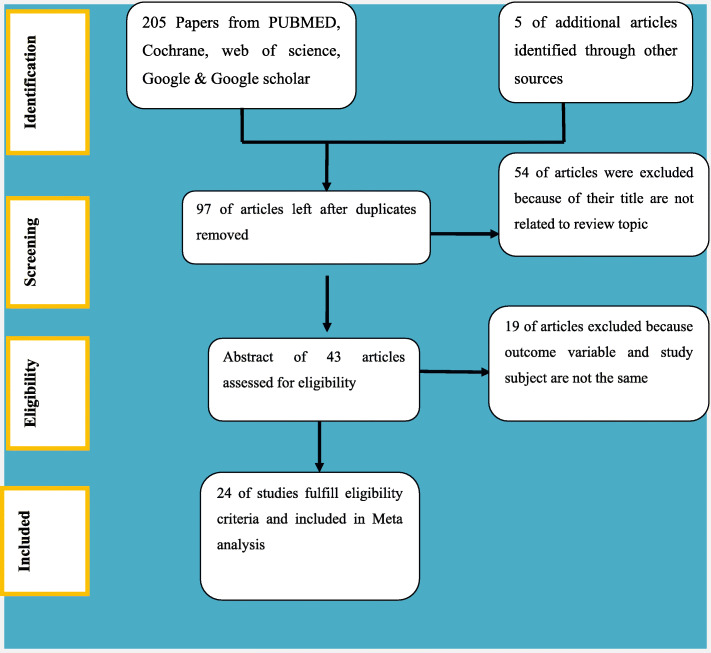
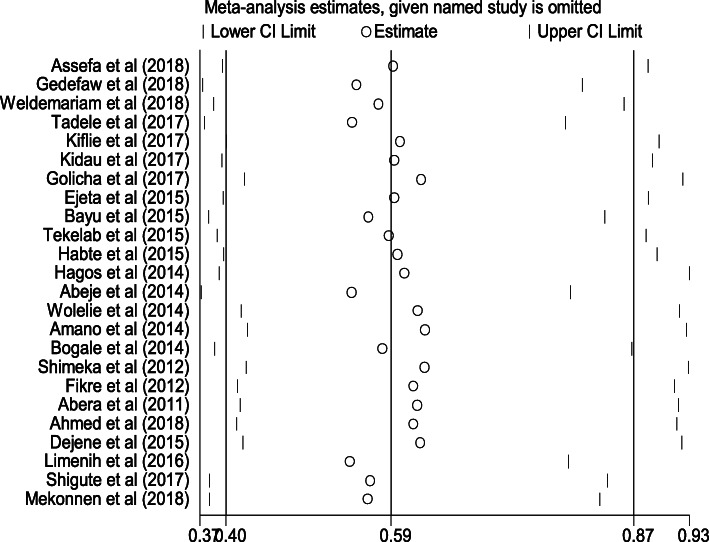
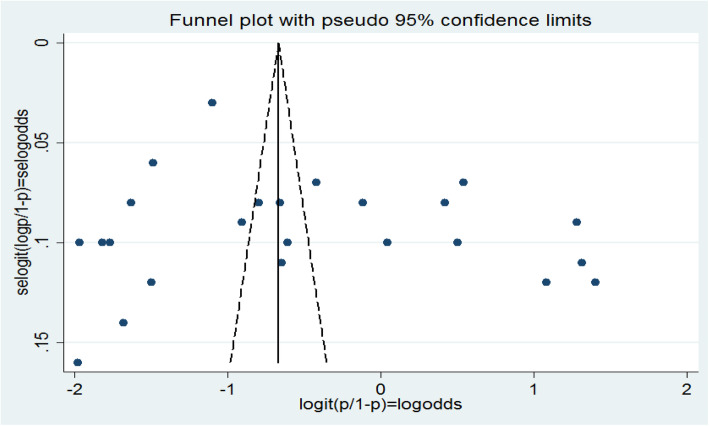
Methods: Studies were accessed through PubMed, Cochrane library, Web of Science, and Google Scholar. The funnel plot and Egger's regression test were used to see publication bias, and I-squared statistic was applied to check heterogeneity of studies. A weighted Dersimonian laired random effect model was applied to estimate the pooled national prevalence and the effect size of institutional delivery service utilization and associated factors.
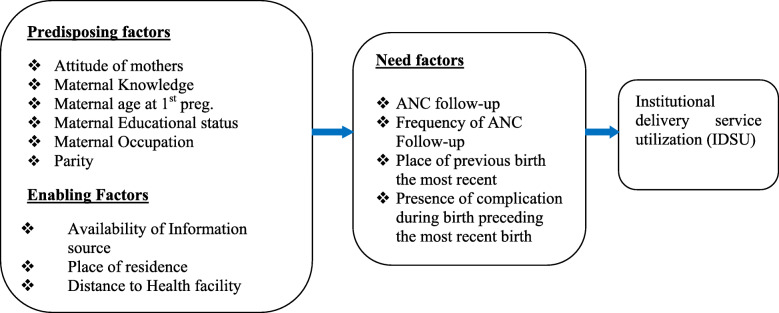
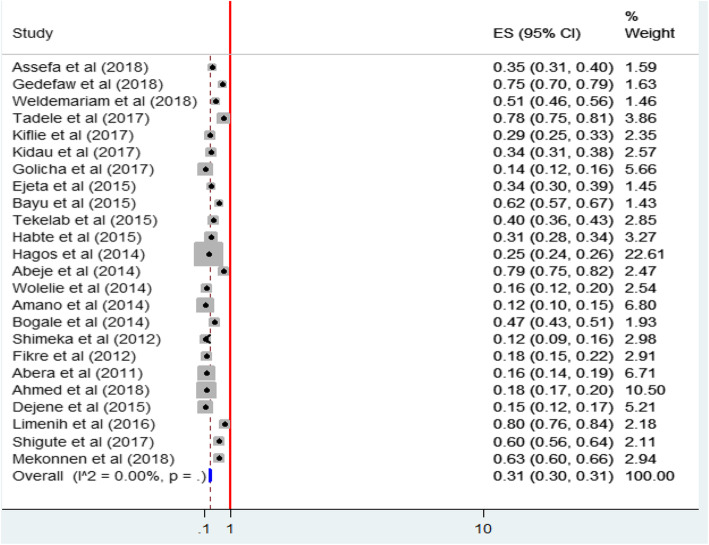
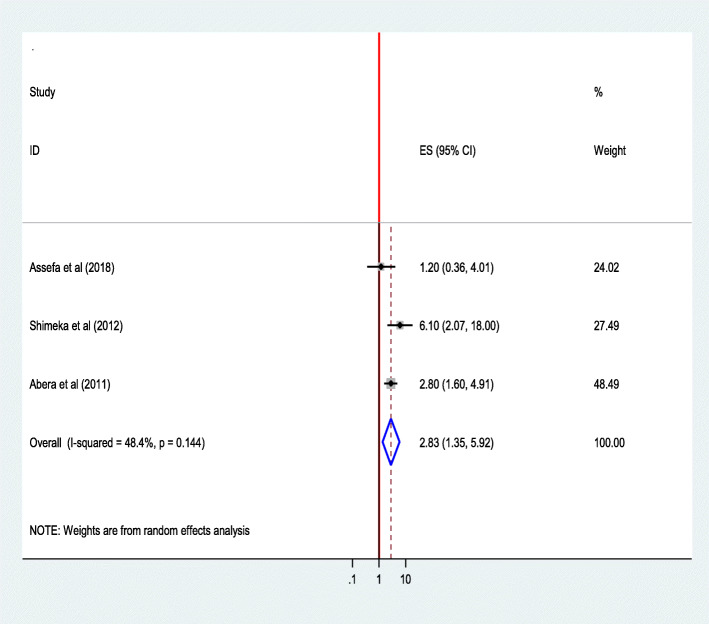
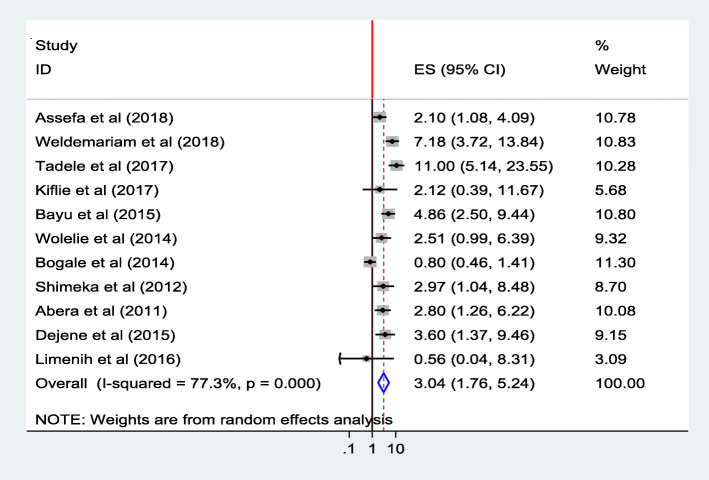
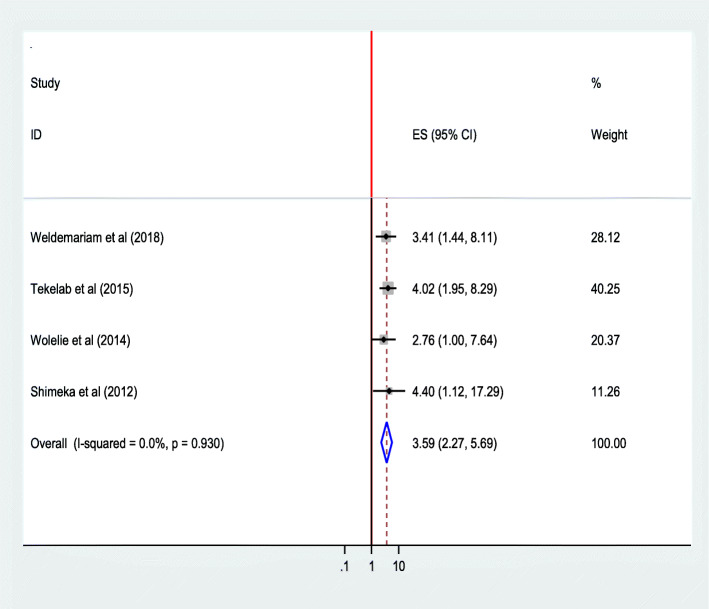
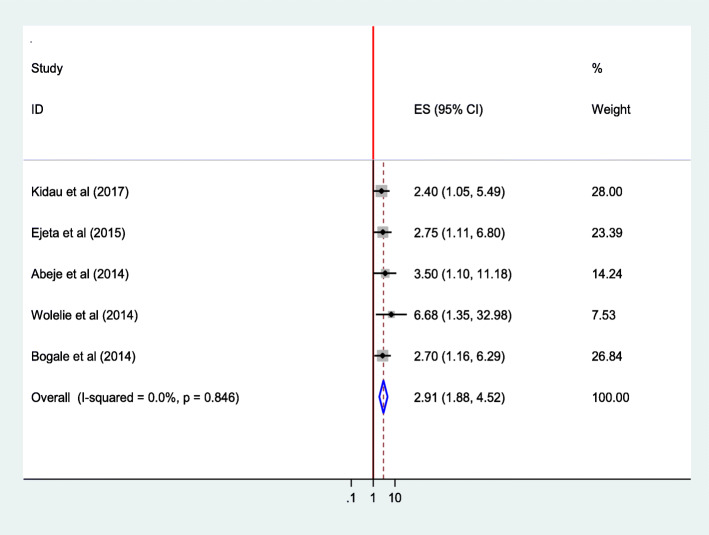
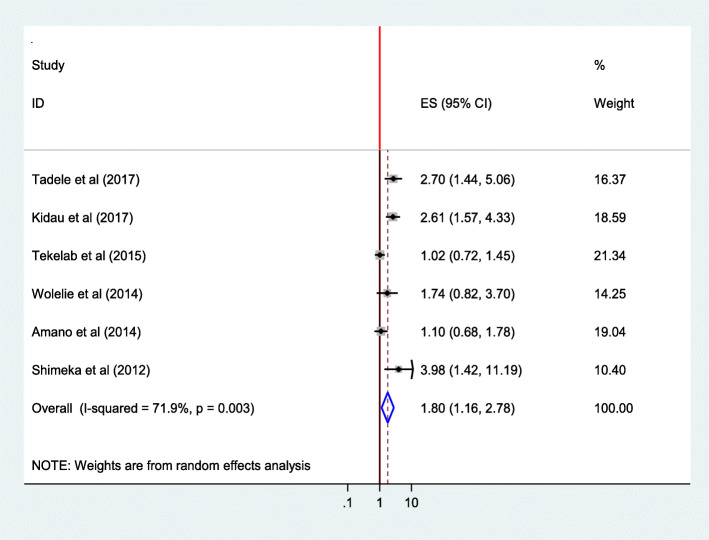
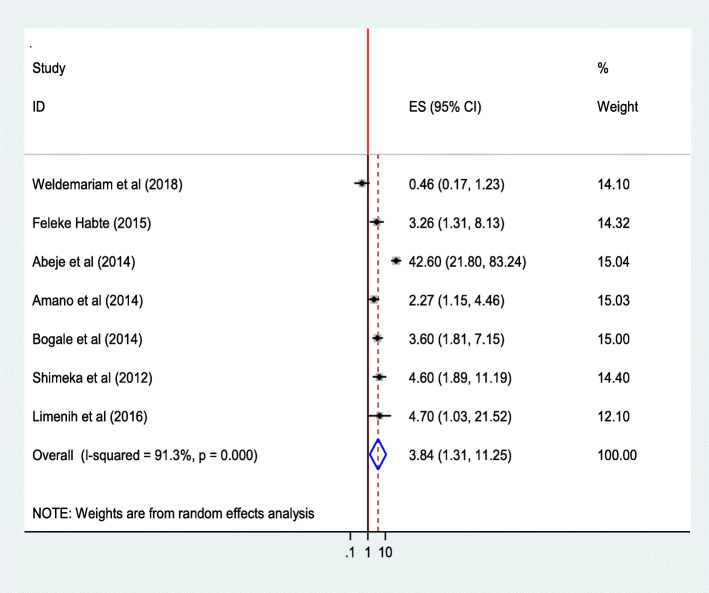
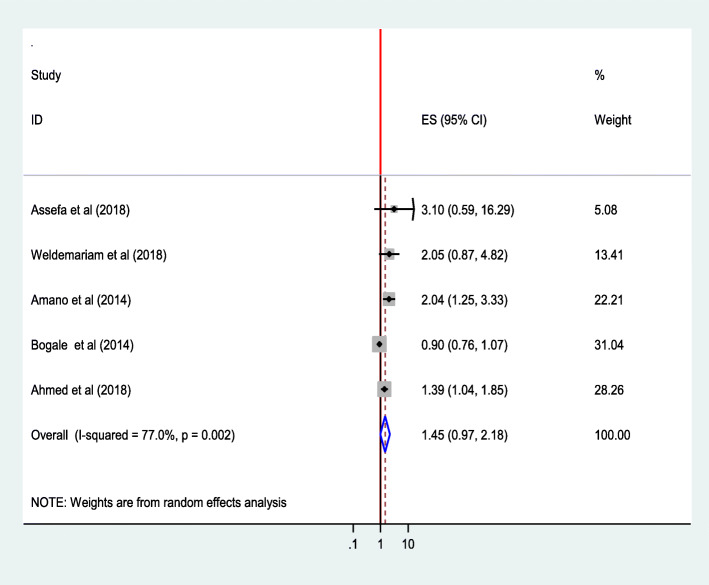
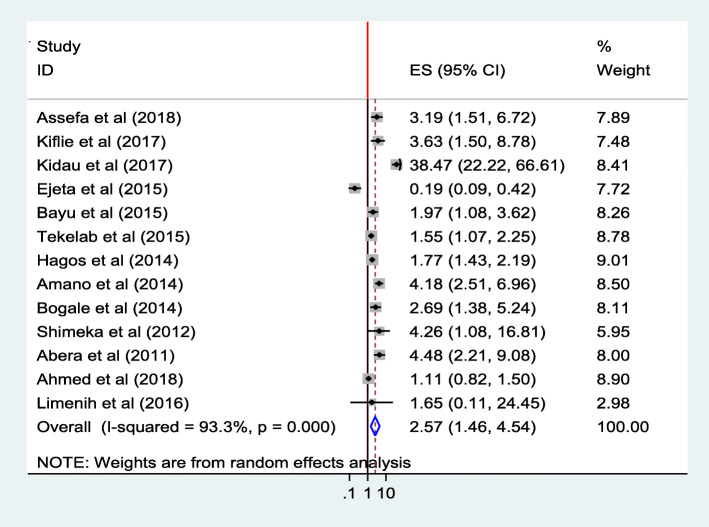
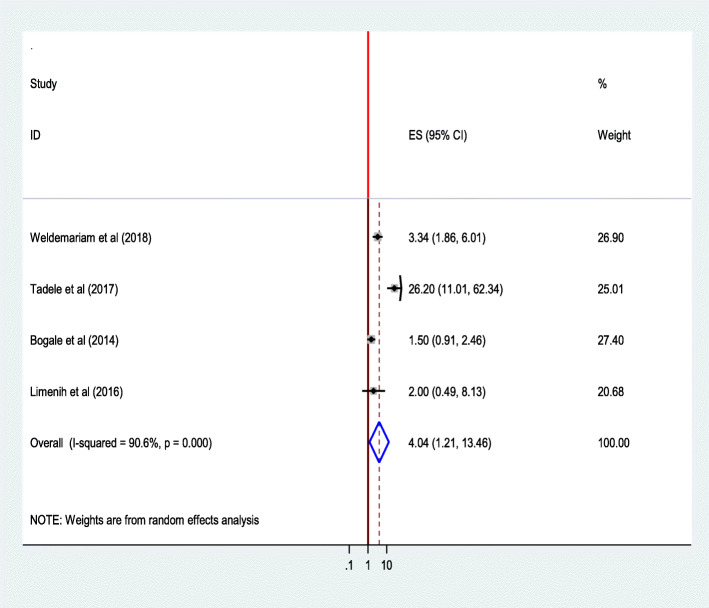
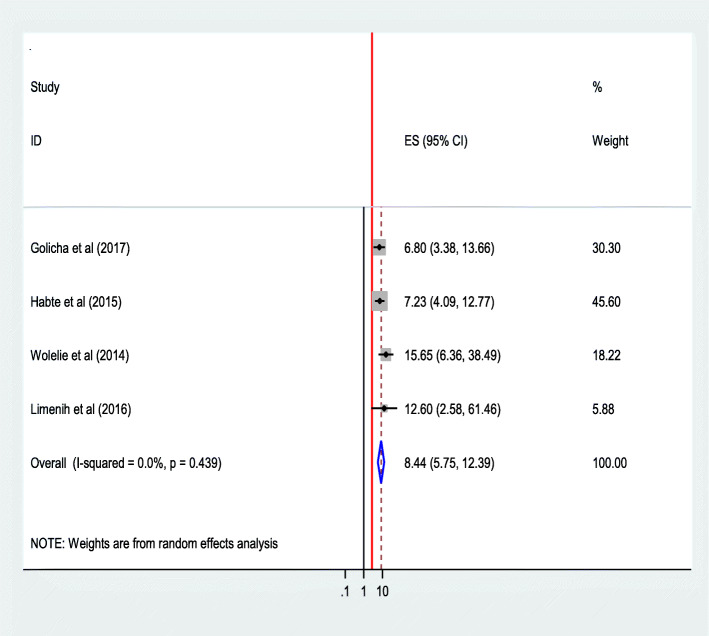
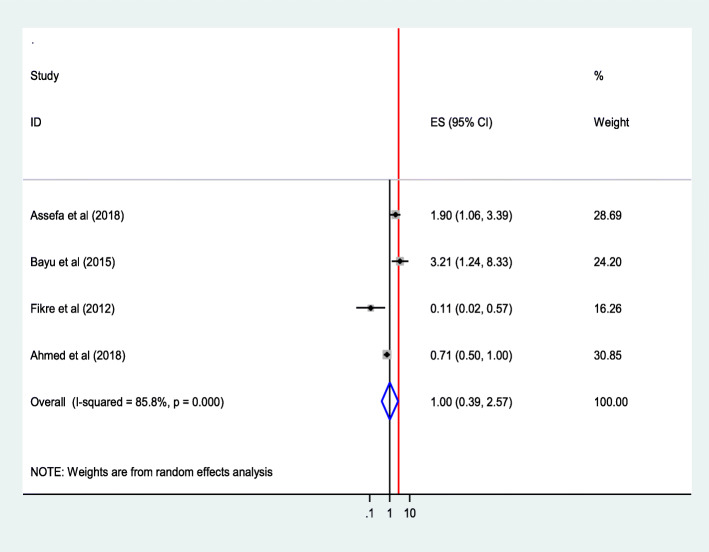
Result: Twenty four studies were included in this review. The pooled prevalence of institutional delivery service utilization was 31% (95% Confidence interval (CI): 30, 31.2%; I2 = 0.00%). Attitude towards institutional delivery (Adjusted Odd Ratio (AOR) = 2.83; 95% CI 1.35,5.92) in 3 studies, maternal age at first pregnancy (AOR = 3.59; 95% CI 2.27,5.69) in 4 studies, residence setting (AOR = 3.84; 95% CI 1.31, 11.25) in 7 studies, educational status (AOR = 2.91;95% 1.88,4.52) in 5 studies, availability of information source (AOR = 1.80;95% CI 1.16,2.78) in 6 studies, ANC follow-up (AOR = 2.57 95% CI 1.46,4.54) in 13 studies, frequency of ANC follow up (AOR = 4.04;95% CI 1.21,13.46) in 4 studies, knowledge on danger signs during pregnancy and benefits of institutional delivery (AOR = 3.04;95% CI 1.76,5.24) in 11 studies and place of birth of the elder child (AOR = 8.44;95% CI 5.75,12.39) in 4 studies were the significant predictors of institutional delivery service utilization.
Conclusion: This review found that there are several modifiable factors such as empowering women through education; promoting antenatal care to prevent home delivery; increasing awareness of women through mass media and making services more accessible would likely increase utilization of institutional delivery.
Keywords: Facility-based delivery; Skilled birth attendance; Women.
Conflict of interest statement
The authors declared that they have no competing interest.
Figures
Similar articles
-
Predictors of institutional delivery service utilization in Ethiopia: an umbrella review.BMC Pregnancy Childbirth. 2025 Mar 21;25(1):332. doi: 10.1186/s12884-025-07464-9. BMC Pregnancy Childbirth. 2025. PMID: 40119253 Free PMC article.
-
Determinants of institutional delivery service utilization in Ethiopia: a population based cross sectional study.BMC Public Health. 2020 Jul 8;20(1):1077. doi: 10.1186/s12889-020-09125-2. BMC Public Health. 2020. PMID: 32641020 Free PMC article.
-
Maternal and newborn health services utilization in Jimma Zone, Southwest Ethiopia: a community based cross-sectional study.BMC Pregnancy Childbirth. 2019 May 22;19(1):178. doi: 10.1186/s12884-019-2335-2. BMC Pregnancy Childbirth. 2019. PMID: 31113407 Free PMC article.
-
Institutional delivery service utilization in Munisa Woreda, South East Ethiopia: a community based cross-sectional study.BMC Pregnancy Childbirth. 2012 Oct 8;12:105. doi: 10.1186/1471-2393-12-105. BMC Pregnancy Childbirth. 2012. PMID: 23043258 Free PMC article.
-
The effect of antenatal care on use of institutional delivery service and postnatal care in Ethiopia: a systematic review and meta-analysis.BMC Health Serv Res. 2018 Jul 24;18(1):577. doi: 10.1186/s12913-018-3370-9. BMC Health Serv Res. 2018. PMID: 30041655 Free PMC article.
Cited by
-
Community perception of barriers and facilitators to institutional delivery care-seeking behavior in Northwest Ethiopia: a qualitative study.Reprod Health. 2022 Sep 20;19(1):193. doi: 10.1186/s12978-022-01497-5. Reprod Health. 2022. PMID: 36127709 Free PMC article.
-
Utilization of optimal antenatal care, institutional delivery, and associated factors in Northwest Ethiopia.Sci Rep. 2023 Jan 19;13(1):1071. doi: 10.1038/s41598-023-28044-x. Sci Rep. 2023. PMID: 36658260 Free PMC article.
-
Institutional delivery and associated factors in rural communities of Central Gondar Zone, Northwest Ethiopia.PLoS One. 2021 Jul 22;16(7):e0255079. doi: 10.1371/journal.pone.0255079. eCollection 2021. PLoS One. 2021. PMID: 34293052 Free PMC article.
-
Determinants and spatial distribution of institutional delivery in Ethiopia: evidence from Ethiopian Mini Demographic and Health Surveys 2019.Arch Public Health. 2022 Feb 21;80(1):65. doi: 10.1186/s13690-022-00825-2. Arch Public Health. 2022. PMID: 35189954 Free PMC article.
-
Predictors of institutional delivery service utilization in Ethiopia: an umbrella review.BMC Pregnancy Childbirth. 2025 Mar 21;25(1):332. doi: 10.1186/s12884-025-07464-9. BMC Pregnancy Childbirth. 2025. PMID: 40119253 Free PMC article.
References
-
- World Health Organization. Trends in maternal mortality: 1990-2015: estimates from WHO, UNICEF, UNFPA, World Bank Group and the United Nations Population Division: executive summary. World Health Organization. 2015. www.unfpa.org.
-
- Say L, et al. Global causes of maternal death: a WHO systematic analysis. Lancet Glob Health. 2014;2(6):e323–e333. - PubMed
-
- Hodorogea S, Friptu V. The Moldovan experience of maternal death reviews. BJOG. 2014;121:81–85. - PubMed
-
- Paily V, et al. Confidential review of maternal deaths in Kerala: a country case study. BJOG. 2014;121:61–66. - PubMed
-
- CSA AA, E . Ethiopia mini Demographic and health survey. 2014.
Publication types
MeSH terms
LinkOut - more resources
Full Text Sources
Medical
