

The effects of border control and quarantine measures on the spread of COVID-19
- PMID: 32540727
- PMCID: PMC7274973
- DOI: 10.1016/j.epidem.2020.100397
The effects of border control and quarantine measures on the spread of COVID-19
Abstract
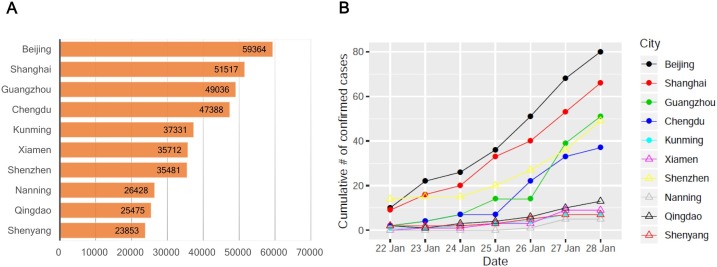
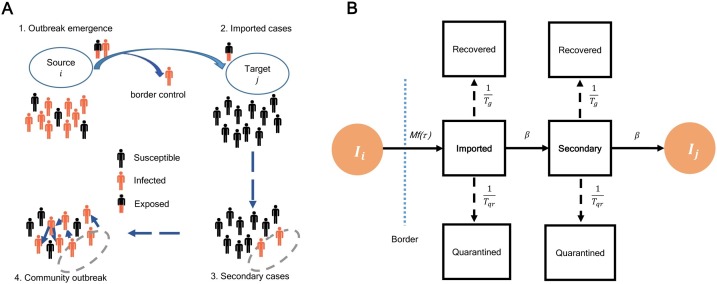
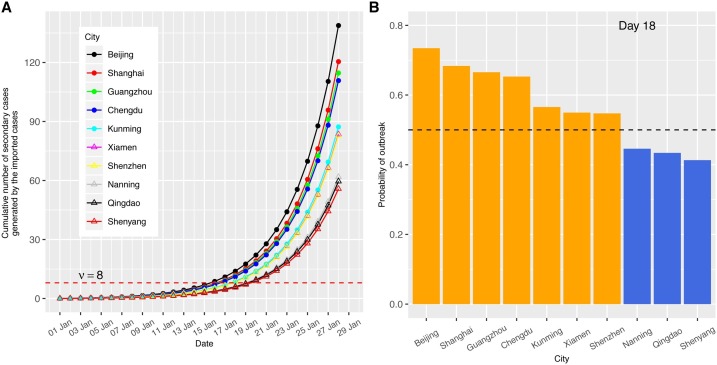
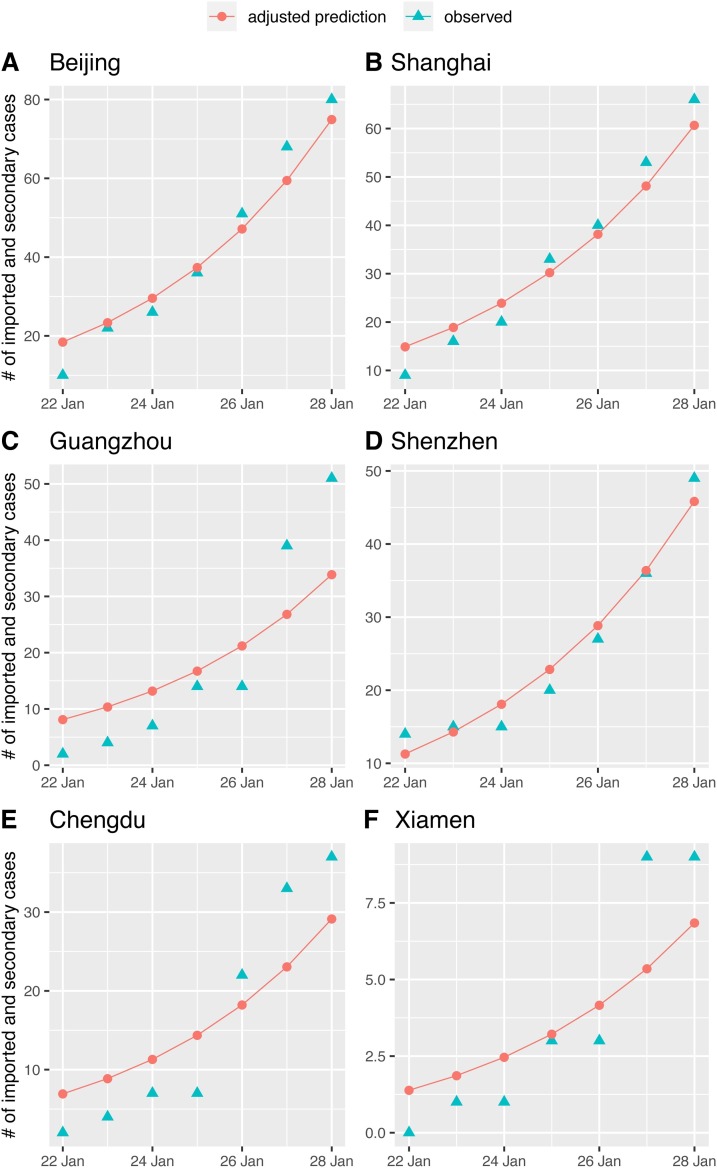
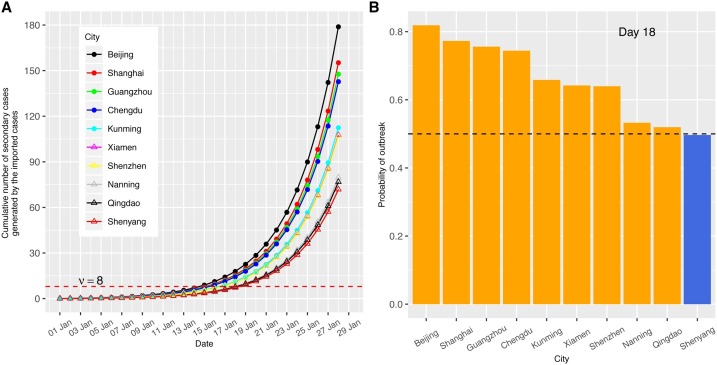
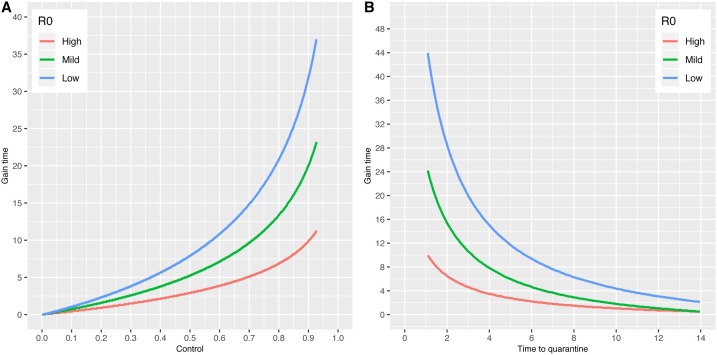
The rapid expansion of coronavirus disease 2019 (COVID-19) has been observed in many parts of the world. Many newly reported cases of COVID-19 during early outbreak phases have been associated with travel history from an epidemic region (identified as imported cases). For those cases without travel history, the risk of wider spreads through community contact is even higher. However, most population models assume a homogeneous infected population without considering that the imported and secondary cases contracted by the imported cases can pose different risks to community spread. We have developed an "easy-to-use" mathematical framework extending from a meta-population model embedding city-to-city connections to stratify the dynamics of transmission waves caused by imported, secondary, and others from an outbreak source region when control measures are considered. Using the cumulative number of the secondary cases, we are able to determine the probability of community spread. Using the top 10 visiting cities from Wuhan in China as an example, we first demonstrated that the arrival time and the dynamics of the outbreaks at these cities can be successfully predicted under the reproduction number R0 = 2.92 and incubation period τ = 5.2 days. Next, we showed that although control measures can gain extra 32.5 and 44.0 days in arrival time through an intensive border control measure and a shorter time to quarantine under a low R0 (1.4), if the R0 is higher (2.92), only 10 extra days can be gained for each of the same measures. This suggests the importance of lowering the incidence at source regions together with infectious disease control measures in susceptible regions. The study allows us to assess the effects of border control and quarantine measures on the emergence and global spread of COVID-19 in a fully connected world using the dynamics of the secondary cases.
Copyright © 2020 The Author(s). Published by Elsevier B.V. All rights reserved.
Conflict of interest statement
All authors declare no competing interests.
Figures
References
-
- World Health Organization (WHO) 2020. Pneumonia of unknown cause - China. https://www.who.int/csr/don/05-january-2020-pneumonia-of-unkown-cause-ch...
-
- World Health Organization (WHO). Coronavirus disease (COVID-19) outbreak. https://www.who.int/emergencies/diseases/novel-coronavirus-2019.
-
- Chan Jasper Fuk-Woo, Yuan Shuofeng, Kok Kin-Hang, To Kelvin Kai-Wang, Chu Hin, Yang Jin, Xing Fanfan, Liu Jieling, Yip Cyril Chik-Yan, Poon Rosana Wing-Shan. A familial cluster of pneumonia associated with the 2019 novel coronavirus indicating person-to-person transmission: a study of a family cluster. The Lancet. 2020;6736(20):1–10. - PMC - PubMed
-
- The Guardian . 2020. Coronavirus map: how Covid-19 is spreading across the world. https://www.theguardian.com/world/ng-interactive/2020/feb/26/coronavirus....
-
- Center for Disease Control and Prevention (CDC) 2020. Coronavirus in Japan. https://wwwnc.cdc.gov/travel/notices/alert/coronavirus-japan.
Publication types
MeSH terms
LinkOut - more resources
Full Text Sources
Medical
