. 2020 Jul 15;205(2):489-501.
doi: 10.4049/jimmunol.2000085. Epub 2020 Jun 15.

Hypercapnia Suppresses Macrophage Antiviral Activity and Increases Mortality of Influenza A Infection via Akt1

Affiliations

Hypercapnia Suppresses Macrophage Antiviral Activity and Increases Mortality of Influenza A Infection via Akt1

S Marina Casalino-Matsuda et al. J Immunol. .

Abstract

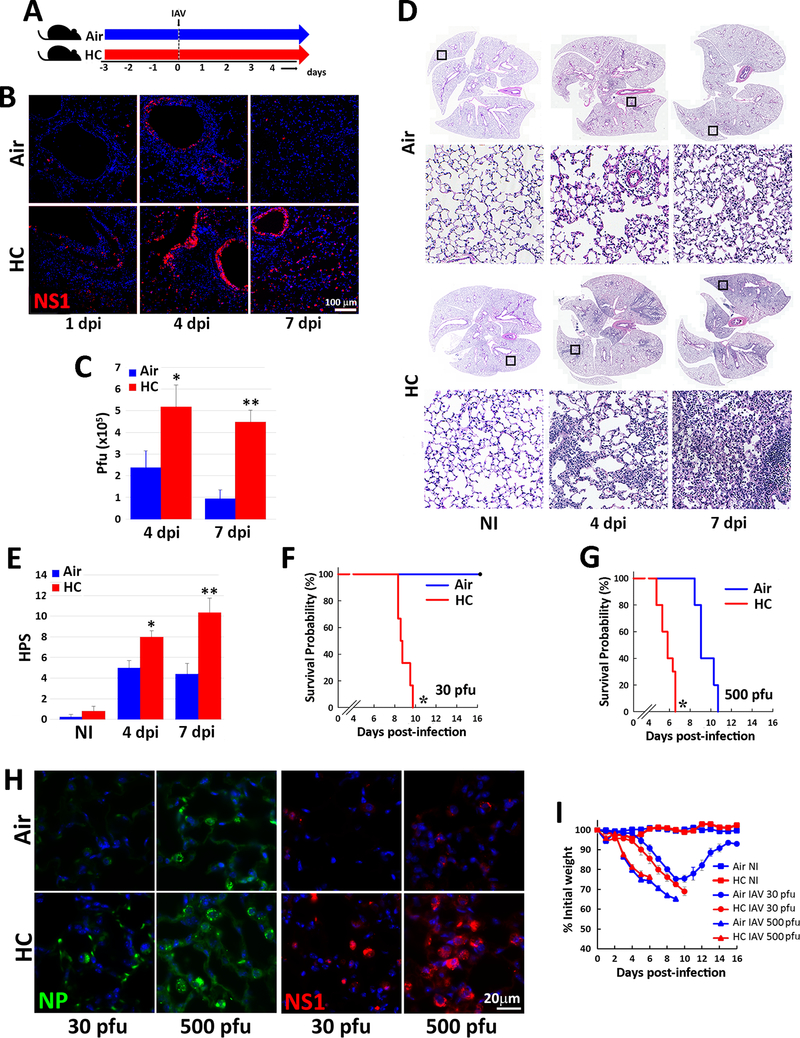
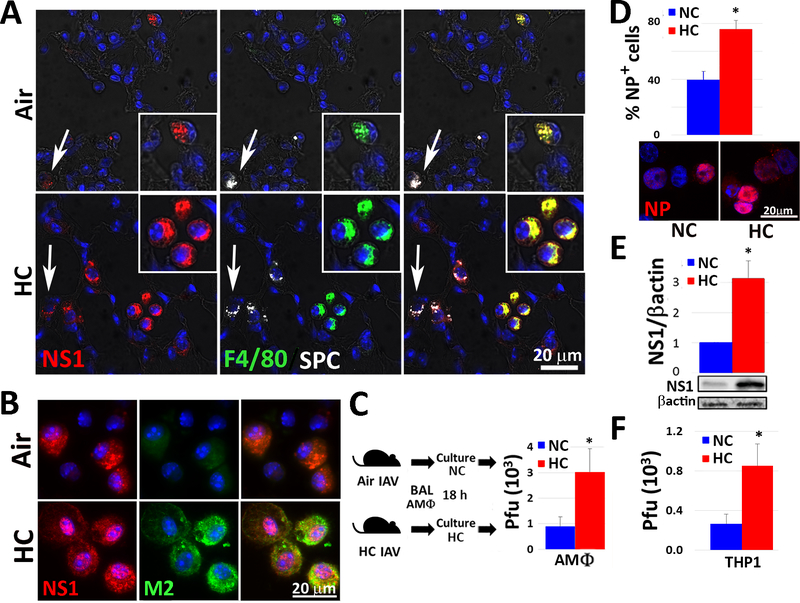
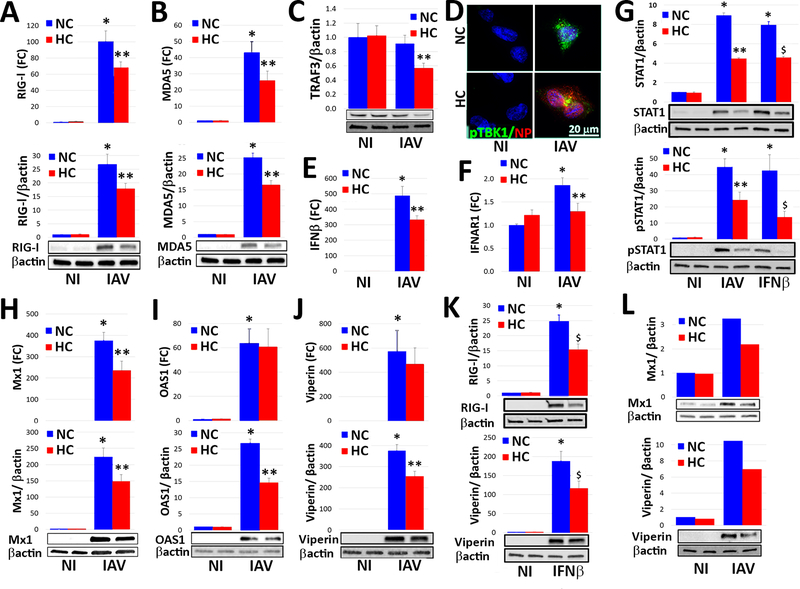
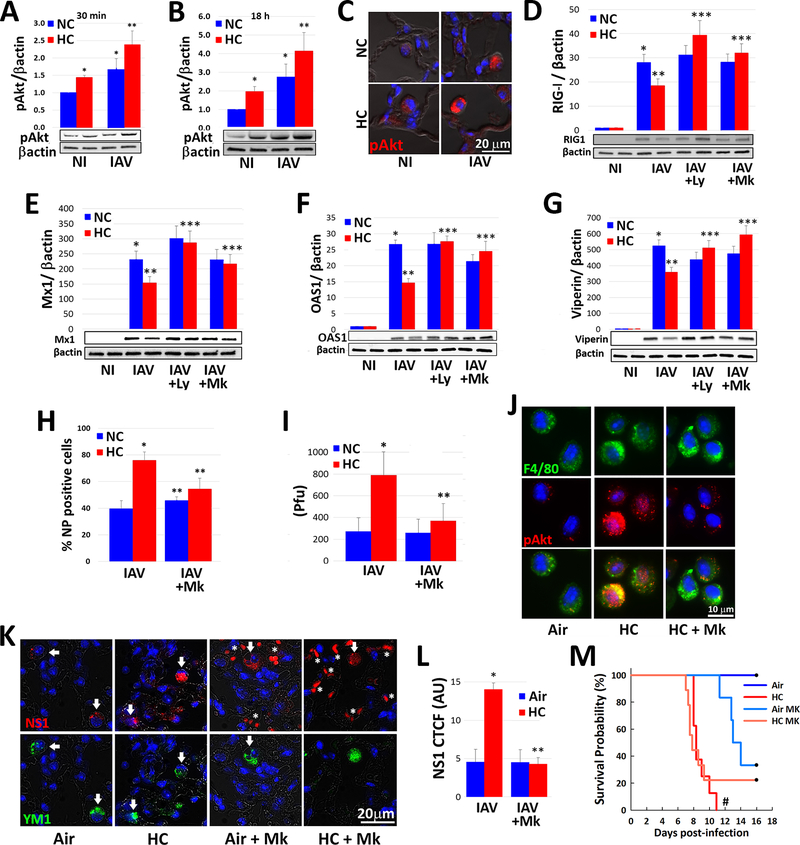
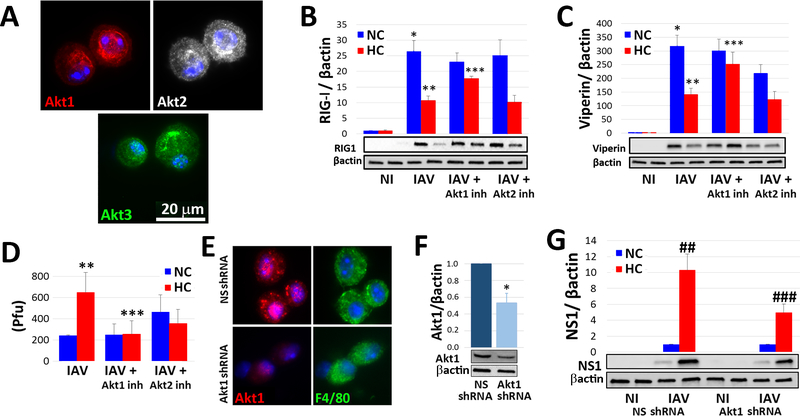
Hypercapnia (HC), elevation of the partial pressure of CO2 in blood and tissues, is a risk factor for mortality in patients with severe acute and chronic lung diseases. We previously showed that HC inhibits multiple macrophage and neutrophil antimicrobial functions and increases the mortality of bacterial pneumonia in mice. In this study, we show that normoxic HC increases viral replication, lung injury, and mortality in mice infected with influenza A virus (IAV). Elevated CO2 increased IAV replication and inhibited antiviral gene and protein expression in macrophages in vivo and in vitro. HC potentiated IAV-induced activation of Akt, whereas specific pharmacologic inhibition or short hairpin RNA knockdown of Akt1 in alveolar macrophages blocked HC's effects on IAV growth and the macrophage antiviral response. Our findings suggest that targeting Akt1 or the downstream pathways through which elevated CO2 signals could enhance macrophage antiviral host defense and improve clinical outcomes in hypercapnic patients with advanced lung disease.


Figures

Fig. 1:
Fig. 1:. Hypercapnia increases viral protein expression, viral replication, lung inflammation and mortality in IAV-infected mice.
Mice were pre-exposed to normoxic hypercapnia (10% CO2/21% O2, HC) for 3 days, or air as control, then infected intratracheally with 30 (B-F, H) or 500 (G, H) pfu IAV (A/WSN/33) per animal (A). Expression of viral NS1 protein (red) was assessed by immunofluorescence microscopy (IF) of lung tissue sections from mice sacrificed 1, 4 or 7 dpi; nuclei were stained with DAPI (blue), n=4–6; results representative of at least 2 independent experiments (B). Viral titers in homogenized lung tissue were determined by plaque assay at 4 and 7 dpi, mean ± SEM, n=6–10 from at least 3 independent experiments, *P<0.05 vs air 4 dpi, **P<0.05 vs air 7 dpi (C). Lungs from non-infected (NI) or IAV-infected mice harvested 4 or 7 dpi were sectioned and stained with H&E, n=4–6; results representative of at least 3 independent experiments (D), and images were assessed blindly to determine histophatologic scores (HPS) for lung injury, mean ± SEM n=4–6; results representative of at least 3 independent experiments, *P<0.05 vs air 4 dpi, **P<0.05 vs air 7 dpi (E). Kaplan-Meier plots showing survival after infection with 30 (F) or 500 (G) pfu IAV; n= 6–10 mice combined from 3 independent experiments, *P<0.05 vs. air by log-rank test. Lung expression of viral NP (green) and NS1 (red) protein in lungs 4 dpi with 30 or 500 pfu IAV (H), n=4–6; results representative of at least 2 independent experiments. Body weight change over time in animals NI or infected with 30 or 500 pfu IAV (I), n= 6–10 mice combined from 3 independent experiments.
Fig. 2:
Fig. 2:. Hypercapnia increases viral protein expression and viral replication in alveolar macrophages following IAV infection of mice and in IAV-infected human THP-1 macrophages.
Mice were pre-exposed to air or normoxic hypercapnia (10% CO2/21% O2, HC) and infected with IAV (30 pfu), as in Fig. 1A. Animals were sacrificed 4 dpi, and lung tissue sections were stained for viral NS1 (red), F4/80 (green, MØs), SPC (white, AT2 cells) and nuclei (blue); inserts show enlarged view of AMØs, white arrows indicate AT2 cells, n=4–6; results representative of at least 2 independent experiments (A). AMØs obtained by BAL 1 dpi were stained for viral NS1 (red), M2 (green) and nuclei (blue), n=6; results representative of 3 independent experiments (B), or cultured under normocapnic (5% CO2/95% air, NC) or hypercapnic (15% CO2/21% O2/64% N2, HC) conditions for 18 h, after which viral titers in culture supernatants were determined by plaque assay, mean ± SEM, n=6 from 3 independent experiments (C). Differentiated THP-1 MØs were pre-exposed to NC or NC for 2 h, infected with IAV (MOI 2), and cultured in NC or HC for an additional 18 h. THP-1 MØs were then stained for viral NP (red) and the percentage of NP-positive cells was determined (D) or lysed for determination of viral NS1 expression by immunoblot (E) and viral titers in culture supernatants were determined by plaque assay (F); mean ± SEM, n = 4 from 4 independent experiments. *P<0.05 vs. NC + IAV.
Fig. 3
Fig. 3. Hypercapnia inhibits IAV-induced expression and activation of key mediators of the interferon pathway antiviral response in macrophages.
Differentiated THP-1 MØs or human AMØs were infected with IAV (MOI 2) (A-J, L) or stimulated with recombinant human IFN-β (10 U/ml) (G, K), and cultured in 5% CO2 (NC) or 15% CO2 (HC) for 18 h. Cells were then processed for determination of mRNA expression, expressed as fold change (FC) over non infected (NI) controls; protein expression by immunoblot, with β-actin as loading control; or IF microscopy. Expression of mRNA and/or protein is shown for RIG-I (A, K top), MDA5 (B), TRAF3 (C), IFN-β (E), IFNAR1 (F), total and phosphorylated STAT1 (G), Mx1 (H), OAS1 (I) and viperin (J, K) in control THP-1 MØs and those infected with IAV (A-C, E-J) or stimulated with IFN-β (G, K bottom). Mean ± SEM, n = 4–6 from at least 4 independent experiments; *P<0.01 vs. NI, **P<0.05 vs. NC + IAV, $ P<0.05 vs. NC + IFN-β. Expression of viral NP (red) and phosphorylated TBK1 (pTBK1, green) was assessed by IF microscopy in control and IAV-infected THP-1 MØs, n=4; results representative of 4 independent experiments (D). Expression of Mx1 and viperin protein is shown for control and IAV-infected human AMØs n=2; results from 2 independent experiments (L).
Fig. 4:
Fig. 4:. Hypercapnia potentiates IAV-induced activation of Akt, which mediates hypercapnia-induced suppression of the antiviral response and increased IAV replication in human and mouse macrophages.
Differentiated THP-1 MØs were pre-exposed to 5% CO2 (NC) or 15% CO2 (HC) for 2 h, infected with IAV, and cultured for 30 min (A) or 18 h (B) prior to assessment of Ak1/Akt2/Akt3 phosphorylation at S473/S475/S472 (pAkt) by immunoblot, mean ± SEM, n = 4–6 from at least 4 independent experiments. Additionally, mice pre-exposed to air or normoxic hypercapnia (10% CO2/21% O2, HC) and infected with IAV (30 pfu), as in Fig. 1A were sacrificed at 1 dpi, and Ak1/Akt2/Akt3 phosphorylation at S473/S475/S472 (pAkt, red) was assessed by IF microscopy in lung tissue sections; nuclei were labeled with DAPI (blue), n=3–4, results representative of at least 2 independent experiments (C). THP-1 MØs pre-exposed to NC or HC were also infected with IAV in the absence and presence of the PI3K inhibitor, LY294002 (Ly, 10 μM), or the pan-Akt inhibitor, MK2206 (Mk, 5 μM), and cultured in NC or HC for an additional 18 h, then analyzed for expression of RIG-I (D), Mx1 (E), OAS1 (F) and viperin (G) protein by immunoblot; mean ± SEM, n = 5 from 5 independent experiments, *p<0.05 vs NI; **p<0.05 vs NC + IAV; ***p<0.05 vs HC + IAV. Cells were also immunostained for determination of the percentage of NP-positive cells by IF microscopy (H), and viral titers in culture supernatants were determined by plaque assay (I); mean ± SEM, n = 5 from 5 independent experiments *p<0.05 vs NC + IAV, **p<0.05 vs HC + IAV. Mice were treated with MK2206 (120 mg/kg) or vehicle control by oral gavage were exposed to HC, or air as control for 24 h, then AMØs obtained by BAL were immnostained for phosphorylation of Ak1/Akt2/Akt3 at S473/S475/S472 (pAkt, red); F4/80 (green) was used as MØ marker and nuclei were stained with DAPI (blue), n=3–4, results representative of at least 2 independent experiments (J). Other mice treated with MK2206 or vehicle were exposed to HC for 3 days, or air as control, then infected with IAV (30 pfu/animal) and maintained in air or HC for survival analysis. In addition, mice in each group were sacrificed at 7 dpi, at which point viral NS1 (red) expression in lung tissue sections was assessed; YM1 was used as AMØ marker (green), nuclei were stained with DAPI (blue); white arrows indicate AMØs, asterisks denote autofluorescent RBCs (red) (K), n=5, results representative of at least 2 independent experiments. Viral NS1 protein in AMØs in lung tissue was quantified as corrected total cell fluorescence (CTCF), expressed in arbitrary units (AU); mean ± SEM, n = 5 from at least 2 independent experiments, *p<0.05 vs NC + IAV, **p<0.05 vs HC + IAV (L). Kaplan-Meier plot showing survival after infection (M); mean ± SEM, n = 5 from at least 2 independent experiments, #p<0.05 vs Air + IAV by log-rank test.
Fig. 5:
Fig. 5:. Hypercapnia-induced suppression of the macrophage antiviral response is mediated by Akt1.
AMØs obtained by BAL from untreated mice were immunostained with isoform-specific antibodies for Akt1 (red), Akt2 (white) and Akt3 (green); nuclei were stained with DAPI (blue), n=5, results representative of at least 3 independent experiments (A). Differentiated THP-1 MØ were exposed to 5% CO2 (NC) or 15% CO2 (HC) in the absence or presence of specific inhibitors of Akt1 or Akt2, A674563 (50 nM) and CCT128930 (1 μM), respectively, and infected with IAV (MOI 2). Expression of RIG-I (B) and viperin (C) protein was assessed by immunoblot, and viral titers in culture supernatants were assessed by plaque assay (D); mean ± SEM, n = 4 from 4 independent experiments, *p<0.05 vs NC NI; **p<0.05 vs NC + IAV; ***p<0.05 vs HC + IAV. In additional experiments, mice were infected intranasally with lentivirus containing non-silencing (NS) shRNA or Akt1-targeted shRNA, and 21 days later AMØs were collected by BAL and immunostained for Akt1 (red) and F4/80 (green, MØ marker) (E) or lysed to measure Akt1 expression by immunoblot (F), n=4, results representative of at least 2 independent experiments. Alternatively, AMØs from the shRNA-treated animals were cultured in NC or HC, infected with IAV (MOI 2), and 18 h later processed for quantitation of viral NS1 protein by immunoblot (G); n=4, results representative of at least 2 independent experiments, *p<0.05 vs NS shRNA, ##p<0.05 vs NS shRNA + IAV in NC, ### p<0.05 vs NS shRNA + IAV in HC.

References

    1. Heron M 2019. Deaths: Leading Causes for 2017. National Vital Statistics Reports 68: 1–74. - PubMed
    1. 2018. The top 10 causes of death. World Health Organization, https://www.who.int/news-room/fact-sheets/detail/the-top-10-causes-of-death.
    1. Moser KM, Shibel EM, and Beamon AJ 1973. Acute respiratory failure in obstructive lung disease. Long-term survival after treatment in an intensive care unit. JAMA 225: 705–707. - PubMed
    1. Martin TR, Lewis SW, and Albert RK 1982. The prognosis of patients with chronic obstructive pulmonary disease after hospitalization for acute respiratory failure. Chest 82: 310–314. - PubMed
    1. Goel A, Pinckney RG, and Littenberg B 2003. APACHE II predicts long-term survival in COPD patients admitted to a general medical ward. Journal of general internal medicine 18: 824–830. - PMC - PubMed

Publication types

Substances