. 2020 Jul 7;117(27):15818-15826.
doi: 10.1073/pnas.2006348117. Epub 2020 Jun 15.

Clonally expanding smooth muscle cells promote atherosclerosis by escaping efferocytosis and activating the complement cascade

Affiliations

Clonally expanding smooth muscle cells promote atherosclerosis by escaping efferocytosis and activating the complement cascade

Ying Wang et al. Proc Natl Acad Sci U S A. .

Abstract

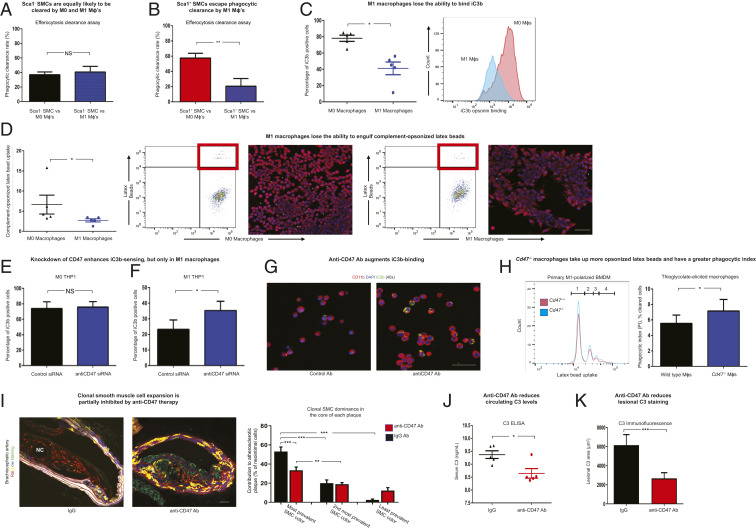
Atherosclerosis is the process underlying heart attack and stroke. Despite decades of research, its pathogenesis remains unclear. Dogma suggests that atherosclerotic plaques expand primarily via the accumulation of cholesterol and inflammatory cells. However, recent evidence suggests that a substantial portion of the plaque may arise from a subset of "dedifferentiated" vascular smooth muscle cells (SMCs) which proliferate in a clonal fashion. Herein we use multicolor lineage-tracing models to confirm that the mature SMC can give rise to a hyperproliferative cell which appears to promote inflammation via elaboration of complement-dependent anaphylatoxins. Despite being extensively opsonized with prophagocytic complement fragments, we find that this cell also escapes immune surveillance by neighboring macrophages, thereby exacerbating its relative survival advantage. Mechanistic studies indicate this phenomenon results from a generalized opsonin-sensing defect acquired by macrophages during polarization. This defect coincides with the noncanonical up-regulation of so-called don't eat me molecules on inflamed phagocytes, which reduces their capacity for programmed cell removal (PrCR). Knockdown or knockout of the key antiphagocytic molecule CD47 restores the ability of macrophages to sense and clear opsonized targets in vitro, allowing for potent and targeted suppression of clonal SMC expansion in the plaque in vivo. Because integrated clinical and genomic analyses indicate that similar pathways are active in humans with cardiovascular disease, these studies suggest that the clonally expanding SMC may represent a translational target for treating atherosclerosis.

Keywords: CD47; atherosclerosis; clonality; efferocytosis; smooth muscle cells.


Conflict of interest statement

Competing interest statement: I.L.W. and N.J.L. are cofounders of Forty Seven, Inc., an immunooncology company. This company was recently acquired by Gilead Sciences; the purchase did not include stock in Gilead. I.L.W. and N.J.L. do not currently have any consulting agreement with Gilead Sciences.

Figures

Fig. 1.
Fig. 1.
Atherosclerosis is associated with the clonal expansion of dedifferentiated smooth muscle cells which express complement C3. (A) Representative confocal images from multicolor Rainbow lineage-tracing mice exposed to a high-fat Western diet to induce atherogenesis (n ≥ 7 mice per time point). This model constitutively labels all nonsmooth muscle cells with green fluorescent protein (GFP) and randomly labels all SMC-derived cells (and their progeny) red, blue, or yellow to demonstrate clonal expansion, as shown (Top) (see details in SI Appendix, Fig. S1A). Serial sections are stained for the putative stem cell marker, stem cell antigen-1 (Sca1), as shown (Bottom). (B) Quantitative fluorescence-activated cell-sorting analyses demonstrate changes in Sca1-expressing SMCs in the aortic arch (including cells from the plaque and the underlying media) during atherogenesis (n = 9 per time point). (C) Serial sections demonstrate the physical proximity of the dominant SMC clone to the inflammatory necrotic core (NC), and the distinction between Sca1+ SMCs and SMCs which express “macrophage-specific” markers such as Mac2 (see additional examples in SI Appendix, Fig. S1G). (D) Pathway analyses of single-cell RNA-seq data from Sca1+ SMCs isolated from lesions of single-color Tomato lineage-tracing mice demonstrate that the Sca1+ SMC is highly dedifferentiated, down-regulates its contractile machinery, and up-regulates factors related to innate immunity and the classical complement cascade. (E) Among the individual genes which are differentially regulated in the Sca1+ SMC cluster, complement C3 is up-regulated 4.4-fold (node size is proportional to fold change; complement factors are highlighted in blue, and factors related to stem cell biology are highlighted in red). Comparisons are made by one-way ANOVA with Tukey’s post hoc analysis. ***P < 0.001, **P < 0.01, *P < 0.05. Error bars represent the SEM. (Scale bars, 50 μm.)
Fig. 2.
Fig. 2.
C3 is associated with risk for clinical cardiovascular disease and is expressed on dedifferentiated SMCs in human atherosclerotic plaque. (A) Using data from n = 1,003 individuals from the PIVUS study, circulating C3 levels were found to be associated with increased carotid intimal–medial thickness, impaired endothelial function, and increased major adverse cardiovascular events in age- and sex-adjusted models. (B) Serial sections obtained from the plaques of human subjects undergoing carotid endarterectomy were stained for C3 expression (green) to identify proximity to the necrotic core (trichrome) and differentiated α-SMA–expressing SMCs (red; n = 6 samples). (C) A permanent proximity ligation assay-based epigenetic probe that “lineage tags” cells which previously expressed MYH11 was used to identify human cells of putative SMC origin (red). Human carotid plaque samples are used to show C3 staining (yellow) on cells which do not express α-SMA (green) but are presumably of SMC origin (red) in the neointima (Top). Fibrotic cap samples are used to show the lack of C3 staining on differentiated SMCs (indicated by simultaneous α-SMA and in situ hybridization-proximity ligation assay [ISH-PLA] signal) (Bottom). (D) By intersecting the list of murine Sca1+ SMC-associated genes (Fig. 1E) with multitissue RNA-seq data obtained from n = 672 individuals in the STARNET study, we observed enrichment of genes associated with the Sca1+ SMC in a distinct subset of human coexpression modules. Several identified modules were specific to vascular tissue and subjects with angiographically confirmed coronary artery disease. (E) The highlighted module (106) was solely expressed in atherosclerotic aorta (AOR) and mammary artery tissue (MAM) (as opposed to nonvascular tissues: blood [BLOOD], liver [LIV], skeletal muscle [SKLM], visceral abdominal fat [VAF], and subcutaneous fat [SF]), differentially expressed in subjects with CAD compared with controls, and correlated with quantitative measures of plaque burden such as Duke and SYNTAX score. Bayesian network modeling indicates that module 106 is driven by several complement factors, including the hub driver gene C3 expressed in AOR tissue. (Scale bars, 50 μm [white] and 10 μm [red].)
Fig. 3.
Fig. 3.
C3 produced by lesional SMCs induces both pro- and antiatherosclerotic changes in neighboring cells. (A) ELISA analyses demonstrate C3 levels in the secretome of Sca1+ and Sca1 SMCs primarily cultured from atherosclerotic plaques of Tomato mice (n = 5 per condition). (B) Boyden chamber assays using murine RAW 264.7 macrophages (nuclei stained blue) demonstrate migration rates toward chemotactic factors in the conditioned medium secreted by primary Sca1+ and Sca1 murine SMCs before (Left) and after (Right) C3 immunoprecipitation/depletion (n = 5 per condition, hpf: high power field). (C) FACS histograms demonstrate C3/C3b/iC3b opsonin signals on lesional murine Sca1+ and Sca1 SMCs quantified by the geometric mean of cell-surface fluorescence intensity (n = 10 per condition). (D) FACS-based Edu-incorporation assays demonstrate the proliferation rates of Sca1+ and Sca1 SMCs primarily isolated from atherosclerotic lesions of Tomato mice fed an HFD for 18 wk. (D, Left) Percentage of cells entering the S phase of mitosis. (D, Right) Cell-cycle analyses of cells in the S and G2/M phases (n = 7 per condition). (E) FACS-based efferocytosis assays demonstrate the susceptibility of freshly isolated Sca1+ and Sca1 SMCs to phagocytic clearance by healthy murine M0 RAW 264.7 macrophages (Left; n = 7). Representative histograms (Right) show the relative numbers of diseased (Annexin+/Tomato+) Sca1 (Left) and Sca1+ (Right) SMCs before (red) and after (blue) presentation to healthy RAW 264.7 phagocytes. Comparisons are made by two-tailed paired t tests in A, D, and E, Wilcoxon signed-rank test in C, and one-way ANOVA with Tukey’s post hoc analysis in B. ***P < 0.001, **P < 0.01, *P < 0.05. Error bars represent the SEM.
Fig. 4.
Fig. 4.
Blockade of CD47 normalizes the ability of polarized macrophages to recognize complement-opsonized targets, suppresses clonal expansion, and prevents atherosclerosis. (A) FACS analyses demonstrate that apoptotic murine Sca1 SMCs freshly isolated from atherosclerotic lesions were cleared at equivalent rates by healthy M0 and inflammatory M1 murine RAW 264.7 macrophages (n = 7 per condition). (B) In contrast, FACS analyses demonstrated that the clearance rate of apoptotic Sca1+ SMCs by M1 macrophages was significantly lower than that by healthy M0 RAW 264.7, despite being opsonized (n = 7 per condition). (C) Compared with basal conditions, M1-polarized THP-1 macrophages were found to have reduced ability to bind iC3b, the opsonin that marks apoptotic cells for complement-dependent efferocytosis (n = 5 per condition). Representative histograms indicate a left shift of fluorescently labeled iC3b on M1 (blue) compared with M0 (red) THP-1 macrophages. (D) FACS engulfment assays demonstrate the capacity of M0 and polarized M1 human THP-1 macrophages to take up complement-opsonized latex beads (n = 5 per condition; representative FACS panels; Left). Confirmatory confocal microscopy images (Right) of RAW 264.7 macrophages (red) reveal that M1 macrophages bind fewer complement-opsonized latex beads (green) after 30 min of coculture. (E) FACS assays demonstrate equivalent binding of fluorescently labeled iC3b to human M0 THP-1 cells before and after CD47 knockdown (P = 0.56; n = 4 per condition). (F) Conversely, knockdown of CD47 increases the capacity of CD47hi human M1 THP-1 cells to bind iC3b (n = 4 per condition). (G) Representative confocal microscopy images demonstrate that inhibitory anti-CD47 antibodies augment iC3b (green) binding to cell-surface CD11b (red) on human M1 THP-1 cells, relative to cells treated with IgG control Ab (n = 3 per condition). (H) Representative histograms (Left) indicate that M1-polarized bone marrow-derived macrophages (BMDMs) isolated from CD47 knockout mice (blue) take up more complement-opsonized latex beads than cells isolated from WT mice (red; the number of latex bead[s] taken up is indicated on the x axis, and the number of phagocytes is indicated on the y axis). Similarly, FACS-based engulfment assays demonstrate that thioglycolate-elicited peritoneal macrophages from CD47 knockout mice have a higher phagocytic index than cells isolated from age-matched WT mice (n = 5 per condition; Right). (I) In contrast to lesions from Rainbow mice treated with control IgG Ab which are almost universally populated by a single SMC clone (see example of a red clone near the necrotic core; Left), lesions from Rainbow mice treated with anti-CD47 Ab demonstrate a stochastic assortment of SMCs within the neointima under the fibrotic cap (see the example with a random collection of colors; Right). Blinded quantitative analysis of plaques confirms that anti-CD47 Ab treatment is associated with an overall reduction in neointimal SMC content as well as clonal dominance in the core of BCA (brachiocephalic artery) lesions (n = 9 mice per condition; Right). Additional phenotyping and quantification of plaque stability indices, including an absence of change in SMC content in the fibrous cap, are provided in SI Appendix, Figs. S7 and S8. (J and K) Anti-CD47 Ab-treated mice have reduced C3 levels in their circulation (J) (n = 5 per condition; ELISA) and within their BCA lesions (K) (n = 9 animals per group; immunofluorescence staining). Comparisons were made by two-tailed t tests in AC, E, F, H, J, and K, Mann–Whitney U test in D, and one-way ANOVA with Tukey’s post hoc analysis in I. ***P < 0.001, **P < 0.01, *P < 0.05. NS, not significant. Error bars represent the SEM. (Scale bars, 50 μm.)

Similar articles

Cited by

References

    1. World Health Organization , The top 10 causes of death (2018). https://www.who.int/en/news-room/fact-sheets/detail/the-top-10-causes-of.... Accessed 20 January 2020.
    1. Libby P., Ridker P. M., Hansson G. K., Progress and challenges in translating the biology of atherosclerosis. Nature 473, 317–325 (2011). - PubMed
    1. Ross R., Atherosclerosis—An inflammatory disease. N. Engl. J. Med. 340, 115–126 (1999). - PubMed
    1. Gomez D., Owens G. K., Smooth muscle cell phenotypic switching in atherosclerosis. Cardiovasc. Res. 95, 156–164 (2012). - PMC - PubMed
    1. Robbins C. S.et al. ., Local proliferation dominates lesional macrophage accumulation in atherosclerosis. Nat. Med. 19, 1166–1172 (2013). - PMC - PubMed

Publication types

MeSH terms