. 2020 Jun 30;117(26):15160-15171.
doi: 10.1073/pnas.2000943117. Epub 2020 Jun 15.

Macrophage metabolic reprogramming presents a therapeutic target in lupus nephritis

Affiliations

Macrophage metabolic reprogramming presents a therapeutic target in lupus nephritis

Chenzhi Jing et al. Proc Natl Acad Sci U S A. .

Abstract

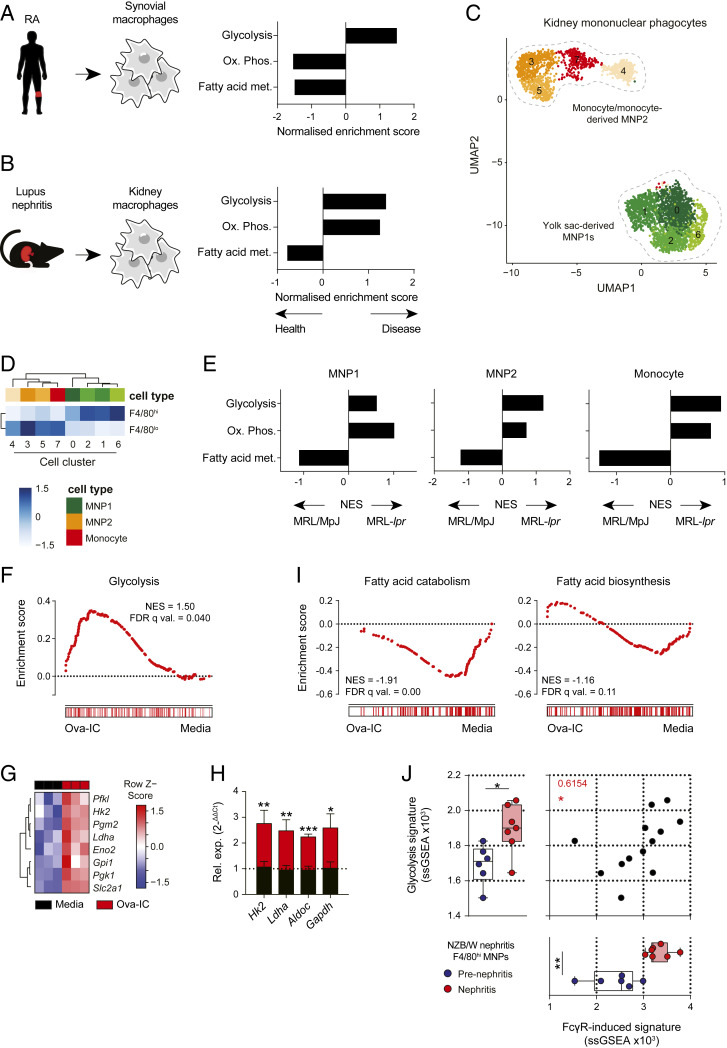
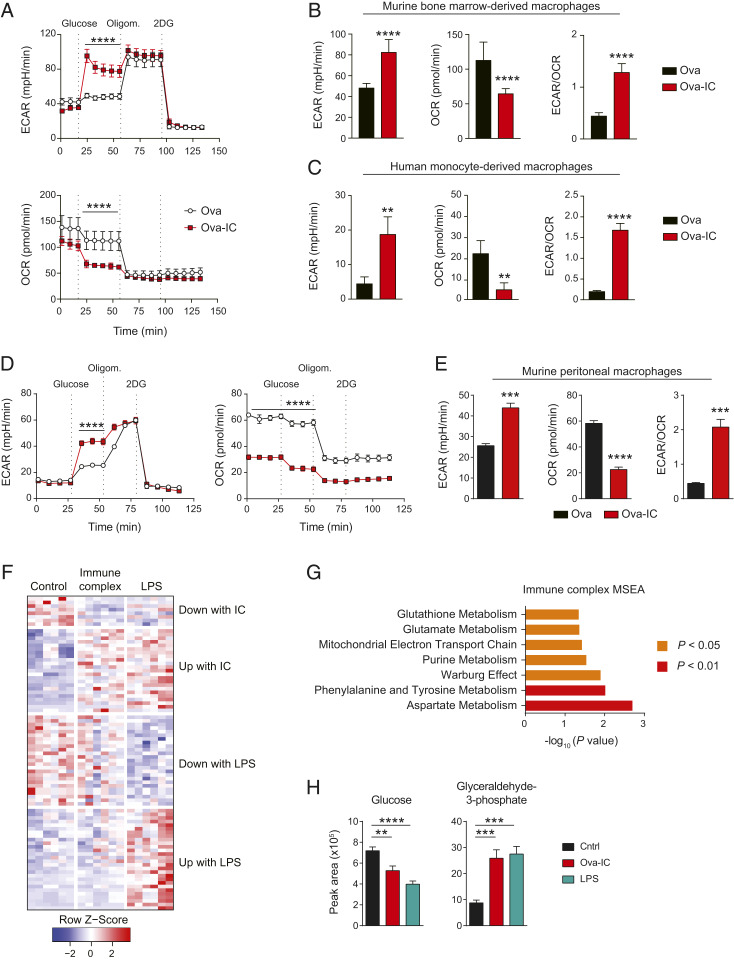
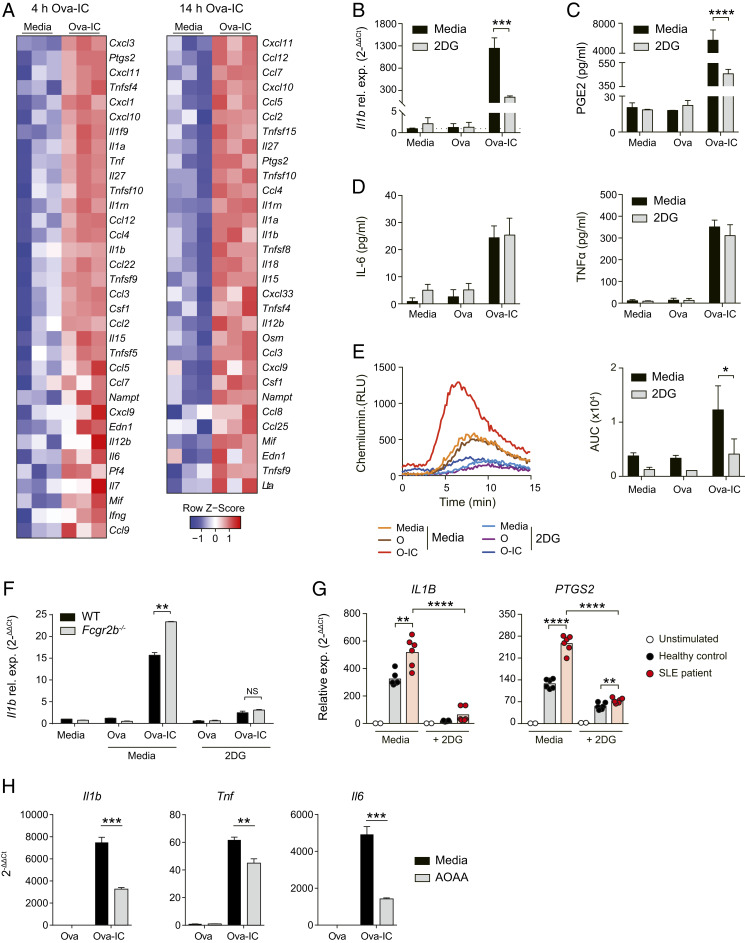
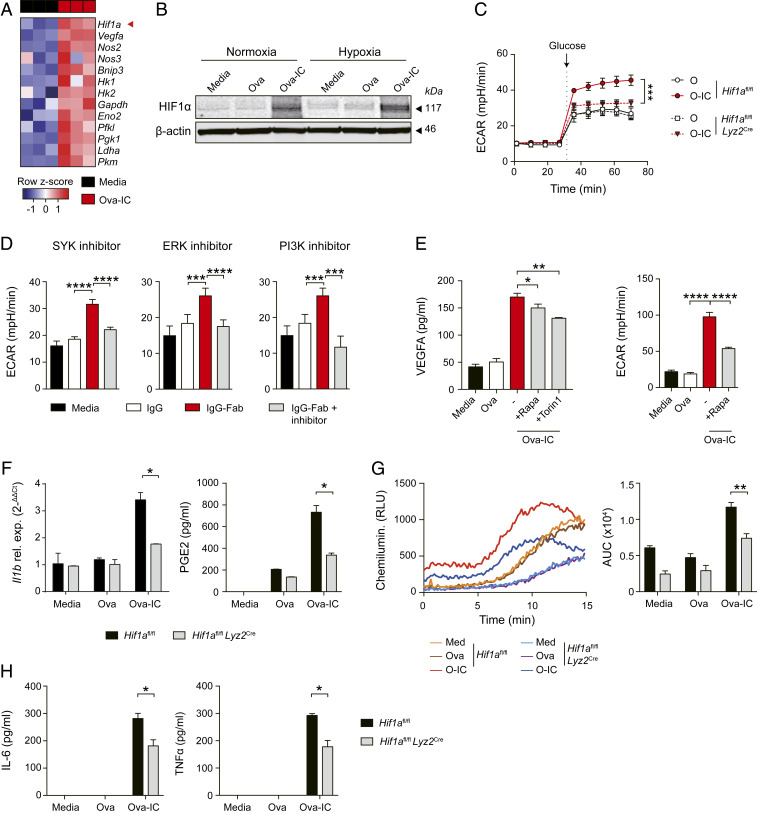
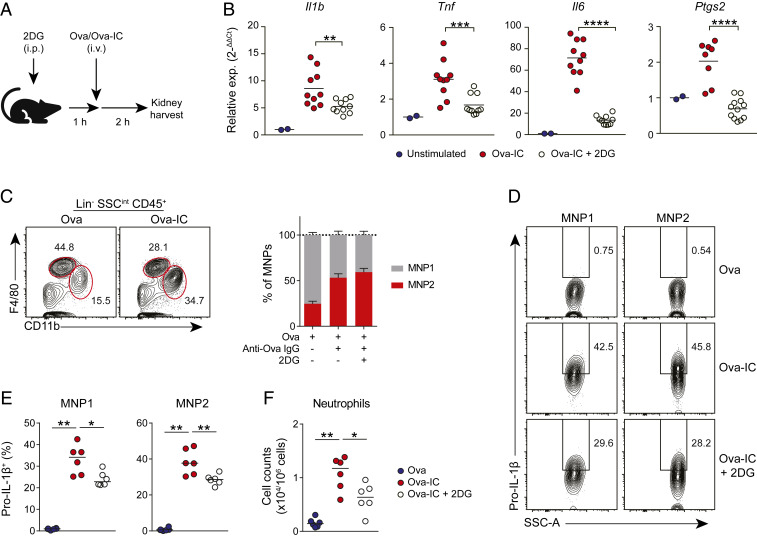
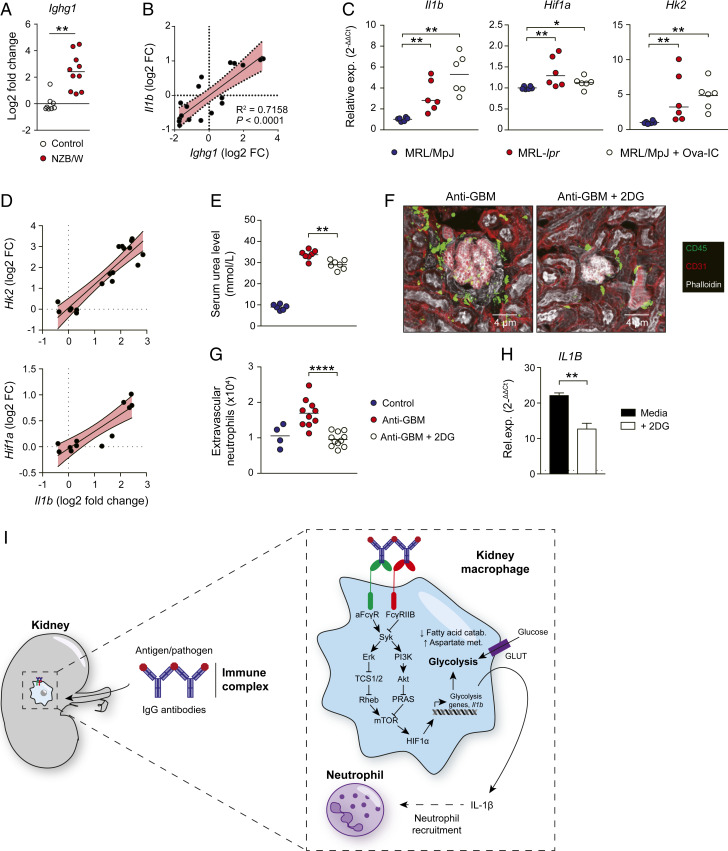
IgG antibodies cause inflammation and organ damage in autoimmune diseases such as systemic lupus erythematosus (SLE). We investigated the metabolic profile of macrophages isolated from inflamed tissues in immune complex (IC)-associated diseases, including SLE and rheumatoid arthritis, and following IgG Fcγ receptor cross-linking. We found that human and mouse macrophages undergo a switch to glycolysis in response to IgG IC stimulation, mirroring macrophage metabolic changes in inflamed tissue in vivo. This metabolic reprogramming was required to generate a number of proinflammatory mediators, including IL-1β, and was dependent on mTOR and hypoxia-inducible factor (HIF)1α. Inhibition of glycolysis, or genetic depletion of HIF1α, attenuated IgG IC-induced activation of macrophages in vitro, including primary human kidney macrophages. In vivo, glycolysis inhibition led to a reduction in kidney macrophage IL-1β and reduced neutrophil recruitment in a murine model of antibody-mediated nephritis. Together, our data reveal the molecular mechanisms underpinning FcγR-mediated metabolic reprogramming in macrophages and suggest a therapeutic strategy for autoantibody-induced inflammation, including lupus nephritis.

Keywords: Fcγ receptors; lupus nephritis; metabolism.


Conflict of interest statement

The authors declare no competing interest.

Figures

Fig. 1.
Fig. 1.
FcγR cross-linking induces a glycolytic transcriptional switch in macrophages. (A and B) Gene set enrichment analysis (GSEA) of selected Hallmarks metabolic pathways in synovial macrophages from RA patients (A) and renal macrophages from NZB/W mice (B). Data derived from GEO: GSE10500 and GSE27045, respectively. (C) UMAP plot of 3,353 single MNPs and associated cluster identities. (D) AUCell was used to test for enrichment of F4/80hi or F4/80lo gene signature (21), presented as a heat map showing the row-scaled mean enrichment score. Increasing color gradient indicates strength of enrichment (white to blue). (E) GSEA of select Hallmarks metabolic pathways in renal MNP subsets from C in nephritic MRL-lpr and control MRL/MpJ mice. (F) GSEA for Hallmarks glycolysis pathway in BMDMs stimulated with Ova-IC for 14 h. (G) Heat map of selected glycolysis genes from BMDMs shown in F. (H) qPCR analysis of selected glycolysis genes in murine BMDMs stimulated with Ova or Ova-IC for 6 h. (I) Fatty acid catabolism (GO: 0009062) and fatty acid biosynthesis (GO: 0006633) gene enrichment in BMDMs in F. (J) Correlation analysis of single sample (ss) GSEA scores for Hallmarks glycolysis pathway versus top 200 IC-induced BMDM genes in renal macrophages from B. Means ± SEM are shown for triplicate measurements and are representative of three independent experiments. P values were calculated using the two-tailed Student’s t test (H), nonparametric Mann–Whitney U test (J), and Spearman’s correlation (J; *P < 0.05; **P < 0.01, ***P < 0.001; ****P < 0.0001).
Fig. 2.
Fig. 2.
FcγR cross-linking in macrophages results in a switch to aerobic glycolysis. (A) ECAR and OCR in murine BMDMs stimulated with Ova or Ova-IC for 12 h were measured with a glycolysis stress test kit. (B and C) Quantification of ECAR, OCR, and ECAR/OCR ratio in Ova- or Ova-IC–treated murine BMDMs (B) and human MDMs (C) in the presence of glucose. Means ± SEM are shown, and data are representative of three independent experiments. (D and E) ECAR and OCR traces (D) and ECAR, OCR, and ECAR/OCR measurements in the presence of glucose (E) for murine peritoneal macrophages stimulated as in A. Mean ± SEM are shown, and data are representative of two independent experiments (n = 6 to 10 per group). (F) Heat map of differential metabolites in BMDMs stimulated with Ova (control), Ova-IC (immune complex), or LPS for 6 h. (G) Metabolite set enrichment analysis (MSEA) of differential metabolites in Ova-IC versus control macrophages. (H) Peak areas determined by mass spectrometry for glycolysis pathway metabolites altered by IgG IC stimulation in BMDMs stimulated as in F. P values were calculated using a two-way ANOVA (A and D), two-tailed Student’s t test (B, C, E, and H), and MSEA (G; *P < 0.05; **P < 0.01, ***P < 0.001; ****P < 0.0001).
Fig. 3.
Fig. 3.
IgG-induced glycolysis is required for macrophage production of inflammatory mediators. (A) Transcriptomic analysis of differentially expressed (P < 0.05) cytokines and chemokines in BMDMs stimulated with Ova or Ova-IC for 4 h or 14 h. (BD) Quantification of Il1b mRNA expression (B), PGE2 production (C), and IL-6 and TNFα production (D) by murine BMDMs stimulated with Ova/Ova-IC or unstimulated ± 2DG for 6 h. Means ± SEM are shown from triplicate measurements and are representative of three independent experiments. (E) Measurement of ROS production in murine BMDMs stimulated as in BD for 2 h. Total production of ROS in each group was quantified by calculating the area under the curve (AUC; Right). Means ± SEM are shown from triplicate measurements and are representative of three independent experiments. (F) Quantification of Il1b mRNA production by BMDMs from WT or Fcgr2b−/− mice stimulated as in BD. Means ± SEM are shown from triplicate measurements and are representative of three independent experiments. (G) qPCR of IL1B and PTGS2 mRNA in human MDMs treated with IgG-IC generated by incubating serum IgG from SLE patients or healthy controls with RNA/Sm antigen with or without the presence of 2DG for 6 h. Data are normalized to unstimulated controls (media) and HPRT1. (H) Quantification of cytokine expression in BMDMs stimulated with Ova/Ova-IC ± AOAA for 6 h. Means ± SEM are shown from four measurements and are representative of two independent experiments. P values were calculated using the two-tailed Student’s t test (*P < 0.05, **P < 0.01, ***P < 0.001, ****P < 0.0001).
Fig. 4.
Fig. 4.
HIF1α activation modulates IC-induced glycolysis switch in macrophages. (A) Heat map showing transcriptomic analysis of Hif1a and HIF1α targets genes in murine BMDMs stimulated with Ova-IC or in controls (RPMI) for 14 h. (B) Western blot of HIF1α protein relative to β-actin in murine BMDMs ± Ova-IC stimulation under normoxic or hypoxic conditions. (C) HIF1α-deficient (Hif1afl/fl Lyz2Cre) and control (Hif1afl/fl) BMDMs were stimulated with Ova or Ova-IC for 12 h. ECAR was measured before and after the addition of glucose. (D) ECAR was measured in control (media) or IgG- or IgG-Fab IC-stimulated human MDMs with the presence of small-molecule inhibitors. Macrophages were pretreated with SYK inhibitor (Left), ERK inhibitor (Middle), or PI3K inhibitor (Right) for 1 h and stimulated with IC (IgG-Fab) for 20 h. (E) Quantification of VEGFA in supernatants (Left) and ECAR (Right) from murine BMDMs stimulated with Ova, Ova-IC, or control (media) with or without the presence of mTOR inhibitors for 6 h. (F) Quantification of Il1b mRNA and PGE2 from HIF1α-deficient (Hif1afl/fl Lyz2Cre) and control (Hif1afl/fl) BMDMs stimulated with Ova, Ova-IC, or control (media) for 6 h. (G) Measurement of ROS production in BMDMs stimulated as in F for 2 h (Left). Total production of ROS in each group was quantified by calculating the area under the curve (AUC; Right). (H) Quantification of IL-6 and TNFα from HIF1α-deficient (Hif1afl/fl Lyz2Cre) and control (Hif1afl/fl) BMDMs stimulated as in F. All graphs show mean ± SEM from triplicate measurements and are representative of three independent experiments. ND, not detected. P values were calculated using a two-way ANOVA (C) or the two-tailed Student’s t test (DH; *P < 0.05, **P < 0.01, ***P < 0.001, ****P < 0.0001).
Fig. 5.
Fig. 5.
Inhibiting macrophage glycolysis reduces renal IL-1β and neutrophil recruitment in vivo. (A) Experiment design of the kidney-IgG IC model. (B) qPCR of Il1b, Tnf, Il6, and Ptgs2 mRNA in whole kidney tissue of mice treated with Ova, Ova-IC, or Ova-IC + 2DG. Data are normalized to Ova controls and Hprt. (C) MNP1 and MNP2 gating and quantification in kidneys from mice treated as in A (n = 6 per group). Means ± SEM indicated. (D and E) Intracellular pro–IL-1β staining (D) and quantification (E) by flow cytometry for kidney MNP1 and MNP2 populations from mice treated as in A (n = 6 per group). Medians are indicated. (F) Quantification of CD11b+ Ly6C/Ghi neutrophils in mouse kidneys following Ova or Ova-IC injection with or without the pretreatment of 2DG (n = 6 per group). Medians are indicated. Data are representative of three independent experiments. P values were calculated using the nonparametric Mann–Whitney U test (B, E, and F; *P < 0.05, **P < 0.01, ***P < 0.001, ****P < 0.0001).
Fig. 6.
Fig. 6.
Inhibition of IC-induced glycolytic switch reduces autoantibody-mediated renal inflammation in vivo. (A) Ighg1 expression in whole kidney tissue from NZB/W kidneys versus controls. Means are indicated. Data derived from GEO: GSE27045. (B) Correlation of Il1b with Ighg1 mRNA levels in renal tissue from NZB/W mice shown in A. (C) qPCR of Hk2, Hif1a, and Il1b mRNA in renal tissue of MRL/MpJ and MRL-lpr mice and MRL/MpJ mice injected with Ova-IC. Data are normalized to gene expression in MRL/MpJ mice and Hprt. Means are indicated. (D) Correlation of glycolysis-associated genes and Il1b mRNA in renal tissue pooled from MRL/MpJ and MRL-lpr mice. (E) Serum urea levels in mice 24 h after i.v. injection of nephrotoxic serum (anti-GBM) with or without pretreatment with 2DG (n = 6 to 7 per group). Medians are indicated. (F) Representative kidney confocal images of mice treated as in E. (G) Quantification of neutrophils in kidneys of mice treated as in G (n = 4 to 10 per group). Medians indicated. (H) qPCR of human kidney cells stimulated with Ova-IC ± 2DG for 12 h. Data are normalized to Ova control and HPRT1. (I) Graphical summary of IgG IC-induced metabolic reprogramming in kidney macrophages. For in vivo experiments (CG), medians are indicated, and each point represents a single kidney. For human kidney stimulations, means ± SEM are indicated from triplicate measurements. Data are representative of two or three independent experiment. P values were calculated using limma with multiple comparisons correction using the BH procedure (A), linear regression analysis (B), nonparametric Mann–Whitney U test (C, E, and G), or the two-tailed Student t test (H; *P < 0.05; **P < 0.01; ***P < 0.0001; ****P < 0.0001).

References

    1. Smith K. G. C., Clatworthy M. R., FcgammaRIIB in autoimmunity and infection: Evolutionary and therapeutic implications. Nat. Rev. Immunol. 10, 328–343 (2010). - PMC - PubMed
    1. Clatworthy M. R., Smith K. G., B cells in glomerulonephritis: Focus on lupus nephritis. Semin. Immunopathol. 29, 337–353 (2007). - PubMed
    1. Rahman A., Isenberg D. A., Systemic lupus erythematosus. N. Engl. J. Med. 358, 929–939 (2008). - PubMed
    1. Smith R. M., Clatworthy M. R., Jayne D. R., Biological therapy for lupus nephritis-tribulations and trials. Nat. Rev. Rheumatol. 6, 547–552 (2010). - PubMed
    1. Nimmerjahn F., Ravetch J. V., Fcgamma receptors as regulators of immune responses. Nat. Rev. Immunol. 8, 34–47 (2008). - PubMed

Publication types

MeSH terms