. 2020 Jun 30;117(26):15293-15304.
doi: 10.1073/pnas.2004262117. Epub 2020 Jun 15.

EYES ABSENT and TIMELESS integrate photoperiodic and temperature cues to regulate seasonal physiology in Drosophila

Affiliations

EYES ABSENT and TIMELESS integrate photoperiodic and temperature cues to regulate seasonal physiology in Drosophila

Antoine Abrieux et al. Proc Natl Acad Sci U S A. .

Abstract

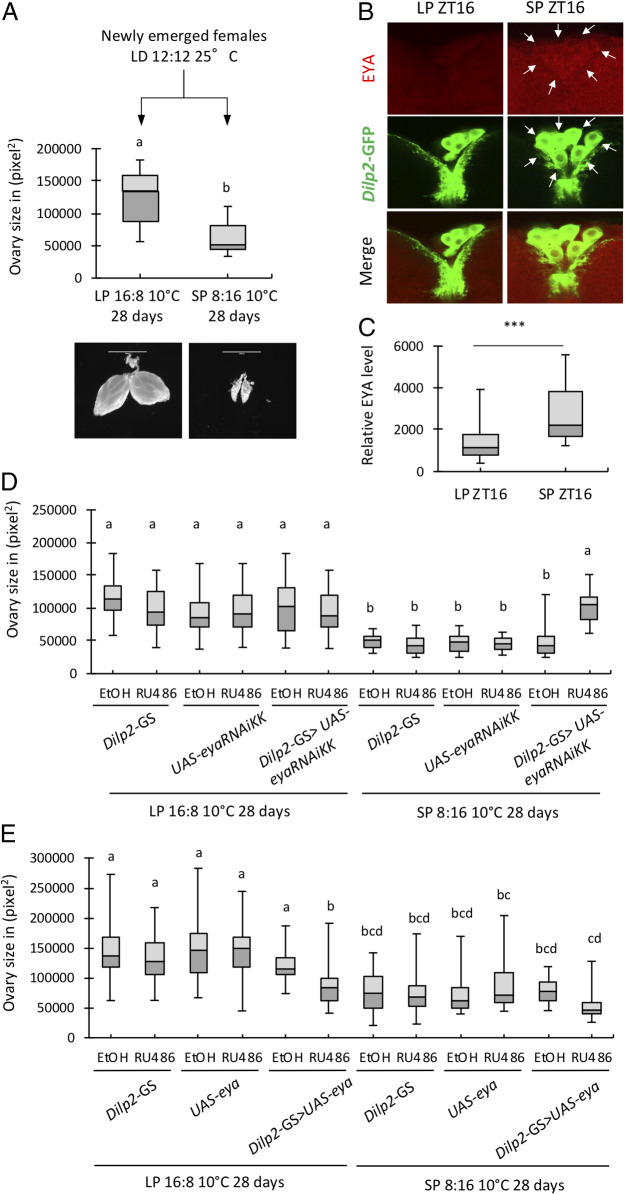
Organisms possess photoperiodic timing mechanisms to detect variations in day length and temperature as the seasons progress. The nature of the molecular mechanisms interpreting and signaling these environmental changes to elicit downstream neuroendocrine and physiological responses are just starting to emerge. Here, we demonstrate that, in Drosophila melanogaster, EYES ABSENT (EYA) acts as a seasonal sensor by interpreting photoperiodic and temperature changes to trigger appropriate physiological responses. We observed that tissue-specific genetic manipulation of eya expression is sufficient to disrupt the ability of flies to sense seasonal cues, thereby altering the extent of female reproductive dormancy. Specifically, we observed that EYA proteins, which peak at night in short photoperiod and accumulate at higher levels in the cold, promote reproductive dormancy in female D. melanogaster Furthermore, we provide evidence indicating that the role of EYA in photoperiodism and temperature sensing is aided by the stabilizing action of the light-sensitive circadian clock protein TIMELESS (TIM). We postulate that increased stability and level of TIM at night under short photoperiod together with the production of cold-induced and light-insensitive TIM isoforms facilitate EYA accumulation in winter conditions. This is supported by our observations that tim null mutants exhibit reduced incidence of reproductive dormancy in simulated winter conditions, while flies overexpressing tim show an increased incidence of reproductive dormancy even in long photoperiod.

Keywords: alternative splicing; circadian clock; photoperiod; seasonality; temperature.


Conflict of interest statement

The authors declare no competing interest.

Figures

Fig. 1.
Fig. 1.
Genetic manipulation of eya in the PI impacts reproductive dormancy. (A) Levels of reproductive dormancy determined by ovary size measurement (in pixel2) in WT (w1118) females reared for 28 d at 10 °C in long photoperiod (LP 16L:8D) and short photoperiod (SP 8L: 16D). The whisker caps represent the minimum and maximum values; different letters indicate significant differences in ovary size between groups. All error bars indicate SEM. Mann−Whitney test, P < 0.0001, n = 40. (Scale bar: 1,000 μm.) (B) Comparison of EYA levels in dilp2-Gal4 > UAS-cd8-GFP brains between LP and SP at ZT16 (10 °C). White arrows denote EYA-positive cells. (Magnification: 355×.) (C) Quantification of EYA staining in IPCs. Five or six neurons per brain were imaged for eight or nine brains. ***P < 0.001, Mann−Whitney test. Ovary size of females (D) expressing eya dsRNAs (dilp2-GS > eyaRNAiKK in the presence of RU486) or (E) overexpressing eya (dilp2-GS > UAS-eya in the presence of RU486) in dilp2 neurons at adult stage as compared to parental controls and vehicle control (EtOH) in LP and SP. Kruskall−Wallis test with Dunn’s multiple comparison test, P < 0.001, n= 30 to 40 per group.
Fig. 2.
Fig. 2.
The peak phase of EYA protein expression is regulated by photoperiod. (A) Schematic diagram illustrating conditions and collection time points for photoperiodic shift experiments (black arrows denote collection time points). Samples were collected on LP3, SP5, and SP10 at 4-h intervals over 24-h periods. (BD) Western blots and quantifications comparing EYA expression profiles between head extracts of w1118 on LP3, SP5, and SP10 (peak phase: LP3 = ZT8, SP5 and SP10 = ZT16, P < 0.01 for all conditions, JTK-CYCLE). EYA protein levels were detected using ⍺-EYA10H6 (top isoform was used for quantification). ⍺-HSP70 was used to indicate equal loading and for normalization. (EG) Comparison of eya mRNA expression in heads of w1118 flies between LP3, SP5, and SP10 normalized to cbp20 (peak phase: all at ZT12, P < 0.05 for all conditions, JTK-CYCLE). The gray shading on each graph indicates when lights were off during each sampling period (ZT: Zeitgeber time [hours]). Data are mean ± SEM of n = 4 replicates for mRNA analysis (two technical replicates for each of the two biological replicates) and n = 3 biological replicates for protein analysis.
Fig. 3.
Fig. 3.
Low temperature induces significant increase in eya expression and amplitude at both transcriptional and protein levels. (A) Schematic diagram depicting experimental conditions for testing effect of temperature on eya mRNA and EYA protein. Newly emerged flies were reared at 10 °C for 3 d in LD12:12 at 25 °C followed by 7 d at either 25 °C or 10 °C. Flies were collected on day 3 prior to shifting half of the flies into 10 °C and on day 10 at 4-h intervals over 24-h periods. (B−D) Western blots and quantifications comparing EYA expression profiles between head extracts of w1118 on 3 d at 25 °C, 10 d at 25 °C, and 10 d at 10 °C (peak phase: 3D25 = ZT14, 10D25 = ZT16, 10D10 = ZT14, P < 0.0001 for all conditions, JTK-CYCLE). EYA levels were detected using ⍺-EYA10H6 (top isoform was used for quantification). ⍺-HSP70 was used to indicate equal loading and for normalization. (EG) Comparison of eya mRNA expression in heads of w1118 flies between 3 d at 25 °C, 10 d at 25 °C and 10 d at 10 °C normalized to cbp20 (peak phase: all at ZT12, P < 0.05 for all conditions, JTK-CYCLE). The gray shading in each graph indicates when lights were off during each sampling period. Data are mean ± SEM of n = 4 for mRNA analysis (two technical replicates for each of the two biological replicates) and n = 3 biological replicates for protein analysis.
Fig. 4.
Fig. 4.
Light affects EYA protein stability. (A) The eya mRNA expression in heads of w1118 flies collected on LD4 and DD1 after 3 d of entrainment (LD1-3) at LD12:12 at 25 °C. (LD: peak phase = ZT12, p(LD) < 0.0001; p(DD) = 1, JTK-CYCLE). (B) The eya mRNA expression in heads of w1118 compared to w; clkout in LD (12:12). Flies were harvested on LD4 at LD12:12 at 25 °C (peak = ZT12, p(WT) < 0.0001, p(clkout) < 0.005, JTK-CYCLE). (C and D) The eya mRNA expression in heads of w1118 flies collected on (C) LD4 and LL1 (peak = ZT12, p(LD4) < 0.0001, p(LL1) < 0.001, JTK-CYCLE) and (D) LD5 and LL2 (peak = ZT12, p(LD5) < 0.0001; p(LL2) = 1, JTK-CYCLE) after 3 d of entrainment at LD12:12 at 25 °C. Data are mean ± SEM of n = 4 (two technical replicates for each of the two biological replicates). Asterisks denote significant differences between conditions or genotypes at each ZT: ***P < 0.001, *P < 0.05, two-way ANOVA with post hoc Tukey’s HSD tests. (E) Western blots comparing EYA expression profiles in heads of w1118 flies collected on LD4 and LL1. Top, Middle, and Bottom panels detect EYA, TIM, and HSP70 expression, respectively. (F) Quantification of E and expressed as relative expression (highest value = 1) (peak = ZT16, p(LD4) < 0.005; p(LL1) = 1, JTK-CYCLE). Second replicate of protein analysis is shown in SI Appendix, Fig. S4A (n = 2).
Fig. 5.
Fig. 5.
Genetic manipulation of tim affects EYA protein stability and incidence of reproductive dormancy. (A and C) Western blots comparing EYA expression profiles in tim null mutant (yw; tim0) and tim overexpressor (w1118; p{tim(WT)}) to WT (yw or w1118) controls. Flies were entrained in LD (12:12) at 25 °C for 3 d and collected at six time points on LD4. (B and D) Quantification of Western blots shown in A and C and expressed as relative expression (highest value = 1). Second replicates of protein analyses are shown in SI Appendix, Fig. S4 B and C (n = 2). (E and F) Daily eya mRNA expression in tim null mutant (yw; tim0) and tim overexpressor (w1118; p{tim(WT)}) as compared to respective WT controls. Data are mean ± SEM of n = 4 (two technical replicates for each of the two biological replicates). Two-way ANOVA with post hoc Tukey’s HSD tests. (G and H) Ovary size of female tim null (yw; tim0) and tim overexpressor (w; p{tim(WT)}) as compared to WT (yw or w1118) in reproductive dormancy assay. The whisker caps represent the minimum and maximum values; different letters indicate significant differences in ovary size between groups with P < 0.001, except for difference between b and c in H. P < 0.05, n = 40 females per group, one-way ANOVA followed by post hoc Tukey test.
Fig. 6.
Fig. 6.
Expression of TIM-L and TIM-SC is temperature dependent. Flies were reared using the same condition as in Fig. 3. (A) Western blots comparing TIM expression profiles between head extracts of w1118 collected on 3 d at 25 °C, 10 d at 25 °C, and 10 d at 10 °C. Both TIM-L and TIM-SC isoforms were detected using ⍺-TIM (a gift from M. Young’s laboratory, The Rockefeller University, New York, NY) (32, 68), and ⍺-HSP70 was used to indicate equal loading and for normalization. (B and C) Quantification of Western blot signals shown in A and expressed as relative expression (highest value = 1). (B) Peak = ZT16, p(3D25) < 0.0001, p(10D25) < 0.0001; p(10D10) = 1, JTK-CYCLE; (C) p(3D25) = 1, p(10D25) = 1, p(10D10) = 0.064, JTK-CYCLE. Second replicate of protein analysis is shown in SI Appendix, Fig. S4D (n = 2). (DG) Comparison of tim-M, tim-L+M, tim-cold, and tim-sc mRNA expression profiles in heads of w1118 flies between 3 d at 25 °C, 10 d at 25 °C, and 10 d at 10 °C normalized to cbp20. Data are mean ± SEM of n = 4 (two technical replicates for each of the two biological replicates). Asterisks denote significant differences between 10 d at 25 °C and 10 d at 10 °C at each ZT: ****P < 0.0001, ***P < 0.001, **P < 0.01, *P < 0.05, two-way ANOVA with post hoc Tukey’s HSD tests.
Fig. 7.
Fig. 7.
TIM-SC shows higher affinity for EYA as compared to TIM-L. (A) Western blots showing results of reciprocal coimmunoprecipitation (coIP) assays to detect interaction of EYA with TIM-L and TIM-SC in Drosophila S2 cells. Proteins extracted from S2 cells were either immunoprecipitated with α-FLAG to pull down EYA or with α-HA to pull down either TIM-L or TIM-SC. Negative control coIPs were performed using α-V5, which do not recognize the proteins of interest. Immunocomplexes were subjected to Western blotting to detect the bait protein or protein interactions. Input for the coIP is indicated (Lys). (B) Bar graphs showing quantification of reciprocal coIP assays (n = 4). Values for binding of interacting proteins were normalized to amount of bait detected in the respective IPs. Error bars indicate ±SEM (*P < 0.05, two-tailed Student’s t test). (CE) The eya-gal4/UAS-cd8-GFP brains from flies collected on SP5 (ZT16) at 10 °C were stained for (C) GFP and (D) TIM. OL: optic lobes; PI: pars intercerebralis. (E) Merged images showing colocalization of GFP (eya) and TIM in the OL but not in the PI. Eight or nine brains were imaged. Scale bars for whole brain and OL represent 100 nm and scale bar for PI represents 10 nm.

References

    1. Emerson K. J., Bradshaw W. E., Holzapfel C. M., Complications of complexity: Integrating environmental, genetic and hormonal control of insect diapause. Trends Genet. 25, 217–225 (2009). - PubMed
    1. Nylin S., Induction of diapause and seasonal morphs in butterflies and other insects: Knowns, unknowns and the challenge of integration. Physiol. Entomol. 38, 96–104 (2013). - PMC - PubMed
    1. Bonini N. M., Leiserson W. M., Benzer S., The eyes absent gene: Genetic control of cell survival and differentiation in the developing Drosophila eye. Cell 72, 379–395 (1993). - PubMed
    1. Jin M., Mardon G., Distinct biochemical activities of eyes absent during Drosophila eye development. Sci. Rep. 6, 23228 (2016). - PMC - PubMed
    1. Duncan M. K. et al. ., Eyes absent: A gene family found in several metazoan phyla. Mamm. Genome 8, 479–485 (1997). - PubMed

Publication types